
BND (Vanguard Total Bond Market ETF) and AGG (iShares Core U.S. Aggregate Bond ETF) are two of the most well-known U.S. bond ETFs. Both offer broad exposure to investment-grade bonds, but subtle differences in performance, risk, and income generation can influence your choice.
Key takeaways:
- 5-Year Returns (as of Nov 10, 2025): BND: -0.43%, AGG: -0.34%. Both struggled during a period of rising interest rates.
- Dividend Yields: AGG currently offers a slightly higher yield (3.84%) compared to BND (3.80%).
- Interest Rate Sensitivity: AGG has a longer duration (~6.3 years) vs. BND (~5.9 years), making it slightly more sensitive to rate changes.
- Risk Metrics: BND has lower volatility and smaller price swings than AGG, which may appeal to conservative investors.
- Portfolio Composition: Both hold U.S. Treasuries, corporate bonds, and mortgage-backed securities, focusing on investment-grade credit quality.
Quick Comparison
| Metric | BND | AGG |
|---|---|---|
| 5-Year Return | -0.43% | -0.34% |
| Dividend Yield | 3.80% | 3.84% |
| Average Duration | ~5.9 years | ~6.3 years |
| Volatility (5-day) | 24.27% | 26.39% |
| Standard Deviation | 1.53% | 2.09% |
| Assets Under Mgmt | $142.1B | Not disclosed |
Both funds are highly correlated (0.92), so their price movements are nearly identical. Your choice should depend on your risk tolerance and investment goals. BND may suit those seeking lower volatility, while AGG might appeal to those prioritizing slightly higher income.
BND (Vanguard Total Bond Market ETF) Overview
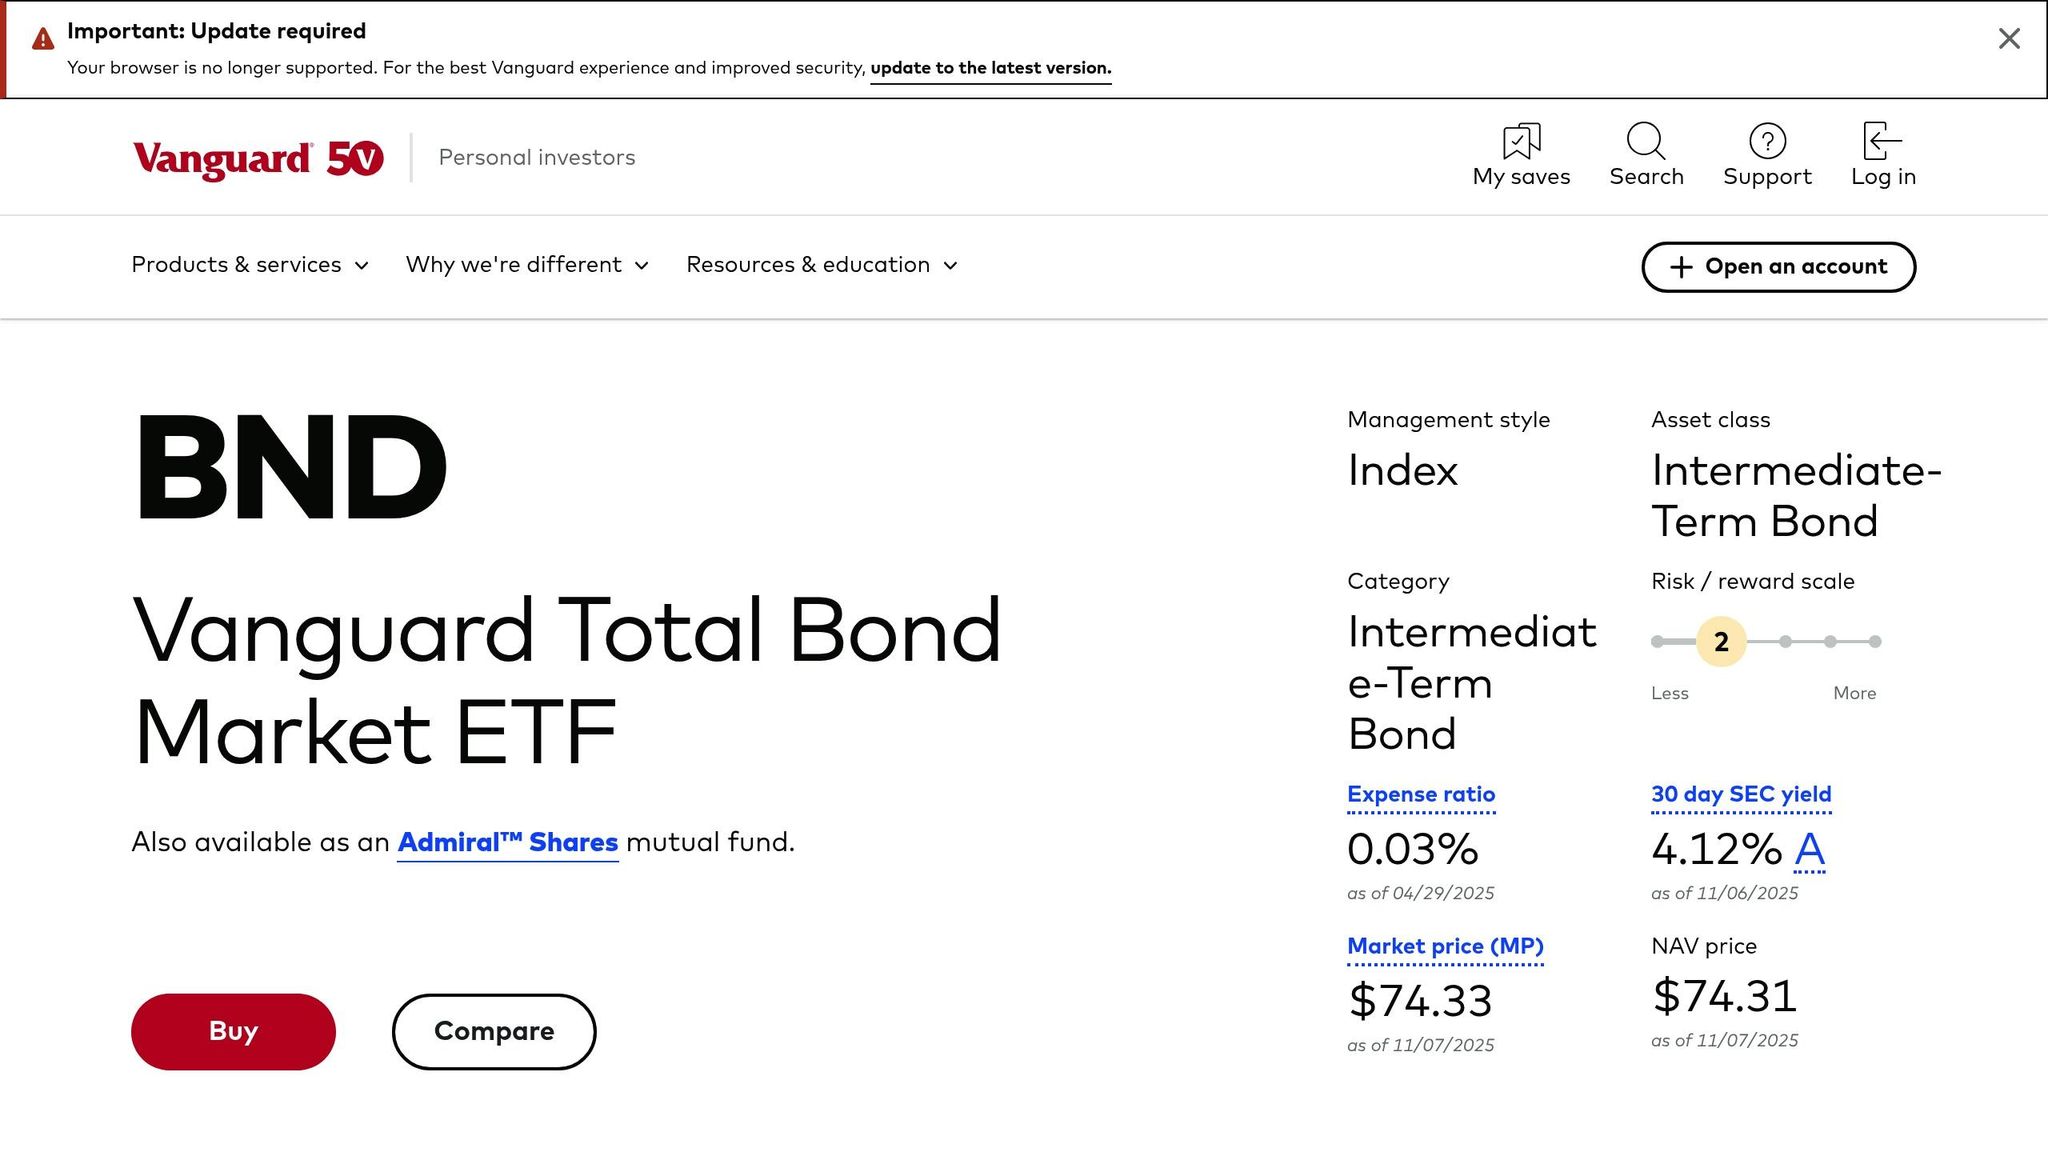
Basic Facts and Features
The Vanguard Total Bond Market ETF (BND) mirrors the Bloomberg U.S. Aggregate Float-Adjusted Index, employing a market-cap weighted approach. This means the larger the issuer, the greater their influence on the fund’s portfolio.
BND manages a staggering $142.1 billion in assets, spread across 17,686 securities. Interestingly, only about 4.83% of its assets are allocated to its top 10 holdings - much less concentrated than the average bond ETF, where top holdings typically account for 34.62% of assets. For comparison, the average bond ETF holds 1,532 securities, making BND’s portfolio significantly broader. Its diversification includes U.S. Treasuries (51.46%), corporate bonds (25.54%), mortgage-backed securities (19.36%), asset-backed securities (2.13%), and municipal bonds. The fund leans toward shorter-duration bonds, focusing solely on U.S. dollar-denominated, investment-grade securities. This approach eliminates currency risk, providing a purely domestic fixed-income option. Thanks to its design, BND serves as a reliable cornerstone for a diversified fixed-income portfolio.
Target Investor Profile
BND is ideal for conservative investors seeking broad exposure to U.S. investment-grade bonds while minimizing concentration risk. The fund’s main goal is to deliver income through its extensive and diverse portfolio. It’s particularly appealing to those who value comprehensive bond market coverage and prefer a passive, long-term investment approach. With its market-cap weighting, BND naturally adapts to changes in the U.S. bond market, making it a solid choice for steady, hands-off investors.
AGG (iShares Core U.S. Aggregate Bond ETF) Overview
Basic Facts and Features
The iShares Core U.S. Aggregate Bond ETF (AGG) comes with an average duration of 6.3 years. This intermediate-term duration means the fund is more sensitive to interest rate changes compared to shorter-duration funds. When rates rise, the portfolio value tends to drop more noticeably. On the flip side, falling rates often result in more significant gains. This sensitivity to rate fluctuations is an important factor to consider when assessing the risks associated with this fund.
5-Year Returns and Dividend Yields
Return Performance Data
BND and AGG both follow benchmarks that offer broad exposure to U.S. investment-grade bonds, resulting in nearly identical portfolio compositions. While specific five-year total return figures aren't provided, their overlapping holdings suggest similar performance during this period. Both funds have weathered periods of rising interest rates, with their diversified bond portfolios helping to mitigate market volatility. This brings us to a closer look at their income generation.
Income Generation Comparison
The dividend yields of BND and AGG show slight differences, but both deliver reliable monthly income. As of November 3, 2025, AGG edges out BND with a slightly higher yield, reversing an earlier trend where BND had the upper hand. AGG currently offers an annual dividend rate of $3.85 with a yield of 3.84%, while BND provides an annual dividend rate of $2.83 and a yield of 3.80%. Both ETFs stick to consistent monthly distribution schedules, reflecting income earned from their underlying bond portfolios.
Income and Performance Summary
| Metric | BND | AGG |
|---|---|---|
| Annual Dividend Rate | $2.83 | $3.85 |
| Dividend Yield | 3.80% | 3.84% |
| Distribution Frequency | Monthly | Monthly |
| Classification | Intermediate-term Core Bond | Intermediate-term Core Bond |
| Morningstar Recognition | 8 Best Core Bond ETFs to Buy Now, August 2025 | 8 Best Core Bond ETFs to Buy Now, August 2025 |
This data underscores how closely aligned these funds are in terms of income generation and investment strategy. While AGG currently offers a slight yield advantage, these differences can shift over time as market conditions evolve. For investors, the focus should remain on the consistent monthly income these funds provide rather than minor variations in yield.
Risk Profile Analysis
Interest Rate Sensitivity
When it comes to interest rate risks, both BND and AGG are affected in similar ways, though AGG shows slightly greater sensitivity due to its longer average duration. AGG's average duration sits at roughly 6.3 years, compared to BND's 5.9 years. Duration is a key metric that measures how much a bond fund's price might change in response to interest rate fluctuations. For instance, a 1% increase in interest rates could lead to an estimated price drop of 6.3% for AGG and 5.9% for BND. While the difference may seem small, it can become more pronounced during periods of rapid rate changes.
Volatility data further highlights this sensitivity. AGG's 5-day volatility stands at 26.39%, compared to BND's 24.27%. Over a 20-day period, AGG records a volatility of 3.44%. These figures align with earlier observations of how the two funds respond differently to shifts in interest rates.
In addition to interest rate risks, both funds share similar credit profiles, which significantly influence their overall risk management.
Credit Quality Breakdown
The credit exposure of BND and AGG is nearly identical. Both funds primarily invest in U.S. Treasury securities, government agency bonds, investment-grade corporate debt, and mortgage-backed securities. They avoid high-yield, or "junk", bonds, focusing instead on securities rated BBB- or higher by major credit rating agencies.
Treasury and government agency bonds form the backbone of both portfolios, offering stability during turbulent market periods. Corporate bonds represent the next largest allocation, followed by mortgage-backed securities, which add another layer of diversification.
These qualitative observations are backed by quantitative risk metrics, as shown below.
Risk Metrics Table
| Risk Metric | BND | AGG |
|---|---|---|
| Standard Deviation | 1.53% | 2.09% |
| Average Duration | ~5.9 years | ~6.3 years |
| 5-Day Volatility | 24.27% | 26.39% |
| 20-Day Volatility | Not available | 3.44% |
| Credit Quality Focus | Investment Grade | Investment Grade |
BND's lower standard deviation of 1.53% compared to AGG's 2.09% suggests that BND experiences smaller price swings over time. This reduced volatility may make BND a better choice for conservative investors who prioritize steadier performance.
sbb-itb-e429e5c
Performance During Rate Increases
Maximum Loss Analysis
When interest rates surged significantly, both ETFs experienced their steepest losses, reaching their lowest points on October 20, 2022. This period of high inflation and rapid rate hikes played a major role in these declines, setting the stage for the recovery that followed in 2023.
Recovery Patterns
After hitting their lows, both BND and AGG bounced back in 2023, delivering positive annual returns. This recovery aligns with earlier insights into how these funds respond to interest rate changes and manage risk. The rebound reflects the rate sensitivity metrics previously discussed, offering valuable context for shaping future investment strategies.
Rate Spike Impact Table
| Impact Metric | BND | AGG |
|---|---|---|
| Maximum Drawdown Date | October 20, 2022 | October 20, 2022 |
| 2023 Recovery Return Status | Positive | Positive |
Investment Decision Guidelines
BND vs AGG Selection Criteria
BND and AGG have a high correlation of 0.92, indicating their price movements are almost identical. Choosing between the two should depend on your overall strategy and specific investment goals. This close similarity highlights the importance of using precise allocation tools to fine-tune your portfolio.
Mezzi's Bond Portfolio Tools
Mezzi's platform simplifies the allocation process between these ETFs. It features an optimizer that backtests different weightings against benchmarks while aligning with your risk tolerance. Additionally, real-time monitoring helps you rebalance your portfolio effectively as interest rates fluctuate.
The platform also includes tools for tax management and X-Ray risk analysis. The tax tools help you avoid wash sales across multiple accounts, ensuring compliance and efficiency. Meanwhile, the X-Ray feature uncovers hidden bond exposures, giving you a clearer picture of your overall holdings.
BND vs. AGG - Which Total U.S. Bond Market Fund?
Conclusion
BND and AGG, two prominent U.S. bond ETFs, have shown a strong correlation and nearly identical performance over the past five years. With overlapping holdings and similar reactions to interest rate changes, the deciding factors for investors often come down to finer details - like expense ratios - rather than any dramatic differences in performance. These subtle distinctions underscore the value of tailoring investment choices to individual portfolio needs.
Both ETFs maintain solid credit quality, with the bulk of their holdings in government and investment-grade corporate bonds. As explored in the performance and risk assessments, their ability to deliver steady income alongside dependable credit quality makes them reliable options. Ultimately, the decision between BND and AGG should align with your portfolio's specific requirements rather than seeking a clear-cut "winner."
Mezzi’s suite of tools - such as the optimizer, X-Ray feature, and tax management - simplifies allocation decisions and helps investors navigate market changes with ease. These tools, previously discussed, also help prevent costly wash sales across accounts, potentially saving substantial amounts each year.
The real takeaway is to integrate these insights into your broader bond strategy. Instead of focusing on picking one ETF over the other, consider how each fits into your overall investment approach. With Mezzi’s real-time monitoring and rebalancing features, you can ensure your allocations stay on track as market conditions shift, making the BND versus AGG choice a seamless part of a comprehensive bond strategy.
FAQs
How do differences in duration between BND and AGG impact their performance when interest rates change?
BND and AGG share similar duration profiles, which means their prices react in much the same way to changes in interest rates. When rates go up, both typically experience price drops; when rates fall, their prices usually increase.
That said, slight differences in their portfolio makeup - such as variations in credit quality or yield - can affect their performance during rate changes. Grasping these subtle distinctions can help you tailor your bond investments to fit your risk comfort level and market expectations.
How does the high correlation between BND and AGG impact portfolio diversification?
A strong correlation between BND and AGG suggests their prices often move in tandem. This limits their ability to provide diversification within a portfolio since they’re likely to respond similarly to market changes.
For investors, this means owning both ETFs might not do much to reduce overall portfolio risk. To improve diversification and manage risk more effectively, it might be worth exploring other asset classes or bond funds with weaker correlations.
How do BND and AGG's credit quality impact their risk and appeal for conservative investors?
Both BND and AGG concentrate on investment-grade bonds, which are viewed as safer and more stable compared to high-yield bonds. This focus on bonds with higher credit ratings helps minimize overall risk, making them appealing for conservative investors who value protecting their capital over chasing higher returns.
Although these ETFs have similar credit profiles, slight variations in their holdings and management approaches can lead to minor differences in performance during market shifts. That said, for investors who prefer a cautious approach, either ETF serves as a dependable cornerstone for building a bond-focused portfolio.
Related Blog Posts
Table of Contents
Book Free Consultation
Walk through Mezzi with our team, review your current situation, and ask any questions you may have.