
ETF overlap occurs when you hold multiple ETFs that share the same underlying stocks. This can lead to unintended concentration risks, reduced diversification, and inefficiencies in your portfolio. For example, owning both SPY and QQQ may expose you to overlapping stocks like Apple and Microsoft, which dominate both funds.
Key Takeaways:
- Overlap Risks: High overlap (above 70%) undermines diversification and increases exposure to specific stocks or sectors.
- Costs: Duplicate holdings mean paying management fees twice for similar investments.
- Solutions: Tools like ETF overlap analyzers help identify redundancies, reduce overlap, and improve portfolio balance.
Why It Matters: Overlap can quietly erode your portfolio's efficiency. By managing overlap, you can lower costs, reduce risk, and ensure your investments are truly diversified. Tools like Mezzi's ETF Overlap Analyzer simplify this process by providing clear insights into your holdings, helping you make smarter decisions for long-term growth.
Why ETF Overlap Matters In Your Portfolio
Key Concepts of ETF Overlap
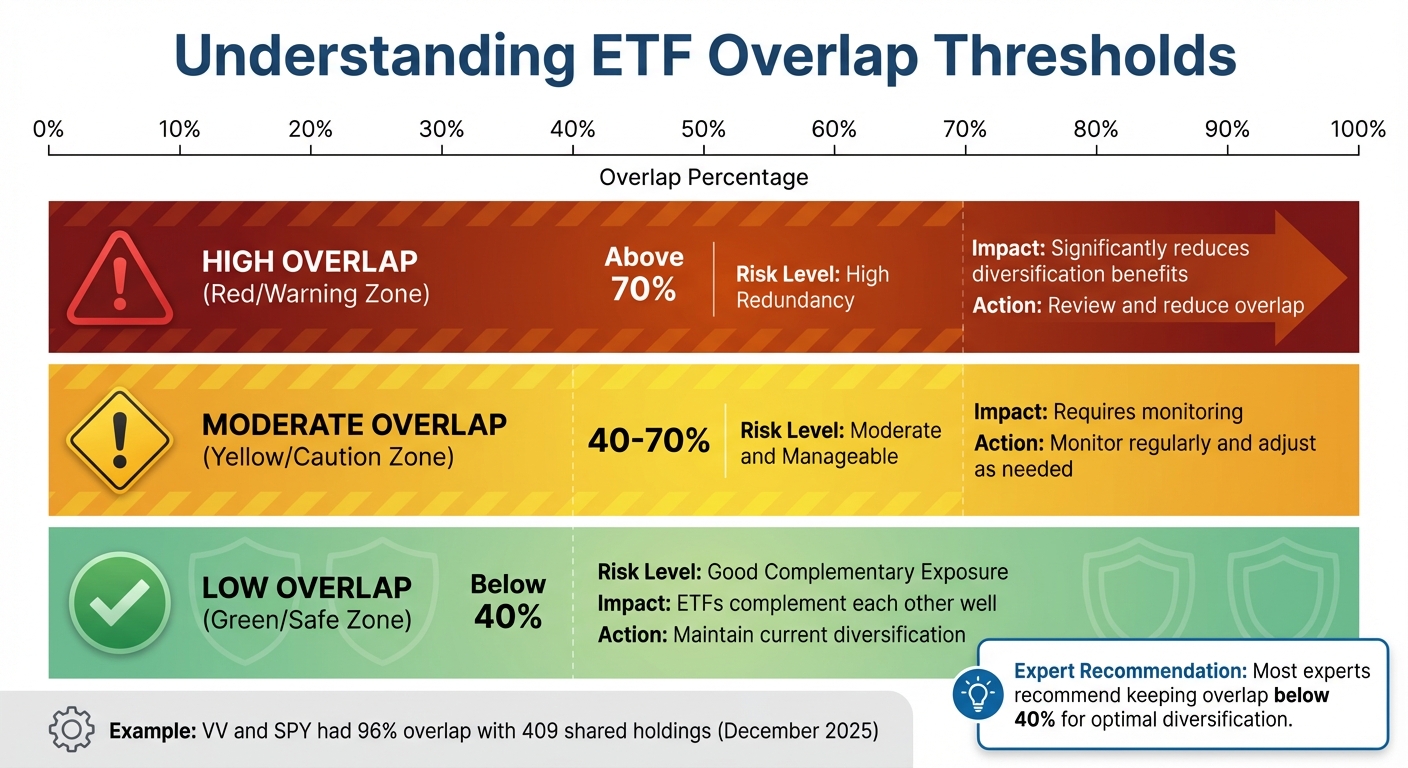
ETF Overlap Thresholds and Risk Levels Guide
Key Metrics: Overlap Percentage, Weighting, and Risk
When evaluating ETF overlap, three metrics take center stage: overlap percentage, weighting, and concentration risk. Overlap percentage measures the similarity between two ETFs by comparing their underlying holdings. For instance, if two funds include Apple, Microsoft, and Amazon with comparable allocations, they’ll display a high overlap.
Weighting, on the other hand, highlights how much each shared stock contributes to your entire portfolio. Concentration risk arises when overlapping positions dominate your portfolio, leaving you vulnerable to significant losses if those specific stocks underperform. These metrics are essential for understanding how diversified - or concentrated - your portfolio truly is.
With these tools in hand, let’s dive into the main reasons why overlap occurs.
Common Causes of ETF Overlap
ETF overlap often stems from three main scenarios. First, broad market index funds naturally share holdings since they track similar benchmarks. For example, the Vanguard Total Stock Market ETF (VTI) and Vanguard S&P 500 ETF (VOO) both provide exposure to U.S. stocks. However, while VTI covers the entire market, VOO focuses exclusively on the S&P 500.
Second, sector-specific ETFs frequently overlap with broader funds. A technology-focused ETF, for instance, will likely include many of the same companies - like Apple and Microsoft - that are already part of an S&P 500 fund. Lastly, with over 3,000 ETFs available in the U.S. market, it’s easy for investors to unknowingly select funds with similar strategies or geographic focuses, leading to unintended duplication.
Given the sheer number of ETFs available, some level of overlap is almost unavoidable. Even seasoned investors can end up with portfolios where multiple funds hold the same positions.
Understanding these causes can help you set realistic thresholds for acceptable overlap.
Understanding Overlap Thresholds
Overlap thresholds offer a practical way to gauge portfolio redundancy. High overlap (above 70%) signals significant redundancy, which can undermine diversification benefits. Moderate overlap (40-70%) is more manageable but should still be monitored. Low overlap (below 40%) typically indicates that your ETFs complement each other well.
“Generally, ETF overlap above 70% indicates high redundancy and may reduce diversification benefits. Overlap between 40-70% is moderate and manageable, while below 40% suggests good complementary exposure. However, the 'right' amount depends on your investment strategy, risk tolerance, and portfolio goals”.
While experts often recommend keeping overlap below 40% to maintain diversification, the ideal threshold depends on your individual goals. For example, a growth-oriented investor might accept higher overlap in technology stocks, whereas a conservative investor focused on stability would aim to minimize overlap across all holdings. Regularly reviewing your portfolio ensures your overlap levels remain in line with your objectives, especially as markets evolve.
These principles equip investors to make informed decisions using tools like Mezzi's ETF Overlap Analyzer, enabling smarter portfolio adjustments.
How ETF Overlap Analyzers Work
Data Inputs and Calculation Process
To begin, you input ETF ticker symbols into the analyzer, which then pulls the associated holdings and their respective weights. It uses CUSIP-level data to ensure accurate matching of securities. Once the common holdings are identified, the tool calculates both the number and the weight of the overlapping securities. For instance, when comparing SPY and QQQ in December 2025, the analyzer found 88 shared holdings, representing a 52% overlap by weight. Notably, NVIDIA CORP appeared in both ETFs, with a 7.6% weight in SPY and 9.9% in QQQ. Similarly, Apple Inc. accounted for 7.0% in SPY and 8.3% in QQQ. This precise data matching provides a solid foundation for generating actionable insights about your portfolio.
Outputs and Insights Provided
Once the data is processed, the tool delivers a detailed breakdown of ETF and stock holdings. This "x-ray" view highlights recurring securities, their average weights, and areas of concentration. The output often includes insights into sector allocation, geographic exposure, and currency distribution - helpful for spotting diversification gaps. Some advanced analyzers even offer correlation analysis, showing how different assets move in relation to one another, which is crucial for maintaining effective diversification. Additionally, the holdings data is typically updated daily, ensuring you’re working with the most current information.
Portfolio-Wide vs. Pairwise Analysis
The analyzer isn’t limited to comparing individual ETFs. It also supports broader portfolio analysis. Pairwise analysis focuses on two U.S.-listed ETFs, providing details like common holdings, overlap percentages, and shared securities. While this method is quick and straightforward, it can become unwieldy when managing multiple funds. For more complex portfolios, portfolio-wide analysis examines several ETFs at once - some tools can handle up to five mutual fund schemes in a single analysis. This approach uncovers overlapping exposures across all funds, which is especially useful if you manage investments across multiple accounts. By offering such detailed insights, the tool helps you make strategic adjustments to keep your portfolio diversified and aligned with your financial goals.
sbb-itb-e429e5c
Why Managing ETF Overlap Matters for U.S. Investors
This section delves into why keeping an eye on ETF overlap is a key strategy for U.S. investors aiming to build a balanced and efficient portfolio.
Improving Diversification and Reducing Risk
When ETFs have a high degree of overlap, it can erode diversification. Too much overlap leads to unintended concentration risk, leaving your portfolio more exposed if certain sectors or companies underperform. For instance, in December 2025, VV and SPY had a staggering 96% overlap, sharing 409 holdings. Essentially, investors holding both were doubling down on the same portfolio. This defeats the purpose of owning multiple ETFs.
Experts suggest that overlap above 70% signals excessive redundancy, which significantly weakens diversification. Overlap in the range of 40-70% is considered moderate and manageable, while anything below 40% indicates that your ETFs are complementing each other rather than duplicating.
Cost and Tax Efficiency
Owning overlapping ETFs means you're paying double the fees for the same exposure. While ETFs are known for their lower expense ratios compared to mutual funds, these costs can add up quickly when you're essentially duplicating holdings across multiple funds.
Tax planning also becomes more complicated with overlap. If you hold the same stocks in different ETFs and sell one at a loss, the presence of the same stock in another ETF could trigger a wash sale. This not only disallows the tax deduction but also increases your tax burden. By managing overlap, you can avoid these pitfalls, keeping your tax records clean and your portfolio more cost-efficient. These immediate savings in fees and taxes lay the groundwork for stronger wealth growth over time.
Long-Term Wealth Optimization
Reducing ETF overlap can have a meaningful impact on your portfolio's long-term performance. By cutting redundant positions, you free up capital to invest in genuinely diverse asset classes, such as bond ETFs or REITs, which can provide better diversification. This broader range of investments helps smooth out market volatility and supports steadier growth over the years.
Lower fees, better tax efficiency, and proper diversification all contribute to compounding returns over the long haul. Experts often recommend keeping overlap below 50%, with some suggesting even stricter limits of 10-20% or under 33%. Staying within these thresholds ensures that every ETF in your portfolio serves a unique purpose, helping you maximize growth potential while avoiding unnecessary redundancies.
Using Mezzi's ETF Overlap Analyzer

Mezzi makes it easier to analyze ETF overlaps by blending advanced AI-driven tools with a streamlined, all-in-one account view. This approach connects your various investments while providing deep insights into your portfolio.
Mezzi's Unified Account View
Tracking ETF overlaps can get tricky when your investments are spread across multiple accounts. Mezzi solves this by consolidating all your accounts - whether they're taxable brokerage accounts, 401(k)s, IRAs, or Roth IRAs - into a single, easy-to-read view. This allows you to identify overlaps across your entire portfolio. For example, you might unknowingly hold similar exposures by owning funds like VTI in one account and VOO in another.
AI-Powered X-Ray Analytics
Mezzi's X-Ray feature takes overlap analysis to the next level. Instead of just showing you which ETFs overlap, it digs deeper to uncover the individual stock exposures within those ETFs. This means you can identify unintended concentrations and ensure your portfolio remains well-diversified.
Combining Tax Optimization with Overlap Reduction
Mezzi goes a step further by integrating tax considerations into its overlap analysis. This feature helps you rebalance your portfolio in a tax-efficient way, avoiding pitfalls like wash sales, while also reducing overall costs. By aligning diversification improvements with tax strategies, Mezzi ensures your portfolio adjustments are both smart and cost-effective.
Conclusion
Safeguard your investments and boost your returns by addressing ETF overlap in your portfolio. Overlapping ETFs can quietly increase costs and heighten concentration risk, leaving you more vulnerable during market slumps. Even when you think your portfolio is diversified, it’s surprisingly easy to end up with top holdings that dominate your overall exposure. This risk becomes more pronounced when overlap exceeds expert-recommended thresholds.
Most professionals suggest keeping overlap below 50%, with some advocating for even stricter limits - between 10% and 20%. Staying within these ranges can help you maintain a healthier balance.
Mezzi offers a smart solution with its AI-powered analytics and tax-efficient optimization tools. Whether you’re managing a 401(k), IRA, or taxable brokerage account, Mezzi helps identify overlaps across all your holdings. Its X-Ray feature digs deeper than surface-level ETF comparisons, uncovering the individual stock exposures that might be causing unintended concentrations.
Using an ETF overlap analyzer can transform your approach to portfolio management. By regularly reviewing overlaps and making informed adjustments, you’re not just minimizing risk - you’re positioning your portfolio for long-term growth. The difference between a well-balanced portfolio and one weighed down by overlap can translate into thousands of dollars in saved fees and unrealized gains over time.
Understanding what you own is the first step toward smarter investing. An ETF overlap analyzer simplifies the complexity, giving you clear, actionable insights to build a more efficient and resilient portfolio.
FAQs
What is the ideal overlap threshold for achieving my investment goals?
When it comes to overlap thresholds, the right number really depends on your diversification goals and how much risk you're comfortable taking on. A good rule of thumb? Try to keep overlap under 50%. This can help you maintain a well-diversified portfolio and avoid taking on risks you don't need.
An ETF overlap analyzer can be a handy tool for spotting duplicate holdings in your portfolio. It simplifies the process of identifying redundancies and ensures your investments are working efficiently. By reviewing your overlap regularly, you can make adjustments as needed to stay aligned with your financial goals.
What happens if I don’t address ETF overlap in my portfolio?
Ignoring ETF overlap in your portfolio can leave you exposed to concentration risk - essentially putting too many eggs in the same basket. When too much of your money is tied up in the same assets, your portfolio becomes less diversified, leaving it more susceptible to market swings and increased volatility.
On top of that, overlapping ETFs can rack up avoidable costs, like duplicate management fees and possible tax inefficiencies. Taking the time to identify and minimize overlap can help you spread your investments more effectively, cut down on risks, and fine-tune your portfolio for stronger long-term results.
How does Mezzi's ETF Overlap Analyzer support tax-efficient investing?
Mezzi's ETF Overlap Analyzer is a smart tool for investors looking to fine-tune their portfolios with tax efficiency in mind. It works by pinpointing overlapping holdings across different ETFs, helping you avoid unnecessary taxable events and reduce capital gains distributions.
By identifying redundancies, this tool helps you streamline your portfolio, optimize asset allocation, and aim for better after-tax returns. The result? A more diversified and efficient investment approach designed to make your money work harder for you.
Related Blog Posts
Table of Contents
Book Free Consultation
Walk through Mezzi with our team, review your current situation, and ask any questions you may have.