
Choosing the best semiconductor ETF depends on your investment goals and risk tolerance. Here’s a quick breakdown of the three major options:
- SMH (VanEck Semiconductor ETF): Focuses on large-cap semiconductor leaders like NVIDIA and TSMC. Offers high growth potential but with significant concentration risk. Its top 10 holdings make up over 72% of the portfolio, with NVIDIA alone accounting for nearly 20%. Best for growth-oriented investors targeting industry giants.
- SOXX (iShares Semiconductor ETF): Tracks the NYSE Semiconductor Index with a modified market-cap weighting, capping individual holdings at 10%. Provides a balance between stability and diversification, with exposure to large-cap U.S.-listed semiconductor companies. Ideal for investors seeking a middle ground between growth and reduced risk.
- XSD (SPDR S&P Semiconductor ETF): Uses an equal-weighted strategy, spreading investments evenly across 40 stocks. Gives smaller and mid-cap companies a meaningful role, reducing reliance on dominant players. Suitable for those looking for broad exposure and diversification across the semiconductor ecosystem.
Quick Comparison
| Feature | SMH | SOXX | XSD |
|---|---|---|---|
| Expense Ratio | 0.35% | 0.34% | 0.35% |
| Assets Under Management | $19.18 billion | $15.5 billion | $1.49 billion |
| Number of Holdings | 25 | 32 | 40 |
| Weighting Method | Market-cap weighted | Modified market-cap | Equal-weighted |
| Top 10 Holdings | 72.76% | 57.5% | 34% |
| Largest Holding | NVIDIA (~20%) | Broadcom (9.49%) | Universal Display (3.62%) |
| 10-Year Annualized Return | 31.1% | 27.2% | N/A |
Key Takeaway
- For growth: SMH is best for those who want exposure to top semiconductor leaders.
- For balance: SOXX offers a mix of stability and diversification.
- For diversification: XSD spreads risk across small, mid, and large-cap companies.
Your choice depends on whether you prioritize growth, stability, or broad exposure.
VanEck Semiconductor ETF (SMH) Overview
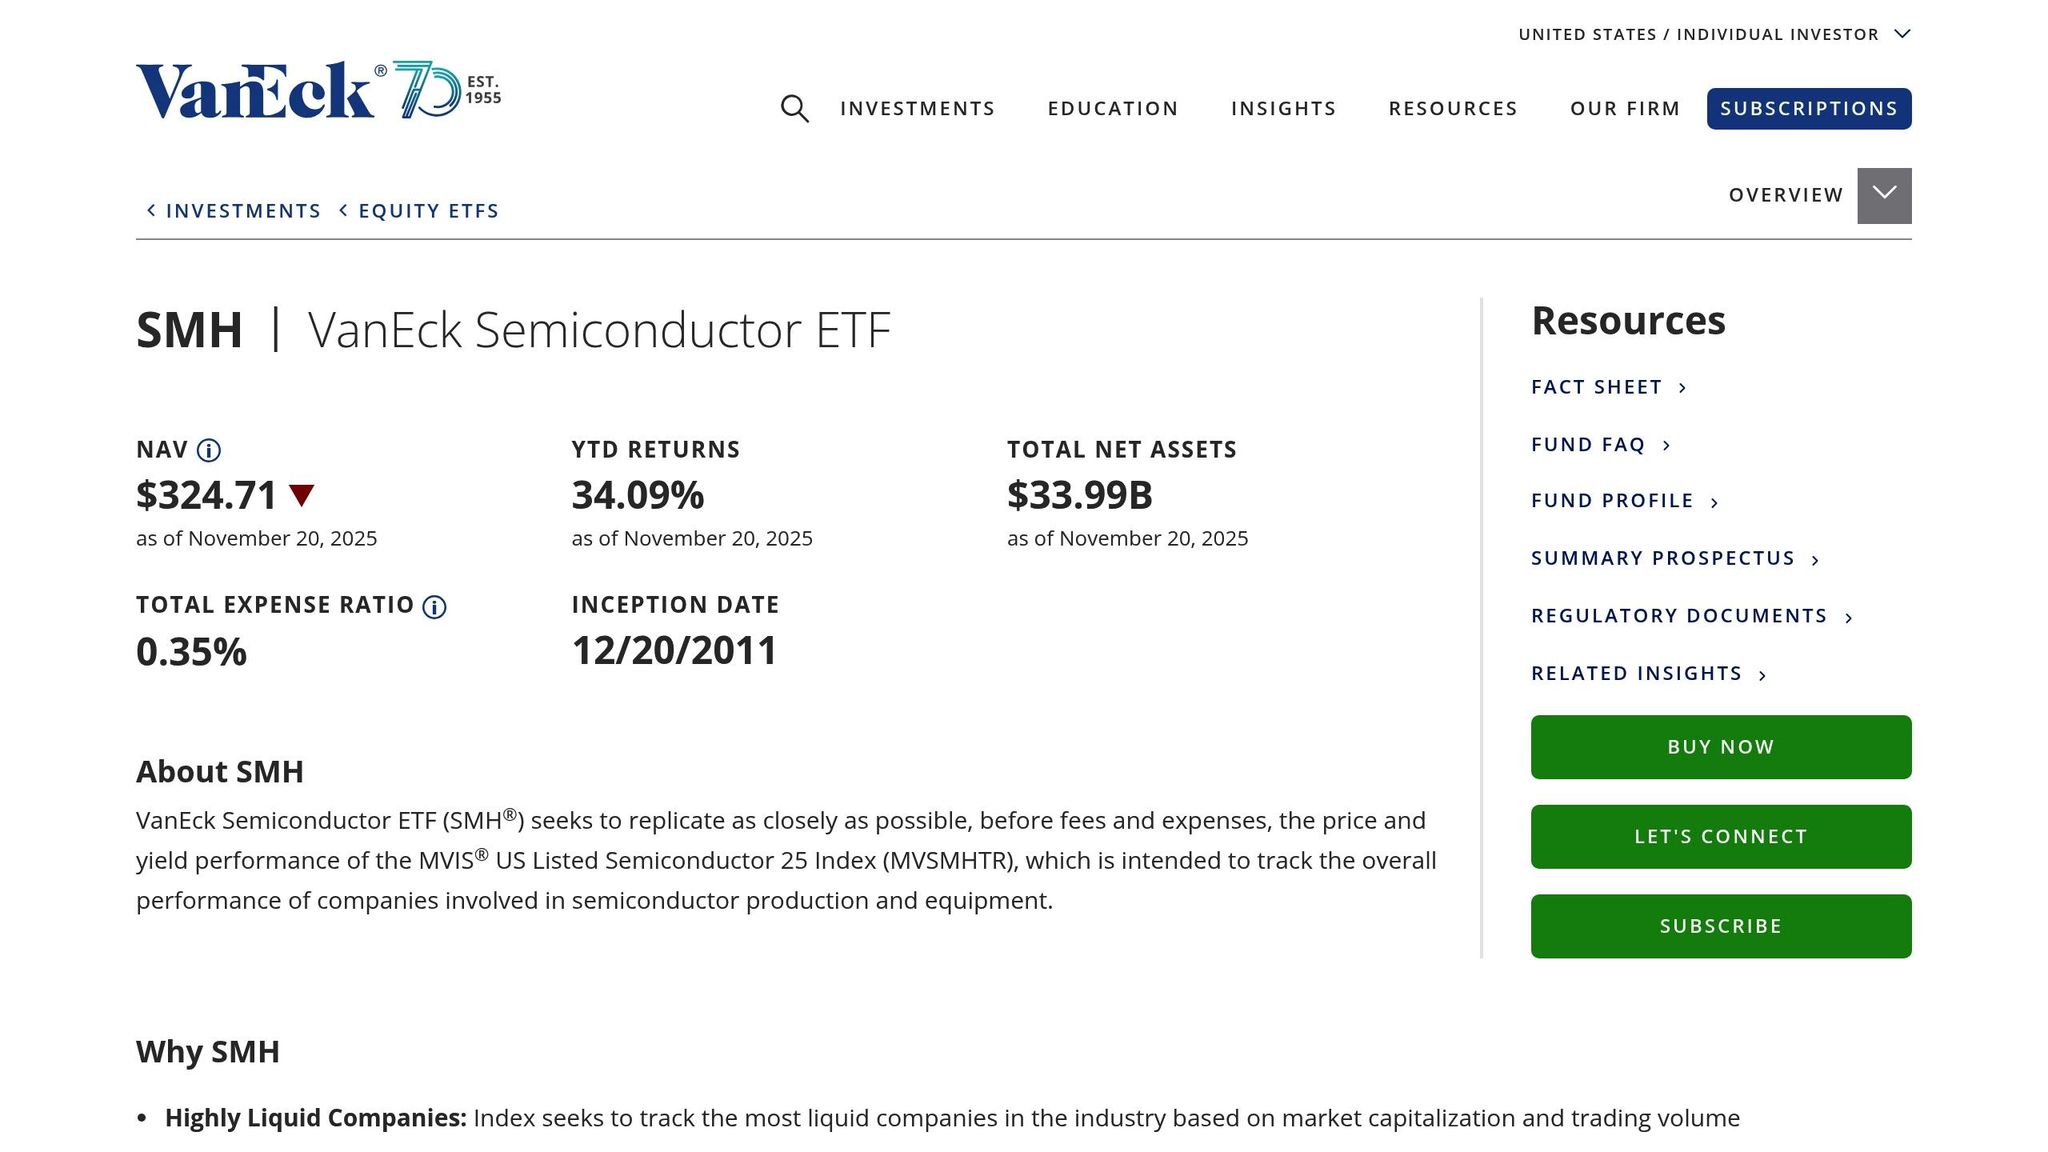
Investment Strategy and Focus
The VanEck Semiconductor ETF (SMH) is designed to follow the MVIS US Listed Semiconductor 25 Index, which emphasizes the largest and most actively traded companies in the semiconductor sector. Its focus is on large-cap semiconductor leaders, employing a market-cap-weighted approach. This method allocates more weight to companies with higher market values, resulting in a portfolio that leans heavily toward the industry’s dominant players.
Key Metrics and Performance
SMH’s portfolio consists of 26 stocks, with 76.08% of its assets concentrated in its top 10 holdings. NVIDIA alone accounts for a significant 18.7% of the fund. Other major holdings typically include Taiwan Semiconductor Manufacturing, ASML Holding, Broadcom, and Qualcomm. The fund exhibits a beta of 1.52, highlighting its sensitivity to market cycles.
From an environmental, social, and governance (ESG) standpoint, SMH has a score of 7.99, placing it in the 98.21% peer percentile and the 96.40% global percentile. Its carbon intensity stands at 47.1 tons of CO₂e per $1 million in sales, reflecting its environmental impact.
Diversification and Investor Fit
SMH provides targeted exposure across various segments of the semiconductor industry. However, its market-cap weighting means performance is heavily influenced by its largest holdings, making it an appealing choice for investors seeking exposure to industry leaders. That said, this concentration also introduces higher volatility.
For long-term investors interested in the semiconductor sector specifically, SMH offers a thematic investment option. It’s categorized as a Technology Equities ETF, making it more focused on semiconductors rather than the broader tech market. However, investors should be mindful of the risks tied to the cyclical nature of the semiconductor industry and the potential for concentration risk.
In the next section, we’ll take a closer look at SOXX to compare its strategy and risk profile with SMH.
iShares Semiconductor ETF (SOXX) Overview
Investment Approach and Holdings
The iShares Semiconductor ETF (SOXX) is designed to track the NYSE Semiconductor Index, giving greater emphasis to larger companies while maintaining broad exposure to the semiconductor industry. Its portfolio includes a diverse range of companies spanning chip manufacturing, equipment production, and design services. Notable names like Taiwan Semiconductor Manufacturing Company (TSMC) and NVIDIA feature prominently, alongside specialized firms focusing on areas such as memory and analog chips. This strategy ensures investors gain access to the broader semiconductor ecosystem while prioritizing industry leaders.
Key Metrics and Historical Returns
SOXX stands out in the semiconductor ETF market, with an expense ratio that aligns with its specialized focus. Its major holdings include NVIDIA, TSMC, Broadcom, Advanced Micro Devices, and Qualcomm, with a significant portion of the fund's portfolio concentrated in these top positions. This structure strikes a balance between diversification and focus, helping to mitigate risks in this often-volatile sector.
Historically, SOXX has performed well during industry upcycles, benefiting from growth periods driven by technological advancements. However, like the semiconductor sector itself, the fund has experienced volatility during downturns. Its performance has been shaped by trends such as artificial intelligence development, the rollout of 5G technology, and the growing demand for data center infrastructure.
Sector Diversification and Risk Profile
SOXX offers exposure across a variety of semiconductor sub-sectors, including memory manufacturing, analog chip production, equipment, and fabless design. This diversification reduces the risk of overdependence on any single segment while maintaining a targeted focus on the semiconductor industry. Unlike broader technology ETFs that may include software or other tech-related areas, SOXX stays exclusively within the semiconductor space. Its portfolio reflects the global nature of the industry, featuring both U.S.-based firms and international leaders.
For investors with confidence in the long-term growth of semiconductors, SOXX provides an appealing option for focused exposure to this sector. However, its market-cap weighting means that the performance of a few large companies can heavily influence the fund’s overall returns. Up next, we’ll explore XSD and its equal-weighted strategy.
SPDR S&P Semiconductor ETF (XSD) Overview
Equal-Weighted Strategy Explained
The SPDR S&P Semiconductor ETF (XSD) takes a unique approach with its equal-weighted strategy, offering a balanced way to invest in the semiconductor sector. Tracking the S&P Semiconductor Select Industry Index, XSD includes 40 equally weighted stocks. This strategy involves regular rebalancing, where positions are adjusted by trimming stocks that outperform and increasing exposure to those that underperform. By doing so, XSD limits its reliance on the largest chipmakers, giving smaller and mid-sized companies a more significant role in the portfolio. This reduces the concentration risks often associated with market-cap-weighted ETFs.
Key Metrics and Performance Data
XSD comes with a 0.35% expense ratio and manages $1.49 billion in assets. Recent performance figures underline its attractiveness: a 1-year return of 41.60% and a 3-month total return of 8.7%. By focusing on mid- and small-cap semiconductor companies, it allows emerging players in the industry to have a meaningful impact on the fund's overall performance.
Diversification and Investor Fit
XSD’s 40-stock portfolio spans the entire semiconductor ecosystem, covering areas like chip manufacturing, design, equipment production, and specialized semiconductor services. This broad exposure ensures investors gain access to the full spectrum of the industry while minimizing risks tied to over-concentration in a few dominant companies.
For investors seeking a balanced risk-and-reward profile, XSD stands out as a strong option. U.S. News has noted:
At this stage in the semiconductor supercycle, an equal-weighted ETF like XSD may offer a better balance of risk and return.
Additionally, its classification as a thematic ETF makes it a suitable choice for long-term investors who aim to reduce volatility compared to single-stock or leveraged alternatives.
Unlike market-cap-weighted funds, XSD’s equal-weighted methodology ensures a fair representation across companies of all sizes. This approach provides balanced exposure to the semiconductor industry without leaning too heavily on the sector’s dominant players, setting it apart for investors looking for diversified opportunities.
SMH vs SOXX vs XSD: Side-by-Side Comparison
Key Metrics Comparison Table
To understand the differences among these three semiconductor ETFs, let’s break down their core metrics. Each fund has a unique strategy, influencing its concentration, risk, and potential returns.
| Feature | SMH | SOXX | XSD |
|---|---|---|---|
| Expense Ratio | 0.35% | 0.34% | 0.35% |
| Assets Under Management | $19.18 billion | $15.5 billion | $1.49 billion |
| Number of Holdings | 25 | 32 | 40 |
| Weighting Method | Market-cap weighted | Modified market-cap weighted | Equal-weighted |
| Top 10 Holdings Concentration | 72.76% | 57.5% | 34% |
| Largest Single Holding | Nvidia (~20%) | Broadcom (9.49%) | Universal Display (3.62%) |
| 10-Year Annualized Return | 31.1% | 27.2% | N/A |
| Focus | Largest, most liquid companies | U.S.-listed large-cap focus | Balanced across all market caps |
The data reveals a clear distinction in how these ETFs allocate their assets. For instance, SMH heavily leans on its top 10 holdings, which make up almost 73% of its portfolio, while XSD spreads its exposure more evenly across 40 holdings. These differences set the foundation for evaluating the strengths and trade-offs of each option.
Pros and Cons of Each ETF
SMH is ideal for investors who want exposure to industry leaders. With a stellar 10-year annualized return of 31.1%, it has delivered strong performance. However, its heavy reliance on Nvidia (nearly 20% of the portfolio) introduces significant concentration risk. If a key holding underperforms, the entire fund could feel the impact.
SOXX takes a more balanced approach with its modified market-cap weighting. By capping individual holdings at 10%, it reduces single-stock risk while still focusing on large-cap U.S. companies. Its slightly lower expense ratio of 0.34% adds to its appeal. Though its 10-year annualized return of 27.2% is solid, it lags behind SMH's performance.
XSD, with its equal-weighting strategy, provides the most diversified exposure. By giving smaller and mid-cap semiconductor companies meaningful representation, it reduces reliance on major players. This approach can capture growth from emerging companies but may miss out on the outsized gains of giants like Nvidia. As of August 2024, XSD was down over 6% year-to-date, reflecting its broader exposure and sensitivity to market fluctuations.
Weighting Methods and Risk Impact
The primary distinction between these ETFs lies in their weighting methods, which directly influence their risk profiles. SMH and SOXX use market-cap-based strategies, favoring well-established, larger companies. This approach tends to reduce volatility but can lead to concentration risk, especially in funds like SMH, where a few holdings dominate the portfolio.
On the other hand, XSD’s equal-weighting strategy ensures a more balanced allocation. By regularly rebalancing, it trims gains from outperformers and reallocates to underperformers, creating a diversified portfolio. While this can result in higher short-term volatility, it appeals to investors looking for a broader, more evenly distributed risk exposure.
Semiconductor ETF Comparison | $SMH $SOXX $XSD
Best Semiconductor ETF for Balanced Exposure
Let’s break down the main points and investment strategies for each semiconductor ETF to help you make an informed decision.
Key Takeaways Summary
Each ETF offers a unique approach to semiconductor investing:
- XSD: Focuses on balanced exposure with equal-weighting across 40 holdings. This structure minimizes reliance on any single stock.
- SMH: Concentrates on industry leaders, like Nvidia, offering higher growth potential but with increased concentration risk.
- SOXX: Strikes a middle ground using modified market-cap weighting, capping individual holdings at 10% to balance stability and diversification.
While XSD’s rebalancing ensures no single stock dominates the portfolio, SMH’s focus on established semiconductor giants appeals to those seeking aggressive growth. SOXX, on the other hand, provides a mix of large-cap stability and diversification by limiting overconcentration.
Matching ETFs to Your Investment Goals
Your investment goals and risk tolerance will guide which ETF aligns best with your strategy:
- For growth-oriented investors: SMH is ideal for those comfortable with higher risk, as it targets semiconductor leaders with strong market positions.
- For conservative investors: XSD’s equal-weighting approach offers broad diversification across stocks and bonds, making it a steady choice for long-term exposure.
- For balanced growth and stability: SOXX provides a middle path, offering large-cap exposure while avoiding the risks of overconcentration.
If your portfolio already includes major semiconductor stocks, XSD’s broader exposure can help diversify your allocation. These insights can help refine your ETF selection process.
How Mezzi Can Help Optimize ETF Selection

Mezzi’s suite of tools takes the guesswork out of ETF selection:
- X-Ray Tool: Identifies hidden exposures in your portfolio, helping you avoid overconcentration in the semiconductor sector.
- Tax Optimization: Prevents wash sale rule violations across multiple accounts when switching ETFs or rebalancing your tech investments.
- AI-Driven Insights: Recommends the most suitable semiconductor ETF based on your financial profile, risk tolerance, and current holdings.
- Financial Calculator: Projects the long-term impact of different ETF choices by factoring in the impact of fees, expected returns, and contribution schedules. This ensures your ETF aligns with your wealth-building goals rather than short-term market fluctuations.
FAQs
How do the expense ratios of SMH, SOXX, and XSD affect their long-term growth potential?
Expense ratios are a critical factor in assessing the long-term growth of an ETF because they directly cut into your overall returns. For example, if you invest $10,000, the annual fee for SOXX’s lower expense ratio would be $19. In comparison, SMH would cost $35 annually, and XSD would charge $34. While these amounts might seem small, over time - especially with larger investments or longer holding periods - these differences can significantly impact your returns.
When evaluating ETFs, it’s important to consider expense ratios alongside other key elements like performance, holdings, and diversification. Balancing these factors ensures your investment aligns with your financial goals and strategy.
What are the risks of SMH's concentrated holdings compared to XSD's diversified approach?
XSD takes an equal-weighted approach, distributing investments more evenly across all its holdings. This strategy helps minimize the influence of any single stock on the fund's overall performance. On the other hand, SMH leans heavily on a few major semiconductor companies, which can increase risk if those specific stocks falter.
When deciding between SMH and XSD, it comes down to your risk tolerance and investment objectives. If you're comfortable with a concentrated portfolio that emphasizes leading industry players, SMH might align with your goals. But if you're looking for a more diversified exposure to the semiconductor sector, XSD provides a broader and more balanced option.
What are the benefits of XSD's equal-weighted strategy compared to the market-cap-weighted approaches of SMH and SOXX?
XSD takes an equal-weighted approach, distributing investments evenly across both large and small semiconductor companies. This method helps mitigate the risk of over-reliance on larger firms while allowing investors to tap into the growth opportunities offered by smaller players in the industry.
On the other hand, SMH and SOXX follow market-cap-weighted strategies, which lean heavily toward larger companies. While this can be advantageous for stability, it may come at the expense of diversification. For those looking for a broader and more balanced exposure to the semiconductor sector, XSD's strategy stands out as a compelling choice.
Related Blog Posts
Table of Contents
Book Free Consultation
Walk through Mezzi with our team, review your current situation, and ask any questions you may have.