Looking for steady monthly income from covered call ETFs? Here's a quick guide to SPYI, JEPI, and XYLD - three popular choices for income-focused investors. Each ETF offers unique strategies, tax implications, and risk profiles: They also react differently to covered-call ETFs during rate cuts, affecting their yield and upside capture.
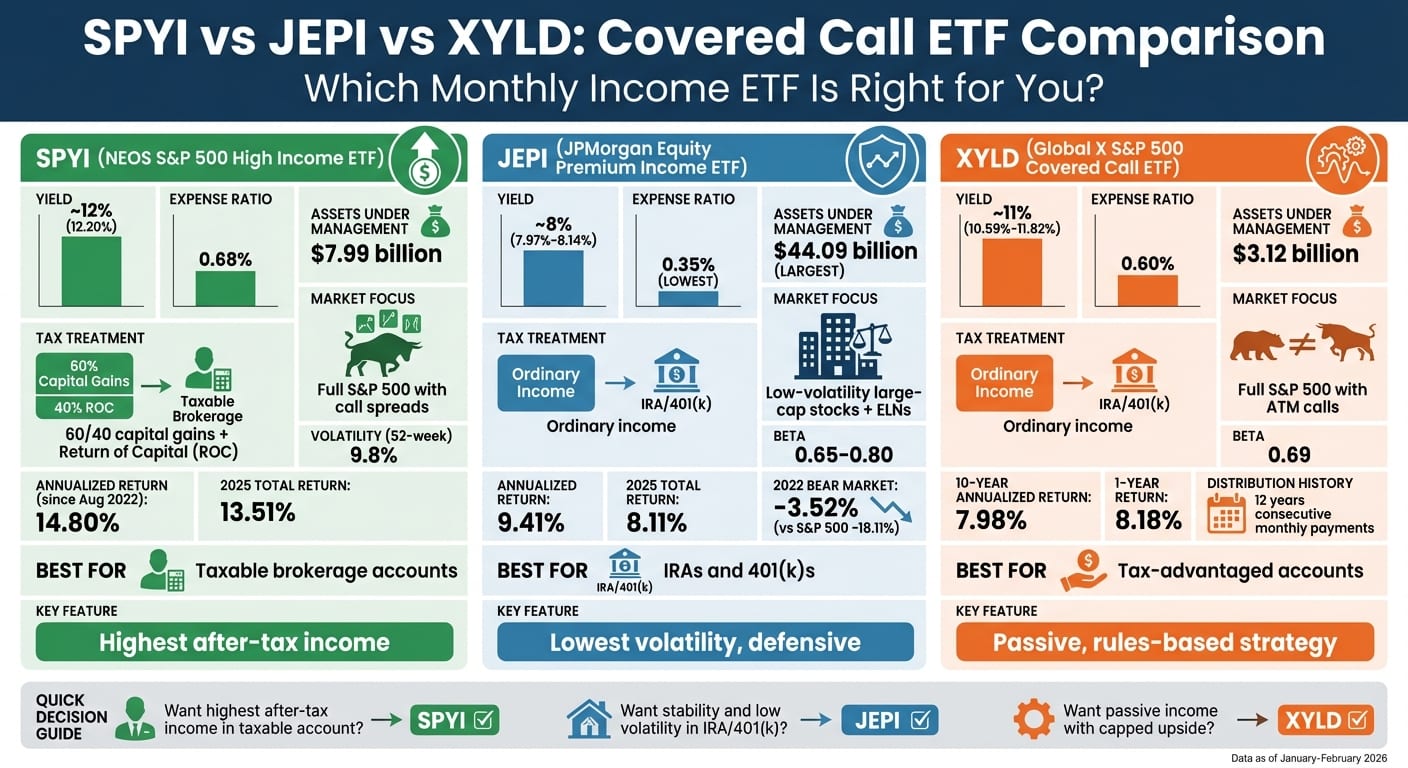
- SPYI: High yield (~12%) with tax efficiency (60/40 capital gains treatment and return of capital). Suited for taxable accounts.
- JEPI: Lower yield (~8%) but reduced volatility. IdealDesigned for IRAs or 401(k)s due to ordinary income tax treatment.
- XYLD: Passive strategy with ~11% yield, but capped upside in bull markets. Designed for tax-advantaged accounts.
Quick Comparison
SPYI offers potential for high after-tax income, JEPI provides stability for retirement accounts, and XYLD offers a passive income approach. Keep reading for a deeper look at how each ETF works, their performance, and tax implications.
The Best S&P 500 ETF for Wealth (2025)
SPYI: How It Works and What It Delivers
The NEOS S&P 500 High Income ETF (SPYI) uses a sophisticated covered call strategy to generate returns. Here's how it works: the fund holds the entire S&P 500 Index and writes call options on the index itself. A portion of the premiums earned from these options is then used to purchase out-of-the-money (OTM) call options. This "call spread" approach enables SPYI to benefit from market rallies more effectively than static strategies. NEOS actively manages these options to either lock in gains or limit losses, especially during periods of heightened volatility.
As of January 31, 2026, SPYI achieved a 12.20% distribution rate and managed $7.99 billion in assets. Since its launch in August 2022 through January 2026, the fund delivered a 14.80% annualized NAV performance, compared with the Cboe S&P 500 BuyWrite Monthly Index's 11.49% return for the same period. Over the 12 months ending January 31, 2026, SPYI returned 16.75%, though it lagged behind the S&P 500's 21.11% during that time. This highlights the trade-off: investors may forgo some upside potential in exchange for monthly income.
SPYI is structured to provide tax efficiency. The fund utilizes Section 1256 contracts, which are taxed at a blended rate of 60% long-term and 40% short-term capital gains, no matter how long they are held. Thanks to its tax-loss strategies, over 98% of distributions are classified as Return of Capital (ROC), deferring taxes by reducing the investor's cost basis instead of triggering immediate tax on ordinary income. While its expense ratio of 0.68% is higher than some competitors, the active management is reflected in the fund's expense ratio.
SPYI's performance depends on market conditions. In rising markets, the OTM calls it purchases allow for some upside participation. In flat or sideways markets, the fund thrives by collecting consistent option premiums. During market downturns, those premiums provide a cushion against volatility, though they cannot fully protect against large losses. The fund's 52-week implied volatility was 9.8%, much lower than the S&P 500's (SPY) 15.2%, indicating lower volatility in returns over the measured period. As of February 24, 2026, SPYI's top holdings included Nvidia (7.88%), Apple (6.67%), and Microsoft (4.84%), giving it substantial exposure to mega-cap tech.
Up next, we'll explore how JEPI approaches its own covered call strategy.
JEPI: How It Works and What It Delivers
JEPI takes a unique approach compared to SPYI by focusing on a portfolio of low-volatility, large-cap stocks that are selected for their relative value and stability. These stocks are combined with Equity Linked Notes (ELNs) - structured debt instruments issued by major banks that mimic the returns of writing S&P 500 covered calls. ELNs generally make up 15–20% of JEPI's portfolio, while the remainder is invested in companies like Progressive Corp, Trane Technologies, Bristol-Myers Squibb, and AbbVie.
"JEPI has become the 'bond proxy' for equity investors - a low‑volatility anchor." – Dividend Growth Lab Research Team
JEPI's strategy focuses on defensive characteristics. As of February 24, 2026, the fund achieved a 3.95% year-to-date return and managed $44.09 billion in assets. Its 12-month rolling yield ranged between 7.36% and 8.13%. Over the last few years, JEPI delivered returns of 8.11% in 2025, 12.58% in 2024, and 9.81% in 2023. Even during the 2022 bear market, JEPI demonstrated resilience, falling only 3.52%, compared to the S&P 500's 18.11% drop. The fund's beta, which measures its volatility relative to the S&P 500, typically ranges between 0.65 and 0.80, resulting in lower volatility compared to the broader market over the referenced period. Additionally, JEPI boasts an expense ratio of 0.35%, the lowest among the ETFs discussed here.
However, JEPI's income generation comes with a tax consideration. Since ELNs are classified as debt instruments, the fund's distributions are treated as ordinary income rather than qualified dividends. This means they are taxed at ordinary income rates, which can go as high as 37%. As a result, JEPI may be more appropriate for tax-deferred accounts like IRAs or 401(k)s due to its tax treatment.
JEPI's approach may be effective in sideways or volatile markets, where it collects premiums while maintaining most of the upside. However, its defensive nature means it tends to underperform in bull markets. ETF analyst Tony Dong explains:
"JEPI is particularly well suited for choppy, high-volatility markets... It collects outsized premiums from options without giving up too much upside when stocks move sideways".
Next, we’ll explore how XYLD's strategy sets it apart from both SPYI and JEPI.
XYLD: How It Works and What It Delivers
XYLD follows a passive, rules-based buy-write strategy. It holds all 505 stocks in the S&P 500 and writes at-the-money (ATM) call options on its entire portfolio every month. This approach is designed to align with the Cboe S&P 500 BuyWrite Index.
By writing ATM calls on its holdings, the fund limits its potential for capital gains, opting instead to generate immediate income. To provide monthly income, XYLD distributes either half the premium it collects or 1% of its net asset value (NAV), whichever is lower. As of February 23, 2026, the fund reported a trailing 12-month distribution yield of 11.82%, managed $3.12 billion in assets, and maintained an impressive track record of monthly distributions for 12 years straight.
With its focus on income, XYLD achieved an 8.18% one-year total return and a 7.98% annualized return over 10 years as of February 2026. Its beta of 0.69 compared to the S&P 500 highlights its lower volatility, though it sacrifices upside potential beyond the strike price during strong market rallies.
"By monetizing this volatility using covered call premiums, the fund has the potential to outperform the underlying S&P 500 Index during periods when it trades in a flat or choppy manner." – Robert J. Scrudato, Global X
XYLD thrives in sideways or range-bound markets, where the S&P 500 remains relatively stable. This environment allows the fund to collect option premiums without its stocks being called away during market rallies. The fund's expense ratio of 0.60% reflects its systematic, index-tracking methodology. However, since its distributions are typically taxed as ordinary income, XYLD is generally better suited for tax-advantaged accounts like IRAs. Up next, we’ll dive into risk and tax considerations.
Side-by-Side Comparison: Key Metrics
When evaluating these three covered call ETFs, the metrics below highlight their distinct characteristics. JEPI stands out with over $42 billion in assets under management, making it the largest covered call ETF available.
Yield is a key differentiator here. SPYI boasts the highest distribution yield at approximately 12%, followed by XYLD at 10.59%, and JEPI at 7.97%. However, higher yields often come with trade-offs. JEPI’s expense ratio is just 0.35%, significantly lower than XYLD's 0.60% and SPYI's 0.68%. To make it easier to compare, the table below summarizes these key metrics.
Performance varies depending on market conditions. As of February 24, 2026, JEPI delivered a year-to-date return of 4.48%, outperforming XYLD's 1.88%. Over a longer period, JEPI achieved an annualized return of 9.41%, while SPYI, since its inception in August 2022, posted an impressive 14.72% annualized return. JEPI’s defensive strategy is evident in its lower volatility and smaller maximum drawdown. For instance, its one-month rolling volatility stands at 2.15%, compared to XYLD’s 2.49%. Additionally, JEPI's maximum drawdown of -13.71% is far less severe than XYLD’s -33.46%.
Comparison Table
These metrics highlight the balance between yield, cost, and risk, helping investors tailor their ETF selections to match their income goals. For example, JEPI's Sharpe Ratio of 0.70 surpasses XYLD's 0.57, indicating better risk-adjusted returns. Additionally, SPYI offers a potential tax edge with its Section 1256 tax treatment, which allows 60% of gains to qualify as long-term capital gains - a contrast to the ordinary income classification for JEPI and XYLD.
Risk Levels and Tax Considerations
JEPI is designed with a lower-risk profile, focusing on low-volatility S&P 500 stocks. Its beta ranges from 0.65 to 0.80, meaning it tends to experience smaller swings compared to the broader market. On the other hand, SPYI tracks the entire S&P 500 with a beta closer to 0.95, aligning more closely with overall market movements. XYLD also mirrors the full index but uses at-the-money call options, which limit its upside potential. These differences in risk set the stage for how taxes impact each fund.
Tax treatment is a key area where these ETFs differ. JEPI’s use of ELNs (Equity-Linked Notes) generates distributions taxed as ordinary income, with rates reaching as high as 37%. Similarly, XYLD’s option premiums are also taxed as ordinary income. SPYI, however, stands out by employing Section 1256 contracts, which offer a tax advantage: 60% of gains are treated as long-term capital gains, and 40% as short-term. Additionally, SPYI often classifies over 90% of its distributions as Return of Capital (ROC), deferring taxes until you sell.
"A dollar of income from SPYI is inherently worth more than a dollar of income from JEPI for a taxable investor due to this preferential [Section 1256] treatment."
– Dividend Growth Lab Research Team
A tax analysis conducted by Dividendology in December 2025 compared a hypothetical $50,000 annual income stream from JEPI and SPYI for a taxpayer in the 25% bracket. The study found that a JEPI investor owed approximately $8,500 in taxes, while the SPYI investor owed just $790 (assuming 10% of income was taxed under Section 1256 and the rest as ROC). This resulted in a staggering $7,710 in annual tax savings for SPYI investors.
Given these contrasts in risk and tax profiles, asset location may be an important consideration. JEPI’s ordinary income tax treatment makes it ideal for tax-deferred accounts like IRAs or 401(k)s. In contrast, SPYI’s tax-efficient structure is better suited for taxable brokerage accounts. Platforms like Mezzi can enhance this strategy by offering a unified view of your accounts and AI-driven tools to track cost basis adjustments from ROC distributions and flag potential wash sales with AI insights. For those managing multiple accounts, this type of optimization may help reduce taxes for some investors.
Which ETF Fits Your Investment Goals
When deciding on an ETF, it’s all about matching the fund’s features to your specific income and tax goals. Let’s break down how SPYI, JEPI, and XYLD cater to different investment strategies.
SPYI may be considered by those seeking high monthly income and tax efficiency. It boasts a trailing 12-month yield of 11.89% and benefits from Section 1256 tax treatment, which provides a favorable 60/40 split between long-term and short-term capital gains. This makes it particularly appealing for taxable brokerage accounts. Additionally, SPYI’s bullish call spread strategy may allow for additional gains during S&P 500 rallies. In 2025, SPYI delivered a total return of 13.51%, far outpacing JEPI’s 3.96%.
JEPI, on the other hand, may appeal to investors seeking stability and reduced volatility. With a yield of 8.14%, it focuses on defensive, low-volatility stocks, making it less prone to large market fluctuations. JEPI’s ordinary income distributions work best in tax-advantaged accounts like IRAs or 401(k)s. For those nearing retirement or looking for a steady core holding, JEPI’s active management and conservative approach provide an option with a history of lower volatility.
XYLD may appeal to those who prefer a passive, rules-based income strategy. By writing at-the-money calls on 100% of its S&P 500 holdings, XYLD prioritizes immediate premium income. However, this strategy limits upside potential during strong bull markets. For example, in the year ending March 18, 2024, XYLD returned 12%, while the S&P 500 surged by 33%. This ETF is best suited for investors who value consistent income over significant market gains.
Each of these ETFs strikes a different balance between yield, risk, and tax considerations, helping you align your choice with your financial goals.
To further refine your strategy, tools like Mezzi can add value regardless of the ETF you select. For SPYI, Mezzi tracks Return of Capital distributions and adjusts your cost basis to help you avoid tax complications. JEPI investors can use Mezzi's unified account view to monitor distribution stability - especially important given JEPI’s history of payout declines exceeding 20%. Mezzi also offers AI-driven insights to flag wash sale risks, a critical feature when rebalancing among income-focused ETFs.
Ultimately, the best ETF depends on your priorities and where you hold it. Use SPYI in taxable accounts for maximum after-tax income, JEPI in retirement accounts for its defensive nature, and XYLD if you want a straightforward passive income strategy. Combine these with Mezzi’s tax optimization and monitoring tools to get the most out of your investments.
Conclusion
When deciding between SPYI, JEPI, or XYLD, consider your income needs, tax situation, and market tolerance. SPYI is a standout choice for taxable brokerage accounts, offering a high yield of 11.85%–12.15% while maintaining tax efficiency through its use of Section 1256 contracts. Despite its higher expense ratio, SPYI delivered strong total returns in 2025, outperforming JEPI and making it a potential option for taxable portfolios.
JEPI is well-suited for risk-averse investors and those using tax-deferred accounts. With a defensive beta of 0.65–0.80, it provides a smoother experience during market volatility. Its impressive liquidity, backed by approximately $42.7 billion in assets under management as of early 2026, adds to its appeal, even as its yield has compressed to 7.36%–8.13%.
XYLD uses a passive income approach but has limitations. Its at-the-money call-writing strategy caps potential gains in strong bull markets. For example, in the year ending March 18, 2024, XYLD returned around 12%, while the S&P 500 surged by about 33%. As ProShares' Simeon Hyman explains:
If you sell a call, you are getting income… but you are giving up the upside in the market.
This makes XYLD more suitable for flat or sideways markets compared to periods of significant market growth.
Your choice of ETF should align with your account type and financial goals. Tools like Mezzi can further refine your strategy by helping you track SPYI’s return of capital distributions for cost basis adjustments, monitor JEPI’s performance through unified views, and use AI-driven insights to avoid wash sale risks during ETF tax-loss harvesting and rebalancing. Mezzi’s tax optimization features are designed to help investors track taxes and manage investments more efficiently, whether you’re maximizing after-tax income with SPYI or managing risk with JEPI.
Each ETF has distinct features: SPYI is structured for tax-efficient income, JEPI is designed for defensive stability with lower volatility, and XYLD provides a passive income approach. Investors may consider SPYI for tax efficiency in taxable accounts, JEPI for income in retirement accounts, and should be aware of XYLD's limitations during bull markets. No matter your choice, Mezzi’s advanced tools may help investors optimize their investment strategy.
FAQs
How stable are these monthly payouts over time?
The reliability of monthly payouts for SPYI, JEPI, and XYLD varies based on their strategies and how the market performs. XYLD tends to deliver steady income but might experience smaller payouts during market downturns. JEPI, on the other hand, often sees more noticeable fluctuations in payouts due to its active management approach and sensitivity to market volatility. SPYI focuses on offering more predictable payouts, especially in stable or bullish markets, though all three can face changes during turbulent periods.
What happens to my taxes when SPYI pays return of capital?
When SPYI issues a return of capital, it isn’t treated as taxable income at the time you receive it. Instead, it lowers the cost basis of your investment. While this may seem like a benefit initially, it can lead to higher capital gains taxes when you eventually sell the investment. This adjustment can influence your overall tax situation, making it an important factor to weigh when crafting your investment strategy.
Which one fits best for a bull market vs a flat market?
In a bull market, SPYI tends to shine because it can capitalize on rising stock prices and deliver higher total returns through strategies like writing out-of-the-money calls. On the other hand, JEPI may excel in flat or declining markets by prioritizing lower volatility and protecting principal. This approach provides more stability and a defensive edge when market conditions are less favorable.
Disclosures:
- This content is for informational purposes only and does not constitute investment advice or a recommendation to buy or sell any security.
- P ast performance is not indicative of future results. No guarantee of future performance or outcomes is implied.
- Savings and performance examples are hypothetical and for illustrative purposes only. Actual results will vary based on individual circumstances, portfolio composition, market conditions, and fees.
- Registration does not imply a certain level of skill or that the SEC has approved the company or its services.
Related Blog Posts
- How does JEPI’s yield and risk profile compare to SCHD and DIVO for an income portfolio?
- SPYI vs QYLD vs XYLD: covered-call income tradeoffs for a taxable account.
- Covered-call ETFs during rate cuts: what happens to yield and upside capture?
- JEPI vs JEPQ vs QYLD vs SPYI - Best covered-call ETF for equity income
The reliability of monthly payouts for SPYI, JEPI, and XYLD varies based on their strategies and how the market performs. XYLD tends to deliver steady income but might experience smaller payouts during market downturns. JEPI, on the other hand, often sees more noticeable fluctuations in payouts due to its active management approach and sensitivity to market volatility. SPYI focuses on offering more predictable payouts, especially in stable or bullish markets, though all three can face changes during turbulent periods.
When SPYI issues a return of capital, it isn’t treated as taxable income at the time you receive it. Instead, it lowers the cost basis of your investment. While this may seem like a benefit initially, it can lead to higher capital gains taxes when you eventually sell the investment. This adjustment can influence your overall tax situation, making it an important factor to weigh when crafting your investment strategy.
In a bull market, SPYI tends to shine because it can capitalize on rising stock prices and deliver higher total returns through strategies like writing out-of-the-money calls. On the other hand, JEPI may excel in flat or declining markets by prioritizing lower volatility and protecting principal. This approach provides more stability and a defensive edge when market conditions are less favorable.