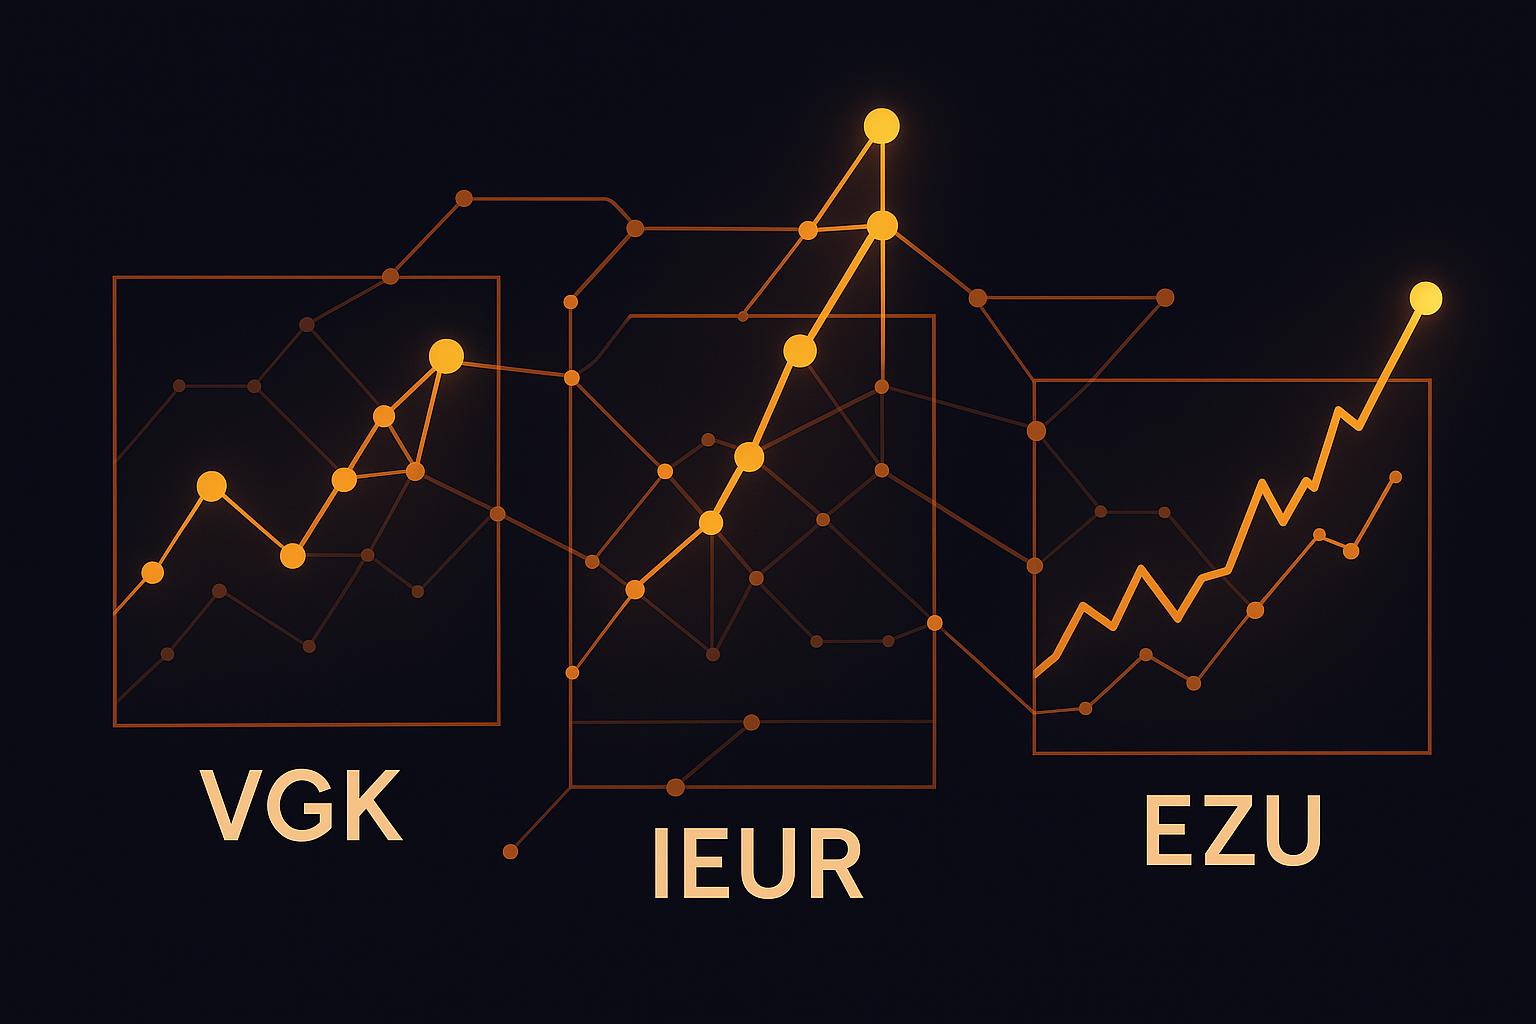
When investing in European ETFs, three major options stand out: VGK, IEUR, and EZU. Each offers access to European markets but differs in cost, geographic focus, and diversification. Here's the quick breakdown:
- VGK: Broad European exposure, including the UK and Switzerland. Offers the most diversification with 1,229 holdings and the lowest expense ratio at 0.08%.
- IEUR: Similar broad coverage of Europe with 1,007 holdings. Slightly higher expense ratio at 0.09% but a good choice for core European market exposure.
- EZU: Focuses exclusively on eurozone countries. Higher concentration risk with only 224 holdings and an expense ratio of 0.51%. Best for targeting eurozone economies.
Quick Comparison
| Feature | VGK | IEUR | EZU |
|---|---|---|---|
| Holdings | 1,229 | 1,007 | 224 |
| Geographic Focus | Broad Europe (UK included) | Broad Europe (UK included) | Eurozone only |
| Expense Ratio | 0.08% | 0.09% | 0.51% |
| Top 10 Concentration | 19.8% | 17.76% | 29.8% |
| Best For | Maximum diversification | Core European exposure | Focused eurozone investment |
For broad, low-cost exposure, VGK and IEUR are excellent choices. If you want to focus on eurozone economies, EZU might be the better option despite its higher expenses and concentration risk.
ETF Overview: VGK, IEUR, and EZU
Each ETF brings unique characteristics to the table, helping investors better understand their choices by highlighting differences in scope, size, and the indices they track.
Vanguard FTSE Europe ETF (VGK)
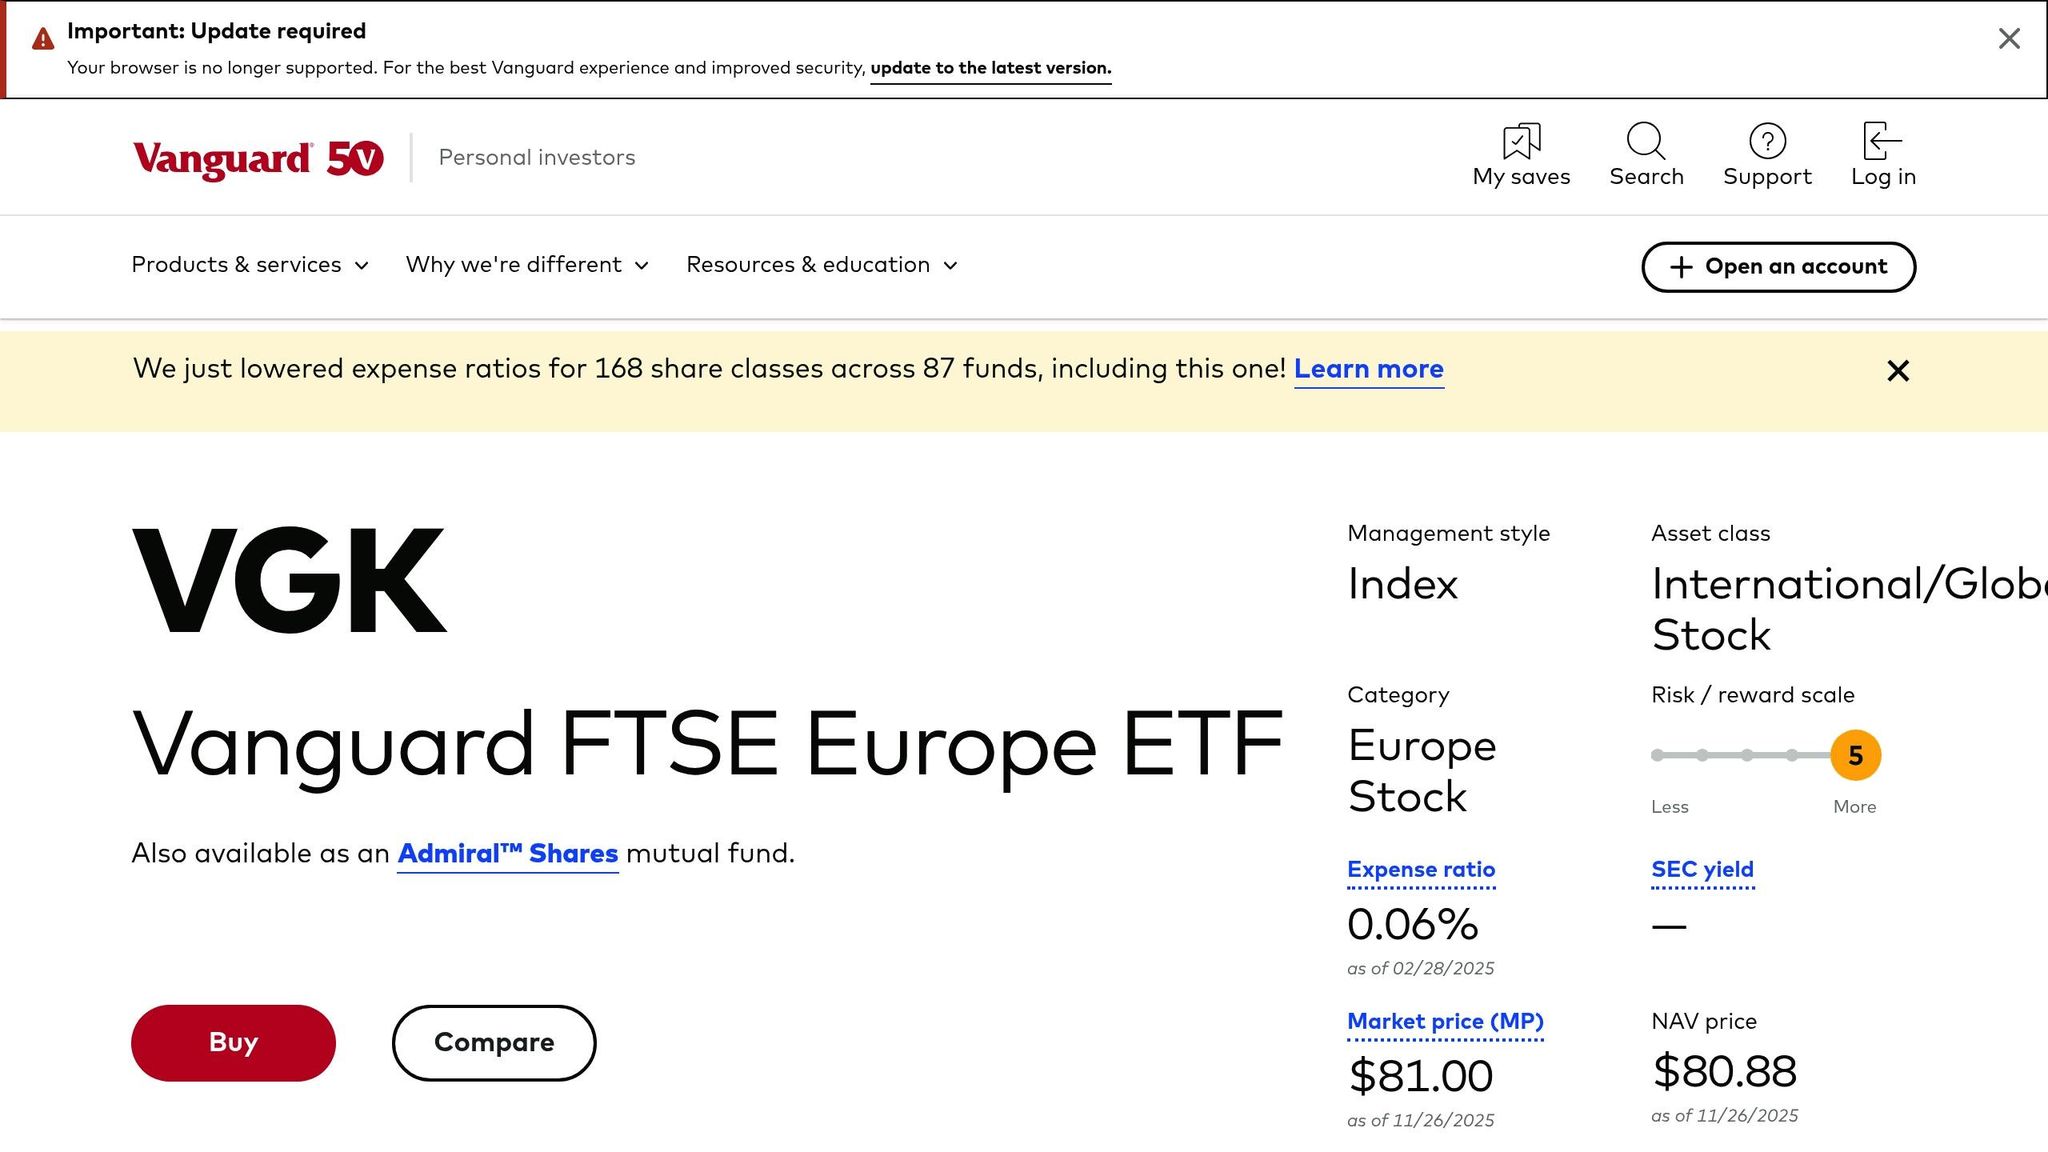
VGK tracks the FTSE Developed Europe All Cap Index and has been available since March 4, 2005. With $35.09 billion in assets under management as of November 27, 2025, VGK leads in size among these ETFs. The "All Cap" label signifies that it doesn't just focus on large-cap stocks - it also includes mid-cap and small-cap companies across developed European markets, providing a more comprehensive exposure.
iShares Core MSCI Europe ETF (IEUR)
IEUR is tied to the MSCI Europe Investable Market Index and launched on June 9, 2014. Designed to serve as a core portfolio component for those looking to invest in European markets, IEUR captures approximately 99% of the free float-adjusted market capitalization across developed European economies.
iShares MSCI Eurozone ETF (EZU)
Issued by BlackRock, Inc., EZU tracks the MSCI EMU Index, also referred to as the MSCI Eurozone Index. It has been available since July 25, 2000 and manages $8.22 billion in assets. What sets EZU apart is its focus solely on eurozone countries, investing in major economies like Germany, France, Italy, Spain, and the Netherlands.
These differences lay the groundwork for analyzing cost structures and performance in the following section.
Cost Comparison: Expense Ratios and Trading Costs
When evaluating the true cost of owning an ETF, it’s important to look beyond the ticker price. Expense ratios, trading costs, and even taxes can influence your long-term returns in ways that aren't immediately obvious.
Expense Ratios
An expense ratio is the annual fee a fund manager charges, expressed as a percentage of your investment. This fee is automatically deducted from the fund’s assets, which directly reduces your returns.
VGK stands out with an expense ratio of 0.08%, making it the most affordable option among the three ETFs discussed. IEUR follows closely at 0.09%, while EZU is significantly pricier with a ratio of 0.51%. For context, the average expense ratio for ETFs typically falls between 0.3% and 0.9%. Both VGK and IEUR are well below this range, which can translate into considerable savings over time.
Even small differences in fees can compound into substantial amounts over several decades. But expense ratios are just one piece of the puzzle - let’s dive into trading costs next.
Bid/Ask Spreads and Trading Volume
Trading costs come into play whenever you buy or sell ETF shares. The bid/ask spread - the gap between the price someone is willing to pay (bid) and the price someone is asking to sell (ask) - is a direct cost that can add up, especially for frequent traders or large transactions.
VGK boasts high liquidity, with a 1-month average daily volume of 3,526,257 shares and a 3-month average daily volume of 2,851,976 shares. This high trading activity leads to tighter bid/ask spreads, reducing transaction costs for investors over time.
EZU, in comparison, has lower liquidity, with a 1-month average daily volume of 1,502,422 shares and a 3-month average daily volume of 1,678,476 shares. While still liquid enough for most retail investors, its relatively lower trading volume can result in slightly wider spreads, which may increase costs for active traders.
Liquidity matters because it allows investors to move in and out of positions quickly and with minimal cost. For those using strategies like dollar-cost averaging or periodic rebalancing, even small differences in trading costs can lead to noticeable savings over the years. But trading costs aren’t the only consideration - taxes also play a key role.
Tax Considerations for U.S. Investors
Taxes are another critical factor when investing in European stocks through U.S.-domiciled ETFs. Many European countries impose withholding taxes on dividends before they reach the ETF, and these taxes are generally non-recoverable for U.S. investors holding shares in standard taxable accounts. The exact rates vary by country, depending on local tax treaties.
EZU, which focuses solely on eurozone countries, may have a different tax profile compared to VGK and IEUR, both of which include exposure to non-eurozone markets such as the United Kingdom and Switzerland. While holding these ETFs in tax-advantaged accounts like IRAs or 401(k)s can reduce some tax burdens, foreign withholding taxes on dividends are still applied at the source.
Understanding these tax details is crucial for managing the total cost of your European investments. By considering expense ratios, trading costs, and tax implications together, you can get a clearer picture of the true cost of maintaining a diversified European portfolio.
Performance Analysis: Returns and Risk
Looking at historical performance provides insights into expected returns and the potential ups and downs in price.
Historical Returns
When comparing long-term results, EZU has edged out the other two ETFs in terms of returns. As of November 27, 2025, EZU achieved a 5-year annualized return of 10.50% and a 10-year annualized return of 8.31%. VGK came close behind, with a 5-year annualized return of 10.13% and a 10-year annualized return of 8.04%.
While the differences - 0.37% over five years and 0.27% over ten years - might seem minor, they can add up significantly over time due to compounding. EZU’s focus on eurozone countries appears to have delivered slightly better returns, though this comes with certain trade-offs in terms of diversification and risk, which we’ll delve into shortly.
On the other hand, IEUR, being a newer fund, doesn’t have the same depth of long-term data as VGK and EZU. However, its focus on core European markets places it somewhere between VGK’s broad exposure and EZU’s concentrated eurozone emphasis.
Risk Metrics and Volatility
Volatility reflects how much an investment's price swings, which directly affects your experience as an investor - especially during market downturns.
VGK showed a standard deviation of 6.20%, slightly higher than EZU’s 5.44%. VGK’s broader reach introduces additional currency and market dynamics, which contribute to this higher volatility.
When looking at drawdowns - the drop from a peak to a trough - the differences become more striking. VGK has experienced a maximum drawdown of ‑63.61% since its inception, far greater than IEUR’s maximum drawdown of ‑36.96%. This highlights VGK's greater exposure to downside risk during major market crises.
Average drawdowns paint a similar picture. VGK’s average drawdown stands at ‑13.61%, compared to IEUR’s more moderate ‑8.48%. As of November 26, 2025, both VGK and IEUR showed nearly identical current drawdowns of about ‑2.47% and ‑2.48%, respectively, reflecting similar recent performance.
Drawdowns and Recovery Periods
Drawdowns provide a snapshot of an ETF's risk profile. VGK’s deeper historical drawdowns suggest it has faced more severe market downturns than IEUR, which reflects VGK’s longer operating history across multiple market cycles.
EZU, however, carries its own set of risks. As one analysis pointed out:
"Despite strong momentum and attractive valuation discounts, EZU's cyclical-heavy portfolio is vulnerable to weak Eurozone growth and potential euro depreciation." – Seeking Alpha
This means EZU’s performance is closely tied to the economic health of the eurozone. During periods of strong growth in Europe, its concentrated portfolio can deliver amplified returns. However, if the eurozone economy falters or the euro weakens against the dollar, EZU could see steeper losses compared to its more diversified peers.
VGK’s history of deeper drawdowns indicates it may take longer to recover from severe market stress, while IEUR’s more moderate declines hint at potentially quicker recovery periods. That said, IEUR’s shorter track record leaves less data to draw firm conclusions. Ultimately, higher volatility and larger drawdowns aren’t inherently negative - they’re simply factors to weigh alongside your financial objectives and ability to weather market turbulence.
Next, we’ll explore how geographic exposure and sector allocations set these ETFs apart.
Holdings and Regional Diversification
Geographic exposure plays a key role in shaping both risk and returns.
Geographic Exposure
The geographic focus of these ETFs sets them apart. Both VGK and IEUR provide coverage of developed European markets, including major non-eurozone countries like the United Kingdom and Switzerland. On the other hand, EZU focuses solely on eurozone countries, excluding nations that haven't adopted the euro.
This distinction introduces differences in currency exposure and regulatory environments. The number of holdings further highlights these contrasts. VGK includes 1,229 individual securities, while IEUR holds 1,007, and EZU contains just 221 securities. With fewer holdings, EZU faces higher concentration risk - underperformance by a small group of companies or sectors could have a more noticeable impact on the fund.
When it comes to the top 10 holdings, these account for 17.26% of VGK's total assets and 17.76% of IEUR's assets. In comparison, EZU's top 10 holdings make up a significant 27.28% of the fund. This means over a quarter of your investment in EZU is tied to just ten companies, amplifying the influence of their performance. These geographic and structural differences also affect sector allocation and the composition of top holdings.
Sector Allocation and Top Holdings
VGK and IEUR provide broader diversification, with their top 10 holdings representing around 17% of total assets. In contrast, EZU's higher concentration - 27% of assets in its top 10 holdings - makes it more sensitive to the performance of individual stocks. Evaluating these differences is essential when aligning your investment with your risk tolerance and financial goals.
Which ETF Fits Your Investment Goals
Deciding between VGK, IEUR, and EZU comes down to your investment strategy, risk tolerance, and how much geographic focus you want in your European allocation. Each ETF caters to a different approach - whether you're looking for broad exposure, core market coverage, or a more targeted focus on the eurozone. Here's a breakdown of how each aligns with specific investment goals.
VGK: Broad European Exposure
VGK provides extensive diversification across developed European markets, with a portfolio of 1,229 holdings that helps reduce concentration risk. It tracks the FTSE Developed Europe All Cap Index, offering exposure to companies in all major European markets - not just eurozone countries.
"VGK is an index fund from Vanguard that invests in the 'FTSE Developed Europe All Cap Index, which measures the investment return of stocks issued by companies located in the major markets of Europe.'" - Michael Byrne
The top 10 holdings make up just 19.8% of the fund. VGK also includes markets like the United Kingdom and Switzerland, which don't use the euro, adding another layer of diversification. Notably, it features eight of Europe's "GRANOLAS" (high-quality growth companies) among its top holdings, compared to four in EZU.
This makes VGK a solid choice for investors who want a stable, diversified European allocation with minimal maintenance.
IEUR: Core European Market Coverage
IEUR is well-suited for long-term investors seeking broad, low-cost access to European markets. Understanding how expense ratios impact ETF returns is crucial for maximizing these long-term gains. Tracking the MSCI Europe Index, it offers exposure to 1,007 holdings, with 17.76% of its assets concentrated in the top 10 positions.
This ETF is ideal for buy-and-hold investors. Its index construction provides a slightly different perspective compared to VGK, which can help avoid overlap with other MSCI-based funds in your portfolio. For those using a core-satellite strategy, IEUR works effectively as the core European holding, benefiting from compounding returns over time.
EZU: Focused Eurozone Investment
EZU is tailored for investors targeting eurozone countries and comfortable with a more concentrated portfolio. This ETF focuses exclusively on developed markets that use the euro as their official currency, excluding non-eurozone countries like the UK and Switzerland.
With 221 stocks and 29.8% of its assets concentrated in the top 10 holdings, EZU is more concentrated than VGK or IEUR. While this concentration can amplify returns if the top holdings perform well, it also increases vulnerability to underperformance in a few key companies.
EZU is a good fit if you have a specific outlook on the eurozone economy or want to tactically overweight that region in your portfolio. However, it’s best used to complement broader international diversification rather than serving as your primary European exposure.
How Mezzi Improves ETF Selection and Portfolio Management

Deciding between ETFs like VGK, IEUR, and EZU means carefully weighing their features against your portfolio's goals, tax-efficient ETF investing strategies, and diversification strategies. Mezzi’s platform simplifies this process, providing tools to help you make informed choices. Here’s how Mezzi enhances ETF selection and portfolio management.
AI-Driven Insights for ETF Selection
Mezzi leverages aggregated account data to deliver tailored insights that align European ETFs with your investment objectives and risk tolerance.
The platform also provides real-time alerts and prompts to keep you ahead of evolving market conditions. For just $199 annually under the Build Wealth Faster membership, you gain access to inclusive AI chat. This feature allows you to ask questions and receive customized guidance - a level of personalized analysis that traditionally comes with a hefty price tag when working with financial advisors.
Tax Optimization and Wash Sale Prevention
Navigating the tax complexities of international ETFs can be daunting. Mezzi simplifies this by tracking your transactions to prevent wash sales and pinpointing opportunities to reduce your tax burden.
Portfolio Analysis with the X-Ray Feature
Mezzi’s X-Ray tool offers a detailed breakdown of your portfolio’s underlying holdings, providing a clear view of exposure across companies, sectors, and regions. This feature helps identify overlaps among European ETFs, offering diversification insights that typically require expensive software to uncover.
Conclusion: Comparing VGK, IEUR, and EZU
Deciding between these ETFs comes down to how well each aligns with your investment strategy. They each provide access to European markets but differ in cost, diversification, and geographic focus.
ETF Strengths and Weaknesses
VGK (Vanguard FTSE Europe ETF) offers wide-ranging diversification across developed European economies, including major markets like the UK and Switzerland alongside Eurozone nations. Its top 10 holdings make up just 19.8% of the fund, lowering concentration risk compared to its peers. VGK also boasts a low expense ratio and a higher dividend yield than EZU. With an average price-to-earnings ratio of 14.7x, it reflects reasonable valuations across its holdings. For investors seeking broad European exposure at a low cost, VGK is a solid choice.
IEUR (iShares Core MSCI Europe ETF) provides similar broad market coverage, including the UK and Switzerland, and matches VGK's low expense ratio, making it equally appealing in terms of fees. One standout feature is its lower maximum drawdown compared to VGK, which could mean better downside protection during market volatility. IEUR offers comparable diversification and cost benefits to VGK, with slightly different risk characteristics that may suit certain investors.
EZU (iShares MSCI Eurozone ETF) takes a more focused approach, concentrating on Eurozone countries and excluding key markets like the UK and Switzerland. With just 224 holdings, it offers less diversification, and its top 10 holdings account for 29.8% of the fund, leading to higher concentration risk. EZU also has a higher expense ratio, which can chip away at returns over time. While it has occasionally outperformed in recent periods, this comes at the expense of reduced diversification and higher costs. EZU is best for those wanting targeted exposure to Eurozone economies and currency trends.
The table below highlights these differences for easy comparison:
Comparison Table
| Feature | VGK | IEUR | EZU |
|---|---|---|---|
| Number of Holdings | 1,279 stocks | 1,010 stocks | 224 stocks |
| Geographic Coverage | Broad Europe (includes UK, Switzerland) | Broad Europe (includes UK, Switzerland) | Eurozone only (excludes UK, Switzerland) |
| Top 10 Concentration | 19.8% | Similar to VGK | 29.8% |
| Expense Ratio | Very low | Very low | Higher |
| Dividend Yield | Higher than EZU | Moderate | Lower than VGK |
| P/E Multiple | 14.7x | Similar to VGK | Higher concentration impact |
| Risk Profile | Moderate | Lower max drawdown vs. VGK | Higher concentration risk |
| Best For | Maximum diversification across Europe | Core European exposure with lower drawdown | Targeted Eurozone investment |
Next Steps
To make an informed choice, Mezzi's tools can help you determine which ETF fits your portfolio best. The X-Ray feature provides a detailed breakdown of how each ETF complements your existing investments, flagging overlaps or gaps in European market exposure. Meanwhile, AI-driven insights analyze your financial situation to recommend the ETF that aligns with your goals and risk tolerance. Mezzi also offers automated tax optimization tools to help you implement your choice while avoiding wash sales and minimizing taxes. You can also follow a checklist for ETF tax-loss harvesting to further reduce your liability. At $199 per year, Mezzi delivers professional-grade analysis without the hefty costs of traditional financial advisors.
FAQs
What are the key geographic differences between VGK, IEUR, and EZU, and how do they influence investment strategies?
VGK gives investors wide-reaching access to European markets, covering both Eurozone and non-Eurozone countries. This makes it an appealing option for those looking to diversify their investments across the entire region. EZU, in contrast, zeroes in solely on Eurozone member countries, making it a better fit for those seeking exposure specifically to economies tied to the Euro. Meanwhile, IEUR offers a broad European focus similar to VGK but comes with slight variations in holdings and weightings, which can influence both performance and risk.
These geographic differences play a big role in shaping investment strategies. For instance, EZU's tighter focus on the Eurozone might make it more sensitive to economic shifts within that area. On the other hand, VGK and IEUR provide more balanced exposure by including the UK and other non-Eurozone countries, potentially spreading out risk. Deciding which ETF suits your portfolio best will depend on your investment objectives, risk appetite, and how much diversification you’re aiming for.
How do the expense ratios and trading costs of VGK, IEUR, and EZU impact long-term returns?
Expense ratios and trading costs are key factors that can significantly impact long-term investment returns. Among the options, VGK stands out with the lowest expense ratio, ranging between 0.06% and 0.11%, making it a highly cost-efficient choice. IEUR is close behind, with an expense ratio ranging from 0.09% to 0.11%, while EZU comes in much higher at 0.51%.
Over time, higher fees can take a noticeable toll on returns, especially when compounded. For those focused on growing their portfolio, opting for ETFs with lower costs - like VGK or IEUR - can lead to better overall performance in the long run.
What are the tax considerations for U.S. investors holding European ETFs like VGK, IEUR, or EZU in taxable accounts?
U.S. investors with European ETFs in taxable accounts need to keep a close eye on potential tax issues. For starters, there are capital gains taxes to consider when you sell shares. On top of that, dividend income from these ETFs can be taxed, and it might also face foreign withholding taxes.
Another important factor is that some European ETFs may fall under the Passive Foreign Investment Company (PFIC) rules. This can lead to higher tax rates and more complicated reporting requirements, making it essential to understand how these rules apply.
To avoid unexpected tax headaches, it's a smart move to work with a tax professional who has experience with international investments. They can help you stay compliant while finding ways to refine your tax strategy.
Related Blog Posts
- SCHD/VYM/DGRO head-to-head: dividend yields, 5/10-year dividend growth, fees, and top-10 overlap.
- VXUS vs VEU vs IXUS - Best total international ETF for one-ticket ex-US exposure
- VWO vs IEMG vs SPEM - Best emerging markets ETF for cost and breadth
- VXUS vs IXUS: Which International ETF for a Three-Fund Portfolio
Table of Contents
Book Free Consultation
Walk through Mezzi with our team, review your current situation, and ask any questions you may have.