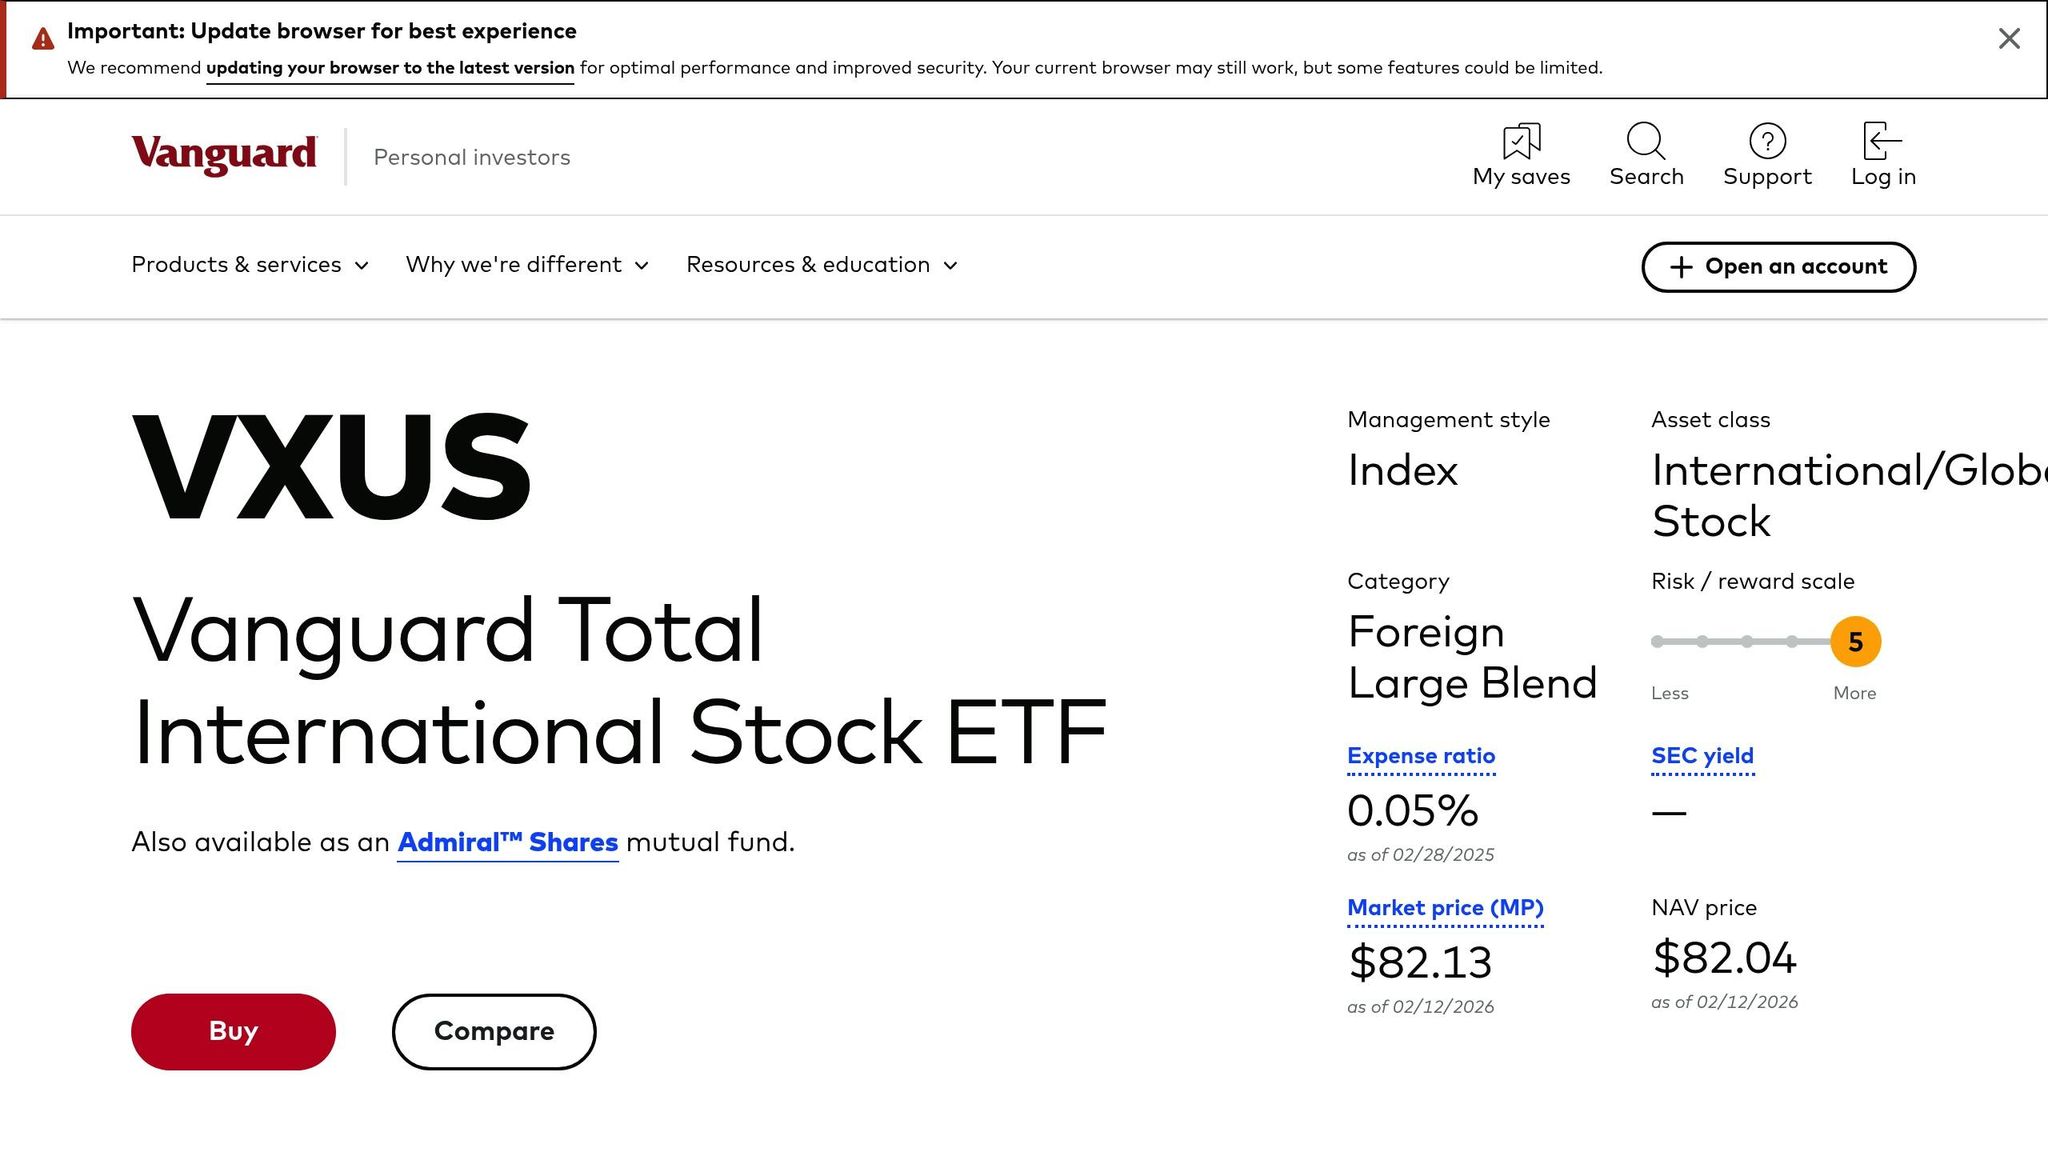
When building a three-fund portfolio, choosing the right international ETF is crucial for diversification and cost efficiency. VXUS (Vanguard Total International Stock ETF) and IXUS (iShares Core MSCI Total International Stock ETF) are two leading options. Here's a quick breakdown:

  • VXUS has a lower expense ratio (0.05% vs. 0.07%) and broader market coverage with 8,646 stocks compared to IXUS's 4,131.
  • IXUS offers slightly higher dividend yields (2.94% vs. 2.89%) and better tax efficiency in taxable accounts due to a higher proportion of qualified dividends.
  • Both ETFs provide exposure to developed and emerging markets, with slight differences in regional allocations and benchmarks.
  • Performance and risk metrics are nearly identical, with a 0.99 correlation, making either a solid choice for international exposure.

Quick Comparison

Feature VXUS IXUS
Expense Ratio 0.05% 0.07%
Number of Holdings 8,646 4,131
Dividend Yield 2.89% 2.94%
Tax Efficiency Lower QDI, better for tax-advantaged accounts Higher QDI, better for taxable accounts
Benchmarks FTSE Global All Cap ex US MSCI ACWI ex USA IMI
Developed Markets 65.2% 78.84%
Emerging Markets 28.4% 21.16%

Key takeaway: Choose VXUS for lower fees and broader diversification, especially in tax-advantaged accounts. Opt for IXUS in taxable accounts for better after-tax returns.

VXUS vs IXUS International ETF Comparison Chart

VXUS vs IXUS International ETF Comparison Chart

Costs and Expense Ratios

Annual Expense Ratios

When comparing costs, VXUS stands out with a fee of just 0.05%, which is slightly lower than IXUS's 0.07%. While the difference of 0.02% might seem small, it can grow significantly over time. Both ETFs boast expense ratios well below the industry average of approximately 0.85%, making them appealing for investors mindful of costs. For example, historical data shows that a $1,000 investment over five years would grow to $1,247 in VXUS, compared to $1,242 in IXUS. Although this difference may appear minor, it underscores how expense ratios impact ETF returns and long-term portfolio performance, especially within a three-fund portfolio framework.

Assets Under Management

VXUS's advantages extend beyond fees, as its larger asset base contributes to better liquidity and smoother trading. VXUS manages a hefty $573.7 billion in assets, dwarfing IXUS's $56.9 billion. This scale directly impacts trading efficiency, with VXUS averaging about 10.35 million shares traded daily, compared to just 2.51 million shares for IXUS. Additionally, VXUS boasts a 30-day median bid/ask spread as low as 0.01%, ensuring trades are executed with minimal friction.

A verified user from the AInvest Community, Stevitop, succinctly puts it:

"VXUS isn't just cheaper - it's the only ETF with enough scale to avoid the bid-ask slap tax."

For those building a three-fund portfolio, VXUS combines lower fees with superior liquidity, making it an efficient choice for international exposure. While both ETFs are strong contenders, VXUS's scale and cost-effectiveness make it particularly practical for streamlined portfolio management.

Geographic Coverage and Market Exposure

Developed vs. Emerging Markets Allocation

Both VXUS and IXUS provide international exposure but follow different indices, which leads to distinct regional allocations. VXUS tracks the FTSE Global All Cap ex US Index, while IXUS is based on the MSCI ACWI ex USA IMI Index. As of December 31, 2025, VXUS allocates its portfolio as follows: 38.20% to Europe, 26.80% to Emerging Markets, and 25.60% to Pacific markets. On the other hand, IXUS allocates 42.40% to Europe and 45.96% to Asia Pacific.

When considering the broader split, VXUS distributes 65.2% to developed markets and 28.4% to emerging markets. Both ETFs show similar country-level exposures, with Japan accounting for 15.1% in VXUS versus 15.28% in IXUS, and Canada making up 7.0% in VXUS compared to 7.92% in IXUS.

Region VXUS Allocation IXUS Allocation
Europe 38.20% 42.40%
Asia Pacific/Emerging 26.80% 45.96%
Pacific (Developed) 25.60% Included in Asia Pacific
North America (ex-US) 8.10% 11.60%

These differences highlight the unique strategies each ETF employs to achieve international diversification.

Number of Holdings and Market Coverage

VXUS stands out with a much larger portfolio, holding 8,646 stocks, which is more than double IXUS's 4,131 holdings. This is because VXUS includes a greater number of small- and micro-cap companies, offering broader market representation. Eric Trie, a contributing stock analyst at The Motley Fool, notes:

"VXUS holds far more stocks, which brings more smaller companies into the portfolio and results in broader market representation"

This broader inclusion can enhance diversification within a portfolio. Despite the difference in the number of holdings, both ETFs share the same top names in their portfolios, such as Taiwan Semiconductor Manufacturing, Tencent Holdings, and ASML Holding, and they exhibit a strong price movement correlation of 0.99.

In terms of market capitalization, both lean heavily toward large-cap stocks. VXUS allocates 75.2% to large caps, while IXUS allocates 78.84%. For small caps, IXUS dedicates 4.73%, compared to VXUS's 3.8%.

Dividend Yields and Income Generation

Dividend Yields and Payment Schedules

As of February 2026, IXUS offers a 2.94% yield, translating to an annual dividend of $2.74 per share. Meanwhile, VXUS provides a slightly lower yield of 2.89%, with an annual dividend of $2.40 per share.

Both ETFs follow a quarterly dividend distribution schedule, with payments typically made in March, June, September, and December. For the most recent quarterly distribution in December 2025, IXUS paid $1.57 per share, while VXUS distributed $1.36 per share. These differences in yield and payout can also have implications for taxes, which are especially important for U.S. investors to consider.

Tax Implications for U.S. Investors

Tax efficiency varies between these two ETFs when held in taxable accounts. IXUS generally offers a higher proportion of qualified dividend income (QDI), making it more tax-efficient in such accounts. For example, in 2021, 69.41% of IXUS's dividends qualified for favorable tax treatment, compared to 64.53% for VXUS. Qualified dividends are taxed at the more favorable long-term capital gains rates instead of ordinary income rates.

Additionally, the foreign tax credit differs between the two funds. In 2023, IXUS provided a foreign tax credit equal to 10.3% of its dividend, whereas VXUS's foreign tax credit was lower, at 7.9%. This credit can help offset taxes on foreign income, a useful feature for investors in taxable accounts. The 2025 U.S. tax reform also increased the foreign tax credit for Net CFC Tested Income from 80% to 90%, further benefiting international ETF investors in taxable accounts.

For tax-advantaged accounts like IRAs or 401(k)s, VXUS might be a better choice. In these accounts, foreign tax liabilities are less of a concern, allowing investors to take advantage of VXUS's lower 0.05% expense ratio and broader diversification. However, timing matters - it's wise to avoid purchasing these ETFs right before the December distribution to prevent an immediate tax bill.

Performance and Risk Analysis

Historical Returns Comparison

When comparing VXUS and IXUS, the performance differences are minimal across all timeframes. For the year ending February 13, 2026, IXUS delivered a return of 36.80%, edging out VXUS's 36.69% by just 0.11%. Over the long term, the gap remains small: IXUS posted an annualized 10-year return of 10.74%, slightly above VXUS's 10.68%, while over 5 years, VXUS returned 8.43%, narrowly surpassing IXUS's 8.34%.

Period VXUS (Vanguard) IXUS (iShares)
1-Year 36.69% 36.80%
3-Year (Annualized) 17.60% 17.63%
5-Year (Annualized) 8.43% 8.34%
10-Year (Annualized) 10.68% 10.74%

The long-term return differences are consistently minor, often less than 0.10% annually. Their nearly perfect correlation of 0.99 underscores their similar exposure to non-U.S. stocks, spanning both developed and emerging markets. This consistent alignment in returns naturally shifts focus to their risk profiles, where subtle distinctions emerge.

Volatility and Beta Coefficients

VXUS demonstrates slightly lower volatility compared to IXUS, with a daily standard deviation of 15.74% versus 15.93%. This reduced volatility can be attributed to VXUS's broader diversification - it holds about 8,646 stocks, significantly more than IXUS's 4,131 holdings. Additionally, VXUS experienced a smaller maximum drawdown of –35.97% compared to IXUS's –36.22%.

Risk-adjusted metrics also give a slight edge to VXUS. It has a Sharpe Ratio of 2.34 and a Sortino Ratio of 3.19, marginally outperforming IXUS's 2.32 and 3.17, respectively. When compared to the S&P 500, VXUS exhibits a beta of 0.74, indicating lower sensitivity to U.S. market movements, whereas IXUS has a beta of 1.02.

"From IXUS's inception in 2012 through 2021, VXUS has slightly beaten it on return but with slightly greater volatility and a larger max drawdown. Thus, their risk-adjusted return has been identical." – John Williamson, APMA, Optimized Portfolio

While the differences in performance and risk metrics are minor, factors like cost and tax efficiency may play a more decisive role when choosing between these ETFs, especially for a three-fund portfolio strategy.

How to Choose Between VXUS and IXUS for Your Portfolio

VXUS

Diversification Benefits in a Three-Fund Portfolio

VXUS and IXUS play a key role in a three-fund portfolio by offering exposure to international markets. VXUS holds 8,646 stocks compared to IXUS's 4,131, providing broader coverage, especially in small- and micro-cap companies.

Even with this difference, their performance is nearly identical. A 0.99 correlation between the two funds highlights how closely they move together. Both include leading international companies, making them reliable options for global diversification.

"These funds are nearly identical except for subtle differences."
– John Williamson, APMA®, Optimized Portfolio

VXUS stands out for its deeper small-cap exposure, making it ideal for investors seeking the broadest international reach. On the other hand, IXUS offers similar diversification benefits but with a more focused selection of holdings. Either fund complements U.S. stocks in a three-fund portfolio while reducing overall portfolio volatility. Choosing the right one depends on how closely their features align with your investment goals.

Matching ETFs to Your Investment Goals

Once you understand their diversification benefits, the next step is aligning your ETF choice with your specific goals and account type. For tax-advantaged accounts, VXUS's lower expense ratio of 0.05% becomes a key factor. Over 30 years, this fee difference could save about $5,000 on a $100,000 investment. Additionally, VXUS's broader reach means it captures thousands of extra small-cap international companies, which may appeal to long-term growth-focused investors.

In taxable brokerage accounts, IXUS often has the edge. It has historically paid a higher percentage of qualified dividends, which are taxed at a lower rate, and its dividend yield of 2.97% slightly exceeds VXUS's 2.92%.

"VXUS provides wider coverage at a lower cost, making it well-suited for long-term international allocations. IXUS can make sense when income matters more, and the fee difference is secondary."
– Eric Trie, Contributing Stock Analyst, The Motley Fool

For long-term investors focused on growth, VXUS's extensive small-cap exposure might be the better fit. Meanwhile, those prioritizing tax efficiency in taxable accounts might lean toward IXUS for its dividend advantages. Both funds carry high risk ratings (5 out of 5 on Vanguard's scale) and should be part of a diversified portfolio that includes U.S. stocks and bonds.

Another advantage of these funds is their suitability for ETF tax-loss harvesting strategies. Since they track different indexes but share a 0.99 correlation, investors can switch between them to realize tax losses without sacrificing market exposure. This feature makes them excellent core international holdings in a well-rounded three-fund portfolio.

Conclusion

Key Differences Between VXUS and IXUS

VXUS and IXUS both offer broad international exposure, making them solid choices for a three-fund portfolio. However, they differ in a few important ways. VXUS holds about 8,646 stocks, compared to IXUS's 4,131 stocks, which means VXUS includes a larger share of small-cap companies.

When it comes to fees, VXUS has a slight edge with an expense ratio of 0.05%, while IXUS charges 0.07%. On the other hand, IXUS tends to distribute a higher percentage of qualified dividends, which can improve after-tax returns in taxable accounts. Looking at dividend yields, IXUS leads slightly with a 2.97% yield, compared to VXUS's 2.92%.

Both funds have a 0.99 correlation and share top holdings such as Taiwan Semiconductor Manufacturing Co., Tencent Holdings, and ASML Holding. The difference in their benchmarks is another factor: VXUS tracks the FTSE Global All Cap ex US Index, while IXUS follows the MSCI ACWI ex USA IMI Index.

Decision Framework

These distinctions can help you decide which ETF fits your investment strategy. In tax-advantaged accounts, VXUS stands out for its lower fees, making it more cost-efficient over time. For taxable accounts, IXUS’s higher percentage of qualified dividends may result in better after-tax returns.

If your goal is maximum diversification, VXUS's broader portfolio of over 8,600 holdings is ideal. However, if you're prioritizing income generation in a taxable account, IXUS's slightly higher dividend yield and tax-friendly structure may be more appealing.

Both funds are rated as high risk (5 out of 5 on Vanguard's scale), making them suitable for investors comfortable with market volatility. Their near-identical correlation also makes them great options for tax-loss harvesting, allowing you to switch between them to offset losses without changing your overall market exposure. Whether you choose VXUS or IXUS, either ETF provides a reliable, low-cost way to round out your three-fund portfolio.

VXUS vs. IXUS – Vanguard or iShares International ETF?

Vanguard

FAQs

How much international stock should I hold in a three-fund portfolio?

A standard three-fund portfolio usually dedicates 20-30% to international stocks. The specific percentage you choose should align with your risk tolerance and investment goals. These factors help determine the level of global diversification that makes sense for you. Be sure to tailor your allocation to fit your financial objectives and how comfortable you are with market ups and downs.

Does VXUS or IXUS include international small-cap stocks?

VXUS and IXUS both include international small-cap stocks, but they approach this differently. VXUS provides broader exposure by covering all-cap stocks, which means it includes large-, mid-, and small-cap stocks. On the other hand, IXUS focuses more on large- and mid-cap stocks, with some small-cap stocks included as part of its mix.

Can I swap VXUS and IXUS for tax-loss harvesting without triggering a wash sale?

Swapping VXUS and IXUS for tax-loss harvesting is generally considered unlikely to trigger a wash sale because they track different indices. However, since both are broad international funds, there's a chance the IRS could interpret them as "substantially identical." To avoid potential issues, it's a good idea to consult a tax professional who can offer advice tailored to your specific situation.

Table of Contents

Book Free Consultation

Walk through Mezzi with our team, review your current situation, and ask any questions you may have.

Book Free Consultation
Ask ChatGPT about Mezzi