
If I strip this topic down to the part most readers want fast, it’s this:
- Farmland may offer rent + land value growth, but money may stay tied up for 5 to 12 years
- Art may offer low correlation to stocks, but returns may depend on a later sale, with high fees and a top 28% federal collectibles tax rate
- Pre-IPO investing may offer upside if a company exits, but it may also carry a high total-loss risk and long holding periods
- Private credit may focus on income, often in the 8% to 12% range, but that income may be taxed at ordinary income rates
A simple way I’d frame it: alternatives may fit best as a small side allocation, not the core of a portfolio. Some investors use a rough range of 5% to 20% of net worth, while keeping at least six months of living expenses in cash outside illiquid holdings.
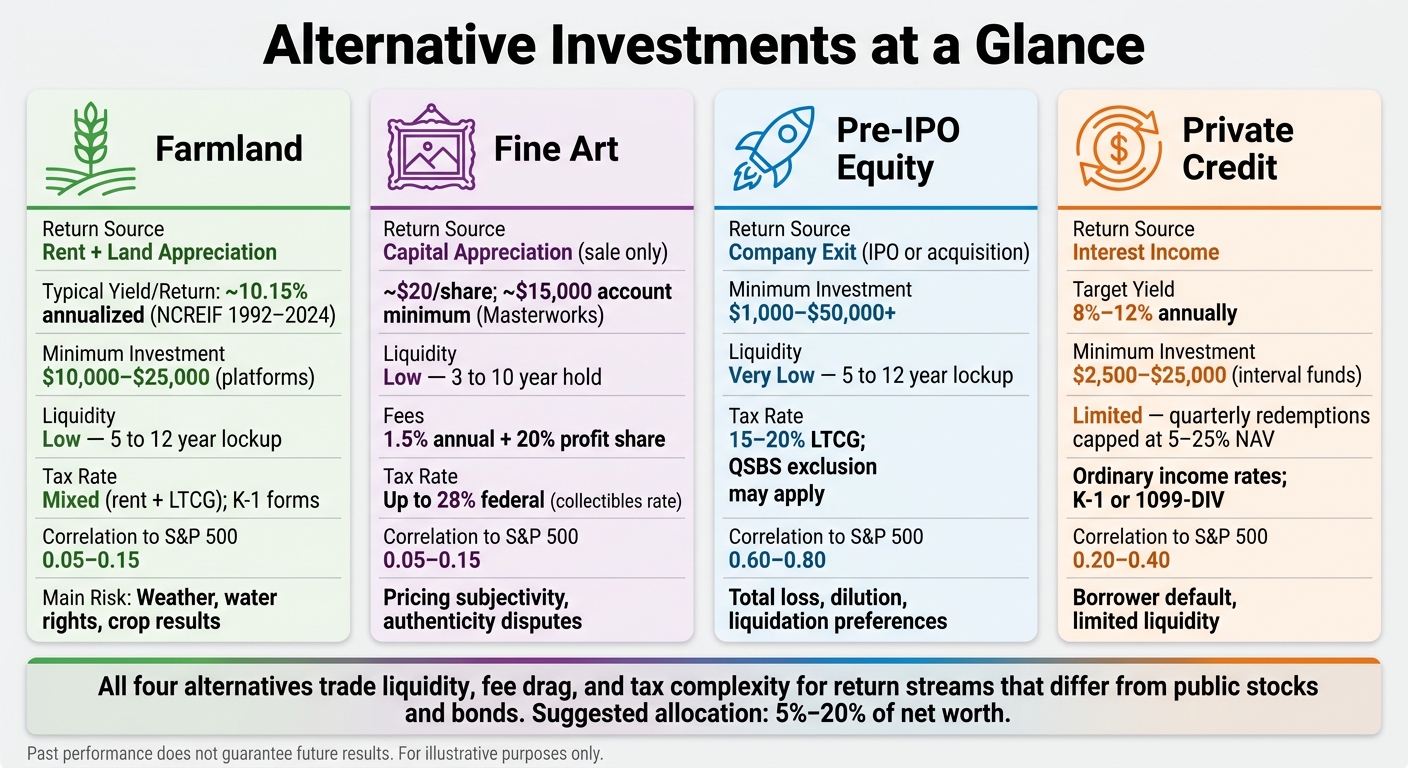
Alternative Investments Compared: Farmland, Art, Pre-IPO & Private Credit
Finance and Economics Masterclass Part 10: Alternative Investments
Quick Comparison
| Asset | Main return source | Typical minimum | Liquidity | Main tax note | Main risk |
|---|---|---|---|---|---|
| Farmland | Rent + appreciation | $10,000–$25,000 on platforms | Low; often 5–12 years | May involve K-1s; some tax offsets may apply | Weather, water access, crop results |
| Art | Sale at a higher price | Shares from about $20; some platforms may require $15,000 accounts | Low; often 3–10 years | Gains may face up to 28% federal tax | Pricing subjectivity, title disputes |
| Pre-IPO | Exit gains | $1,000–$50,000+ depending on route | Very low; often 5–12 years | LTCG rules may apply; QSBS may apply in some cases | Failure, dilution, preference stack |
| Private credit | Interest income | From about $2,500 in some interval funds | Limited; redemptions may be capped | Income may be taxed as ordinary income | Default risk, limited liquidity |
Here’s the short version: the asset itself may matter less than the tradeoff. What you may be buying is not just farmland, art, private shares, or loans. You may be buying illiquidity, fee drag, tax complexity, and slower price discovery in exchange for a return stream that may differ from public stocks and bonds.
So if I were comparing these four areas at a high level, I’d focus on just four questions:
- Where may the return come from?
- How long may the money stay locked up?
- How may taxes work?
- What job may this play in the portfolio?
That framework may keep the decision simple, even when the asset class does not.
Farmland and Art: Two Real Assets With Very Different Return Profiles
Farmland and art are both real assets, but they may behave in very different ways. Farmland may offer two sources of return: tenant rent and land appreciation. Art does not produce income, so any return may depend on a later sale. Put simply, farmland may pay owners while they wait. Art usually does not.
Farmland: income, appreciation, minimums, liquidity, taxes, and risks
Farmland returns may come from rent and appreciation. Row crops may produce steadier returns, while permanent crops may earn more but also come with higher water-rights and labor costs. On quality Midwest ground, cash rent often runs about $150 to $350 per acre per year. Over the long run, the NCREIF Farmland Index returned an annualized 10.15% from 1992 through 2024, with a standard deviation of 6.8% versus 15.5% for the S&P 500. For some investors, that lower volatility may be part of the appeal.
In 2024, the NCREIF Farmland Index posted its first negative annual return, at -1.03%. That move was tied mainly to a -10.18% drop in permanent cropland, while annual cropland rose 5.66%.
Water rights may matter a lot, especially in the Western U.S. In California, the Sustainable Groundwater Management Act (SGMA) has already been tied to major valuation swings. One San Joaquin Valley farm fell from about $9 million to under $4 million after groundwater rules restricted well use.
"We continue to see this divergence between the values of properties that have multiple sources of water and properties that are reliant on wells only. That is SGMA's influence." - Janie Gatzman, San Joaquin Valley Land Appraiser
Getting into farmland may also depend on the route an investor takes. Direct ownership usually requires $500,000 or more. Platforms such as AcreTrader and FarmTogether lower the minimum to about $10,000 to $25,000, though investors may face 5- to 12-year lockups and annual fees of roughly 0.75% to 2%. Publicly traded farmland REITs such as Gladstone Land (LAND) offer daily liquidity and no minimum beyond the price of one share, although their returns may be more tied to the stock market.
| Farmland Investment Type | Typical Minimum | Liquidity | Key Characteristics |
|---|---|---|---|
| Direct Ownership | $500,000+ | Very low (months to sell) | Full control; high management burden; 1031 eligible |
| Private Funds/Platforms | $10,000–$25,000 | Low (5–12 yr lockup) | Passive; diversified; higher fee stack |
| Public REITs (e.g., LAND) | ~$1 (1 share) | High (daily) | Liquid; dividend-focused; higher correlation to stock market |
Direct owners may also get tax features that art usually does not. They may depreciate improvements and may defer gains through a 1031 exchange.
Farmland has cash flow and measurable land value. Art depends more on subjective pricing and a later sale.
Art: pricing opacity, collectibles taxes, transaction costs, and authenticity risk
Art investing works in a very different way. Farmland has comparable acreage sales and land value summaries that may help anchor pricing. Art is one of a kind, so valuation may be much more subjective.
Costs are also high. Auction buyers often pay 10% to 25% premiums, and sellers may pay 2% to 10% commissions. Then there are storage costs, insurance, and appraisal fees. Once those are added in, short-term speculation may look much less attractive.
There is also the issue of authenticity. A forgery or misattribution may wipe out value, and standard insurance usually covers physical damage or theft, not title or authenticity disputes. That is a very different risk from owning land. With farmland, you may argue about water, rents, or yields. With art, you may end up asking a harder question: is the piece even what everyone thought it was?
Tax treatment in the U.S. may also be less favorable. Gains on art and other collectibles are taxed at a maximum federal rate of 28%, compared with 15% to 20% for long-term capital gains on traditional securities. Unlike farmland, art is generally not eligible for 1031 like-kind exchanges, so there may be no direct way to defer those taxes.
Fractional platforms like Masterworks have lowered the entry bar for blue-chip art by artists such as Warhol and Basquiat. Individual shares may start around $20, though some accounts require about $15,000 to open. Masterworks charges a 1.5% annual management fee plus a 20% profit share on exit, and art platforms generally target 3- to 10-year hold periods.
| Art Access Method | Typical Minimum | Costs | Liquidity |
|---|---|---|---|
| Direct Purchase | Variable | 10%–25% buyer premium, 2%–10% seller commission, plus storage/insurance | Very low |
| Fractional Platforms (e.g., Masterworks) | ~$15,000 account minimum; shares can start around $20 | 1.5% annual fee + 20% profit share | Low (secondary market) |
| Art Funds | $250,000+ | About 2% AUM + 20% carry | Very low |
Art’s correlation to stocks and bonds has been near zero, which may give it diversification value. But that potential upside comes with patience, high transaction costs, and a comfort level with subjective valuation.
Next, the comparison shifts from real assets to private-market claims: pre-IPO equity and private credit.
Pre-IPO and Private Credit: Growth Risk vs. Income Risk
Unlike farmland and art, these private-market assets depend on how a company performs, not on physical scarcity. Pre-IPO equity looks for upside from company growth. Private credit looks for income from lending. So the return driver, payout schedule, and risk setup may look very different.
Pre-IPO investing: access routes, dilution, lockups, QSBS, and total-loss risk
Pre-IPO investing means buying equity in a private company before it goes public or gets acquired. The idea is to profit if the company later goes public or gets acquired.
This part of the market carries very high risk. A total loss may happen if the company never reaches a liquidity event. Top-quartile venture capital funds have targeted 3x to 5x net returns across a portfolio over a 10-year horizon, but those results may be tied to a small group of winners rather than broad success across every deal.
There are a few common ways in. Angel syndicates on platforms like AngelList may give accredited investors access to deals with low minimums. Secondary platforms such as Forge Global and EquityZen may let you buy existing shares in late-stage private companies. Traditional venture funds, on the other hand, usually lock up capital for 7 to 12 years.
Two risks matter right away: dilution and liquidation preferences.
Dilution means each new funding round may reduce your ownership percentage. A 1% stake today may fall to 0.5% after later rounds. Liquidation preferences add another layer. If you own common shares instead of preferred, institutional investors with liquidation preferences may get paid first in a sale or wind-down. That pecking order may change the outcome a lot.
Private valuations may also move fast, even when that shift doesn't show up day to day the way public stocks do. In 2023, Stripe cut its internal valuation by roughly 50% during a down-round. That example shows how sharply private marks may reset.
On taxes, gains on shares held at least one year are generally taxed at long-term capital gains rates. If the company qualifies under Section 1202, or QSBS, investors in certain early-stage U.S. C-corporations may be able to exclude up to 100% of federal capital gains on shares held at least five years.
| Access Route | Typical Minimum | Control | Diversification | Liquidity |
|---|---|---|---|---|
| Angel Syndicates | $1,000–$5,000 | Moderate | Moderate | 5–10 yr lockup |
| Secondary Platforms | $10,000–$50,000 | High (pick the company) | Low (single asset) | Variable |
| Venture Funds | $250,000+ | Low (manager decides) | High (portfolio) | 7–12 yr lockup |
Early paper losses may show up first because fees hit before exits do. That J-curve effect is common in venture structures. And illiquidity isn't a side issue here - it may be a core part of the risk.
If pre-IPO swaps cash flow for upside, private credit tends to do the reverse.
Private credit: yield, fund structures, ordinary-income taxes, and default risk
Private credit flips the model: current income instead of growth. Instead of owning equity, you lend money to companies that may not borrow from banks or may prefer not to. In return, you earn interest and fees.
Yield is the main draw. Private credit funds have returned an average of 9% per year over the last 15 years. As of February 2026, the VanEck BIZD ETF - a proxy for Business Development Companies (BDCs) - posted a 30-day SEC yield of 8.56%. Unlike pre-IPO investing, private credit usually pays monthly or quarterly distributions, so cash flow may arrive along the way instead of waiting for one exit event.
That said, the tax treatment may be less friendly. In the U.S., interest income is generally taxed as ordinary income, not at the lower long-term capital gains rate. Investors in private funds also receive K-1s, and those forms often arrive near or after the April tax deadline. Interval funds issue 1099-DIV forms instead, which may be simpler to deal with.
The main risk is borrower default, along with weak recovery values if things go wrong. Senior secured loans, backed by hard assets or real property, may offer the most protection in the capital stack. But that protection has limits. Covenant quality varies a lot across funds, and in a downturn, even secured lenders may face losses if recovery values come in below expectations.
Liquidity mismatch is another issue. Interval funds like those launched by Hamilton Lane in April 2026 - the HLCIF and HLPIF, each with a $2,500 minimum - offer quarterly redemptions, but those redemptions are typically capped at 5% to 25% of NAV per quarter. So the fund may offer liquidity on paper, while access to cash may still be limited in practice.
| Feature | Private Credit Funds | Interval Funds |
|---|---|---|
| Target Yield | 8%–12% | 8%–11% |
| Typical Minimum | $25,000–$250,000 | $2,500–$25,000 |
| Redemptions | Limited (1–5 yr lockup) | Quarterly (5%–25% NAV cap) |
| Tax Form | K-1 (pass-through) | 1099-DIV |
| Tax Treatment | Ordinary income | Ordinary income |
Private credit may fit investors who care more about income than growth and who want yield with lower volatility than equities. One simple check before putting money into any BDC or private credit fund: read the most recent 10-Q and confirm that distributions are being paid from net investment income, not return of capital. If distributions are coming from return of capital instead of net investment income, that may be a warning sign.
The next section puts all four assets side by side against a stock-and-bond portfolio.
How to Compare Alternatives Against a Stock-and-Bond Portfolio
Looking at each alternative on its own may miss the bigger picture. What tends to matter more is how it fits next to what you already own - and whether the extra fees, lockups, and moving parts may be worth it.
A simple way to compare them is to use the same four filters each time:
- Return driver
- Liquidity
- Tax treatment
- Portfolio role
A side-by-side decision matrix: farmland, art, pre-IPO, and private credit
The table below lines up four alternative assets against public stocks and bonds. These ranges are broad estimates, not guarantees.
| Feature | Public Stocks / Bonds | Farmland | Fine Art | Pre-IPO | Private Credit |
|---|---|---|---|---|---|
| Primary Return | Dividends, interest, growth | Rent + land appreciation | Capital appreciation | Capital appreciation | Interest income |
| Return Driver | Earnings growth / yield | Rent yield + land value | Sale price at exit | Company exit event | Interest + fees |
| Correlation to S&P 500 | Stocks 1.00; bonds low/negative | 0.05–0.15 | 0.05–0.15 | 0.60–0.80 | 0.20–0.40 |
| Liquidity | Daily | 5–10 year hold | 3–10 year hold | 7–12 year lockup | Quarterly redemptions, usually capped |
| Typical Minimum | One share | $5,000–$25,000 | From $20/share; account minimums may apply | $10,000–$250,000+ | $2,500–$25,000+ |
| Fees | 0.05–0.25% | 0.75–1.5% | 1.5% AUM + 20% profit share | 2% + 20% carry | 1–2% |
| Tax Form | 1099 | K-1 (typically) | 1099 or K-1 | K-1 | 1099 or K-1 |
| Tax Rate | Varies by holding | Mixed (rent/LTCG) | 28% (collectibles) | 15–20% (LTCG) | Ordinary income |
| Valuation Transparency | Real-time | Annual appraisal | Subjective/auction | Quarterly model | Quarterly model |
Private assets may look calmer because they are not marked every day. That may hide risk rather than remove it.
It may help to read this table as a fit test, not a winner-take-all ranking. The main tradeoff may not be return alone. It may be whether the asset adds diversification, income, or growth that your core portfolio may lack.
Pre-IPO investing shows a correlation to the S&P 500 of 0.60–0.80, so it may act more like levered small-cap equity than a pure diversifier. Farmland and art sit near 0.05–0.15, which may give them very low correlation to public markets. Private credit falls in between at 0.20–0.40, so it may offer some insulation from equity swings.
Fees matter too. A 2% annual fee may eat into returns over a seven-year lockup. For some investors, that cost may only make sense if the illiquidity premium ends up being large enough to offset it.
Common mistakes to avoid before committing capital
Once the fit looks reasonable, the next step may be avoiding mistakes that are easy to miss.
One common error is using illiquid capital for near-term spending needs. Alternatives may not work as a stand-in for liquidity. Before committing capital to an illiquid position, some investors first confirm they hold at least six months of living expenses in cash, completely outside the alternative allocation. Interval funds may look liquid at first glance, but quarterly redemptions are usually capped at 5–25% of NAV, so exits may not happen when you want them to.
Another issue is the full fee stack. Platform fees, management fees, and performance fees may all pile up over time. The expected illiquidity premium may need to be large enough to justify that drag.
Taxes may trip people up too. Art may face a 28% top federal rate, unlike most public securities. K-1s from private funds often arrive in March or April and may add filing complexity. Neither point has to rule out an investment, but both may belong in the math before comparing net returns with a public portfolio.
Overlap with existing holdings may be the first risk to check. If you already own employer RSUs in a private tech company, adding a pre-IPO fund may increase concentration in that same sector. If your net worth is already tied heavily to a primary residence, adding another real asset may increase that exposure instead of diversifying it. Before adding any alternative, it may help to check what you already own and where the portfolio may already lean.
Conclusion: When Alternatives Belong in a Mezzi-Supported Portfolio

Alternatives may belong in a portfolio only if they may improve the total portfolio after fees, taxes, and lockups. Looking attractive on their own may not be enough. The main question may be whether a position improves the full portfolio.
That means alternatives may make sense only in the context of total portfolio goals, liquidity needs, and existing exposure. The last check may be simple: does this position improve the whole portfolio, not just its standalone return?
These assets may be tough to judge because they often sit in separate accounts and may report on different schedules. Still, the same framework may apply across every alternative covered in this guide: return driver, liquidity, taxes, and portfolio role. Farmland, art, pre-IPO equity, and private credit may all need the same portfolio-level review.
Mezzi is designed to help apply that test across accounts in one view. Through read-only account aggregation, Mezzi's X-Ray feature identifies concentration and overlap across your full portfolio, and surfaces tax-aware guidance, including ordinary-income treatment on private credit and the 28% collectibles rate on art. If an alternative does not improve the full portfolio, it may not belong in it.
FAQs
How much should I allocate to alternatives?
It may depend on your net worth, cash needs, and long-term goals. Some people use broad ranges like these:
- Under $100,000: 0% to 5%
- $100,000 to $500,000: 5% to 10%
- $500,000 to $1,000,000: 10% to 15%
- $1,000,000 to $5,000,000: 15% to 20%
- $5,000,000 and up: 20% to 30%
Core holdings may come first. That’s the main idea.
Why? Alternatives may be less liquid, and some may come with lock-up periods. So any allocation may need to line up with your time horizon, cash flow needs, risk tolerance, and fees.
Which alternative fits income vs. growth goals?
For income, private credit may be a leading choice for some investors because it is designed to provide steady cash flows. Real estate and farmland may also support income goals through regular distributions.
For growth, private equity and venture capital may be better suited in some cases, as they tend to focus on capital appreciation at exit rather than regular payouts.
How do taxes affect net returns?
Taxes may reduce net returns because alternative investments often come with more complicated tax reporting than stocks and bonds.
And that extra complexity may show up in a few places. Tax treatment often changes by asset class. For example, private credit interest may be taxed as ordinary income. Art may face a 28% capital gains rate. And private equity may qualify for long-term capital gains if it’s held for at least three years.
Some deal structures may also bring extra paperwork or added filing needs, including:
- K-1s
- State filings
- Unrelated business taxable income
That’s part of why two investments with similar pre-tax results may look different once taxes enter the picture.
Disclosures:
- This content is for informational purposes only and does not constitute investment advice or a recommendation to buy or sell any security.
- Past performance is not indicative of future results. No guarantee of future performance or outcomes is implied.
- Savings and performance examples are hypothetical and for illustrative purposes only. Actual results will vary based on individual circumstances, portfolio composition, market conditions, and fees.
Related Blog Posts
Table of Contents
Book Free Consultation
Walk through Mezzi with our team, review your current situation, and ask any questions you may have.