
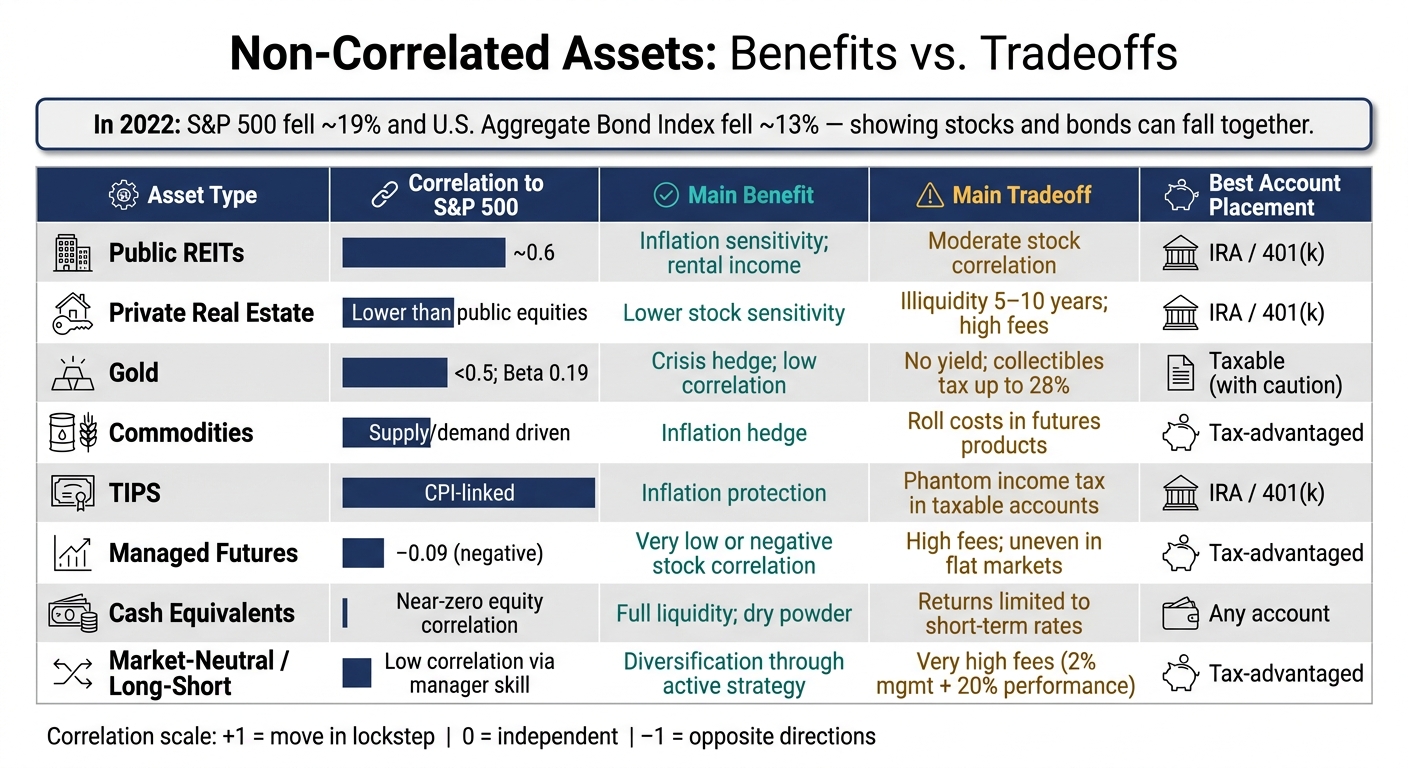
Owning more funds may not mean you’re diversified. In 2022, the S&P 500 fell about 19% and the Bloomberg U.S. Aggregate Bond Index fell about 13%, which may show that stocks and bonds sometimes react to the same pressure at the same time.
Here’s the short version:
- Non-correlated assets may not move with stocks and bonds in the same way
- They may add different return drivers, like inflation linkage, lease income, supply/demand, or trend-following
- They may also bring tradeoffs like tax drag, fees, lockups, and uneven performance
- What looks diversified across a 401(k), IRA, Roth IRA, taxable account, and cash may still be the same stock or rate exposure repeated
- Some investors review correlation, overlap, account placement, drift, and stress-period behavior instead of just counting holdings
If I were summarizing the whole topic in one line, it would be this: diversification beyond stocks and bonds may be less about owning “alternatives” and more about owning assets that may respond to different market forces.
A few examples from the article:
- Public REITs may add real estate exposure, but they may still track stocks more than many people expect
- Private real estate may lower public-market sensitivity, but money may be tied up for 5 to 10 years
- Gold may behave differently in crises, but it produces no yield
- Commodities may react to inflation, though futures funds may carry roll costs
- TIPS may track CPI, but taxable accounts may create annual tax on inflation adjustments
- Managed futures may show low or slightly negative stock correlation, but fees may be high
- Cash equivalents may offer liquidity and near-zero stock correlation, though returns may stay tied to short-term rates
- Market-neutral or long-short funds may target low correlation, but fee loads may be heavy
Quick Comparison
| Asset type | What it may add | Main tradeoff |
|---|---|---|
| Public REITs | Real estate income; some inflation linkage | May still move with stocks |
| Private real estate | Lower public equity sensitivity | Illiquidity; fees |
| Gold | Crisis hedge; lower stock linkage | No income; tax issues |
| Commodities | Inflation-linked exposure | Roll costs; volatility |
| TIPS | CPI-linked bond exposure | Tax drag in taxable accounts |
| Managed futures | Low or negative stock correlation | Higher fees; uneven returns |
| Cash equivalents | Liquidity; low stock linkage | Lower return ceiling |
| Market-neutral / long-short | Low correlation target | High fees; manager risk |
The main takeaway may be simple: before adding a new asset, it may help to check what you already own, what risks drive it, where it sits for taxes, and whether it still acts differently when markets get stressed.
Understand correlation and diagnose your current portfolio
Correlation measures how closely two investments may move in relation to each other. It runs on a scale from -1 to +1: a score of +1 means two assets may move in lockstep, 0 means they may move independently, and -1 means they may move in exactly opposite directions. For diversification, low or negative correlation may matter more than simply owning more funds or line items. That’s why correlation may matter more than the number of holdings.
A 60/40 portfolio is not fixed; stock-bond correlation changes over time. Stocks and bonds were negatively correlated in the 2000s, then turned strongly positive in 2022 when rate hikes hit both. When two assets share the same macro vulnerability, owning both may not reduce risk. It may just spread that risk across two labels.
Tell apart uncorrelated, low-risk, and volatile assets
Low risk and non-correlation are not the same thing. What matters is the return driver: the force tied to returns.
Investment-grade bonds may carry relatively low volatility, but their returns may still be sensitive to interest rate policy. Private equity may look different from public stocks on paper, but research suggests it carries an equity beta of roughly 0.80, which may mean it tracks the stock market more closely than many investors expect. Gold, by contrast, has a beta of just 0.19 versus the S&P 500 - its price may respond more to real interest rates and currency dynamics than to corporate earnings. Managed futures, represented by the DBMF ETF, have shown a negative beta of -0.09 relative to the S&P 500, which may mean they tend to move independently or slightly opposite to equities. If an asset’s return depends on the same forces that may hit stocks or bonds, it may be the same risk in a different wrapper.
Map holdings across 401(k), IRA, Roth IRA, taxable, and cash accounts
Most investors may not have a diversification problem - they may have a visibility problem. A common hidden concentration may be the same S&P 500 exposure showing up in a workplace 401(k), a Roth IRA, and a taxable brokerage account.
Gather every account into one view and look for overlapping stock and bond exposures across ETFs, mutual funds, and individual positions. Some investors treat any single position or concentrated cluster above 20% of household assets as a concentration risk. The goal isn’t to count how many funds you own - it’s to understand how much of your portfolio may be driven by the same factors.
Use Mezzi to check overlap and correlation across all accounts

Doing this manually across multiple accounts may be tedious and error-prone. Mezzi's read-only aggregation and X-Ray overlap view show household exposure and duplicated holdings in one place.
Once you know where the overlap may be, compare diversifiers by the risks they hedge, the liquidity they require, and the taxes they create.
Compare non-correlated and lower-correlation asset types
Non-Correlated Assets: Benefits vs. Tradeoffs at a Glance
Once you know where your overlap sits, the next step is figuring out what each diversifier actually does - and why it may or may not make sense in your portfolio. A diversifier only helps if it offsets a real concentration. So it may help to look at each option through three lenses: what risk it may offset, how liquid it may be, and where it may fit across your accounts.
Real estate, commodities, gold, and TIPS
Public REITs trade on exchanges, so they tend to offer high liquidity and low-to-moderate fees. Their returns are tied to rental income and property values, and they may add some inflation sensitivity. The catch: REITs still tend to move somewhat closely with stocks. Their correlation with the S&P 500 is about 0.6. And because REIT dividends are often taxed as ordinary income, they may fit better in a tax-advantaged account like an IRA or 401(k).
Private real estate may reduce stock sensitivity, but the tradeoff may be illiquidity and higher fees. For investors with a long time horizon, lock-up periods of about 5 to 10 years may be the main constraint .
Gold behaves differently from many other assets. It is often used as a crisis hedge and has historically had a correlation of less than 0.5 with the stock market. It does not produce yield, and in taxable accounts it may be taxed at the collectibles rate, which may be as high as 28%.
Broad commodity funds are driven by global supply and demand, so they may help during inflationary periods. But futures-based products come with roll costs. When a fund rolls contracts into higher-priced futures, it may underperform the spot price of the underlying commodity. TIPS are designed to protect against inflation because principal rises with CPI, but taxable accounts may owe annual tax on that adjustment .
Cash equivalents, managed futures, and hedged strategies
Treasury bills and money market funds have near-zero correlation to equities by design. They may provide immediate liquidity and dry powder for future opportunities.
Managed futures are trend-following strategies that may span currencies, commodities, rates, and equities, and they often have low or negative correlation to stocks. The tradeoff may be higher fees, and returns may be uneven in flat markets. Market-neutral and long-short strategies also aim for low correlation through manager skill, but they often come with hedge-fund-style fees near 2% management and 20% performance fees .
The table below condenses the tradeoffs.
| Asset Type | Main Benefit | Main Tradeoff |
|---|---|---|
| Public REITs | Inflation sensitivity; rental income | Moderate stock correlation (~0.6) |
| Private Real Estate | Lower stock sensitivity | Illiquidity; high fees |
| Gold | Crisis hedge; low correlation (<0.5) | No yield; collectibles tax rate |
| Commodities | Inflation hedge; supply/demand driver | Roll costs in futures-based products |
| TIPS | CPI-linked inflation protection | Phantom income tax in taxable accounts |
| Managed Futures | Very low or negative stock correlation | High fees; uneven in flat markets |
| Cash Equivalents | Near-zero equity correlation; full liquidity | Returns limited to short-term rates |
| Market-neutral / long-short strategies | Low correlation through manager skill | Very high fees (2 & 20) |
This summary may help narrow the field to the few diversifiers that match your portfolio gaps. The goal is not to own a little bit of everything. It may be more useful to match each asset type to the risk it may offset, the liquidity it may require, and the tax cost it may create.
Build a diversified allocation step by step
After you map overlap and compare asset types, the next move may be allocation. At this stage, each diversifier may need a clear role, the right account, and a target size.
Match each diversifier to your goal, liquidity need, and risk tolerance
A diversifier may work best when it fills a specific portfolio gap. One asset may be there for inflation defense, another for liquidity, and another for crisis protection.
Many investors start with liquid, listed diversifiers before making private commitments that may lock up capital for 5 to 10 years. A common rule of thumb suggests keeping alternative diversifiers somewhere in the 5% to 20% range of the total portfolio, depending on risk tolerance and time horizon.
Place assets in the right accounts for taxes and simplicity
Once each diversifier has a job, the next step may be putting it in the most tax-aware account. A common approach is to place tax-inefficient holdings in tax-advantaged accounts and tax-efficient holdings in taxable accounts.
For example, REIT dividends are typically taxed as ordinary income, so a traditional IRA or 401(k) may be a more efficient home than a taxable account.
Futures-based commodity ETFs follow a 60/40 blended tax rate on gains, with 60% treated as long-term and 40% as short-term. That may be worth weighing before deciding where to hold them. And if a substantially identical position is bought in an IRA within 30 days of a taxable sale, the loss may be disallowed.
Use Mezzi for tax-aware allocation and rebalancing guidance
A household view may be the only practical way to manage placement and rebalancing across accounts. Mezzi connects your accounts through read-only access and analyzes the full picture, not just what sits in one account.
More specifically, Mezzi may:
- flag inefficient asset location
- identify concentration risks that may be hard to spot when accounts are viewed separately
- surface wash sale exposure before it is triggered
For example, it may point out that a REIT ETF sits in a taxable account even though IRA space is available. If Mezzi identifies a tax-loss harvesting opportunity and a sale is made, it will notify you when the 30-day wash sale window has passed so the position may be re-established. Mezzi is read-only: it flags the issue, and you decide whether to trade.
Monitor correlation over time and adjust with clear rules
Diversification may be an ongoing process, not a one-time setup. Correlations may shift, market regimes may change, and new purchases may quietly rebuild the same stock exposure you meant to trim. Once diversifiers are in place, the next step may be checking whether they still behave like diversifiers.
Track drift, stress-period behavior, and hidden concentration
Look at the full household portfolio, not one account at a time. Overlap across accounts may create hidden concentration that doesn't show up when each account is reviewed on its own.
It may also help to test diversifiers during stress periods, not just through long-run averages. The periods from 2008, March 2020, and 2022 may offer a more useful read on how assets behave when markets are under pressure. A strong equity run may push a 60/40 portfolio closer to 75/25. Some investors set rules to flag any asset class that drifts more than 5% from target or grows beyond 20% of the portfolio.
When new diversifiers are added, it may make sense to map them to their main return drivers, such as:
- inflation linkage
- illiquidity premium
- event risk
That step may help show whether the holding adds something different or simply repackages the same equity exposure. A private equity fund layered on top of a growth-heavy stock portfolio may add less diversification than it first appears to.
Set a review cadence and keep the process rules-based
Those thresholds may also serve as a trigger for rebalancing, instead of reacting to every market move.
Some investors review quarterly and rebalance only when drift breaks a preset rule. They may also do a deeper annual review after major market moves or life changes . In some cases, rebalancing starts in tax-advantaged accounts first, then moves to taxable accounts.
Life changes may matter just as much as market changes. A shift in time horizon, liquidity needs, risk tolerance, or tax rules may all justify a new review of the strategy . Writing down the original reason for each non-correlated holding may make later decisions easier. It may help you judge whether the position still belongs, instead of making changes based on short-term volatility.
FAQs
How do I know if I’m actually diversified?
Diversification may be less about how many holdings sit in your account and more about whether those holdings tend to move in different ways across market cycles.
A simple place to look: correlation coefficients.
A value near 1.0 may suggest that assets often move together. Values near 0 or into negative territory may point to lower correlation, which some investors use as one way to judge whether holdings behave differently.
Tools like Portfolio Visualizer or other correlation calculators may help you compare your holdings against a benchmark like the S&P 500.
Which non-correlated assets are best for a taxable account?
For a taxable account, it may make sense to lean toward tax efficiency and simplicity. Publicly traded vehicles like ETFs may be one of the easiest fits because they offer transparency, daily liquidity, and standardized tax reporting.
REITs and gold or commodity ETFs may offer liquid exposure to real assets without the added complexity of direct ownership or private funds. Private, illiquid alternatives may involve more complex tax forms.
How much of my portfolio should go beyond stocks and bonds?
There’s no universal target, but a common starting point may be 5% to 20% in assets outside stocks and bonds.
A common framework may be to keep 70% to 90% in stocks and bonds and 10% to 30% in alternatives. The right mix may depend on your risk tolerance, liquidity needs, and time horizon. Many newer investors may start closer to 5%, while others may go higher based on their goals.
Related Blog Posts
Table of Contents
Book Free Consultation
Walk through Mezzi with our team, review your current situation, and ask any questions you may have.