
One number may mislead you. In 2022, the average U.S. household net worth was about $1,063,700, but the median was only $192,900. That gap may exist because a small share of households hold a large share of total wealth.
Here’s the short version:
- Net worth may be your assets minus your debts.
- Median net worth by age may be more useful than the average.
- Age benchmarks may give context, but they may miss income, city, family size, debt mix, and home equity access.
- A better check may pair age-based medians with income-based savings targets and a look at investable assets.
- If you seem behind, the next step may be simple: look at savings rate, high-APR debt, and where your money sits across taxable, tax-deferred, and Roth accounts.
A fast age snapshot:
- Under 35: median about $39,000
- 35–44: median about $135,600
- 45–54: median about $247,200
- 55–64: median about $336,100
- 65–74: median about $409,400
- 75+: median about $335,600
Average Net Worth By Age (2026): Are You Ahead or Behind?
Quick comparison
| Measure | What it may tell you | Where it may fall short |
|---|---|---|
| Average net worth | A top-line number | Pulled up by high-wealth households |
| Median net worth | A more typical midpoint | Still ignores your income and local costs |
| Income multiple | Whether savings may match your pay | Less useful for late starters or uneven income |
| Investable assets | Money that may be easier to use for retirement | Leaves out home equity |
So if you’re asking, “Am I on track?” the short answer may be: compare yourself to the median, not the mean - then check that number against your income, debt, and goals. That may give you a cleaner read than a headline stat alone.
How net worth benchmarks are calculated in the United States
The data source and why numbers differ across articles
Most net worth benchmarks in the U.S. come from one place: the Federal Reserve's Survey of Consumer Finances (SCF). The Fed runs this survey every three years and includes about 4,600 U.S. households. It gathers detailed data on assets, debts, income, and demographics. The most recent published results cover 2022.
That three-year gap may explain why numbers look different from one article to another. Some outlets use the raw 2022 SCF figures. Others apply an inflation adjustment to 2026 dollars to estimate what those same numbers may look like in 2026 dollars.
There’s another reason for the mismatch: age brackets aren’t always the same. One publisher may group ages differently than another, even when both are using the SCF. On top of that, mean net worth remains much higher than median net worth, because a large share of wealth sits near the top. So the same dataset may lead to very different-looking benchmarks by age.
| Age Group | Median Net Worth (2022 SCF) | Mean Net Worth (2022 SCF) | 2026 Reference (CPI-Adjusted) |
|---|---|---|---|
| Under 35 | $39,000 | $183,500 | ~$44,000 |
| 35–44 | $135,600 | $549,600 | ~$152,000 |
| 45–54 | $247,200 | $975,800 | ~$277,000 |
| 55–64 | $336,100 | $1,570,000 | ~$460,000 |
| 65–74 | $409,400 | $1,790,000 | ~$461,000 |
| 75+ | $335,600 | $1,624,100 | ~$378,000 |
Sources: Federal Reserve 2022 Survey of Consumer Finances; CPI-adjusted 2026 estimates.
What these benchmarks leave out
The SCF is rigorous, but it also has blind spots.
First, it measures household wealth, not individual wealth. The age tied to each entry comes from the survey’s primary respondent. So a dual-income couple in their 40s and a single earner of the same age may end up compared with the same benchmark. That may blur meaningful differences.
National numbers also leave out geography. A net worth of $500,000 may go a lot further in Boise than in Boston. These benchmarks don’t adjust for local cost of living, family size, or whether someone received an inheritance.
They also treat all assets the same, even when access is very different. For example, $300,000 in a brokerage account may be much easier to use than $300,000 tied up in home equity, but both count the same in the data.
One more gap: the SCF excludes the economic value of Social Security entitlements. That may matter most when comparing retirees or people close to retirement with these benchmarks.
These numbers may be more useful when viewed alongside an actual balance sheet, rather than as a score on their own. With those limits in mind, the next section shows the age benchmarks themselves.
Average and median net worth by age group in 2026
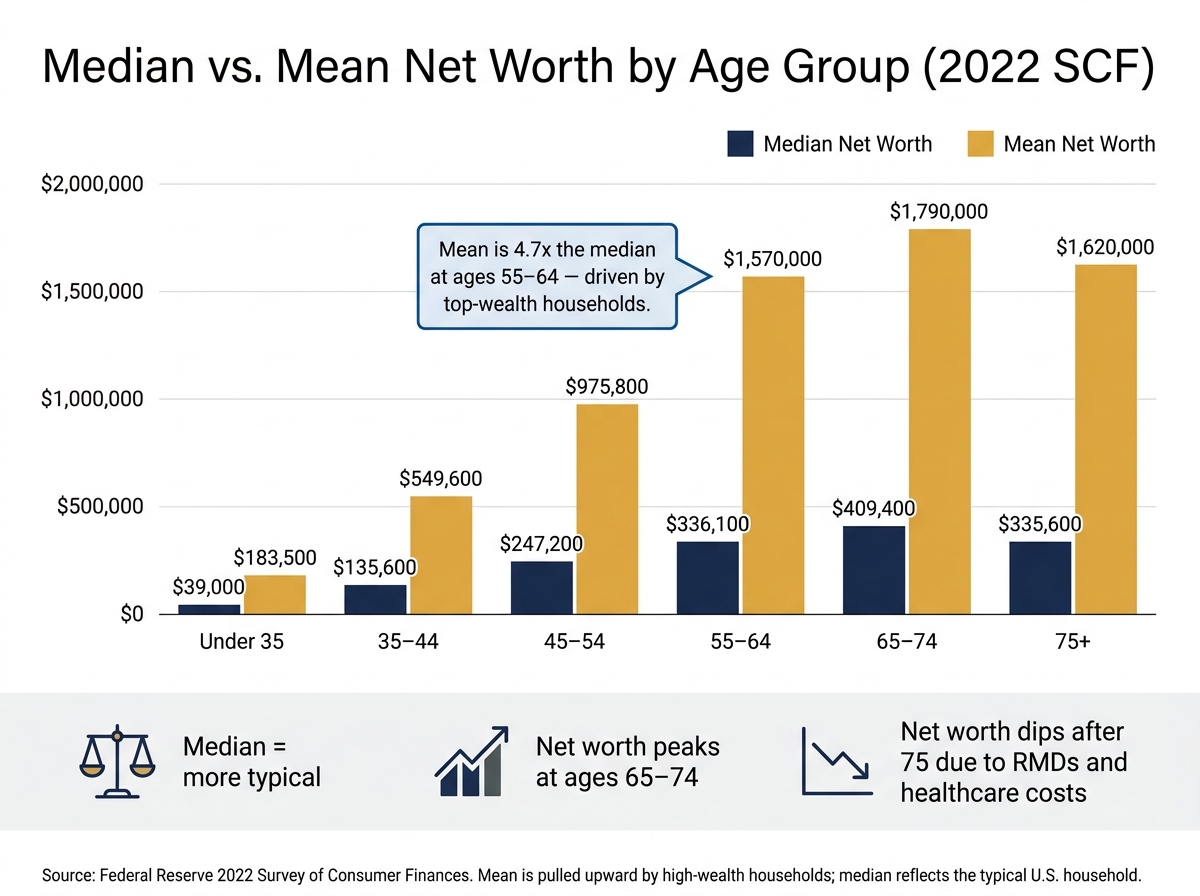
Median vs. Mean Net Worth by Age Group (2022 SCF)
Using the 2026 reference benchmarks, here’s what each age group may look like. These figures work better as comparison points, not goals to chase.
Under 35 and 35–44: early accumulation and debt drag
For households under 35, the median net worth sits around $39,000, while the mean comes in at $183,500. That gap may look big, and it usually reflects how a smaller group with much higher balances pulls the average up.
In the early years, student loans and entry-level pay may keep net worth lower. Even so, fairly modest savings may put someone above the national median for this age band.
By ages 35 to 44, the median climbs to $135,600 and the mean reaches $549,600. At that stage, higher income and early compounding may start to push balances up, even while mortgage payments and family costs may still weigh on savings.
Ages 45 to 64: peak earning years and retirement prep
By midcareer, the spread gets much larger. For ages 45 to 54, the median net worth reaches $247,200, while the mean rises to $975,800. That difference may be tied to things like saving rate, when someone started investing, and how much home equity they’ve built.
The 55 to 64 group shows an even bigger gap. The median is $336,100 and the mean is $1,570,000. In other words, the average may look high, but many households in this range may sit far below it.
In 2026, workers age 50 and older may contribute an extra $8,000 to 401(k) and 403(b) plans, and those ages 60 to 63 may put in as much as $11,250 in added workplace plan contributions. For households that may be behind, that catch-up window may matter.
Ages 65 and older: why net worth often peaks then declines
As retirement begins, net worth tends to peak in the 65 to 74 group. The median reaches $409,400 and the mean rises to $1,790,000.
After that, the numbers move down. By age 75 and older, the median falls to $335,600 and the mean to $1,620,000. That change may be linked to retirement spending and health care costs. RMDs now begin at age 73, which means annual withdrawals from tax-deferred accounts are required.
| Age Group | Median Net Worth | Mean Net Worth | Key Drivers |
|---|---|---|---|
| Under 35 | $39,000 | $183,500 | Student debt, early career, limited compounding |
| 35–44 | $135,600 | $549,600 | Mortgage debt, rising income, peak family costs |
| 45–54 | $247,200 | $975,800 | Peak earnings, home equity, compounding |
| 55–64 | $336,100 | $1,570,000 | Catch-up contributions, retirement prep |
| 65–74 | $409,400 | $1,790,000 | Asset peak, retirement transition |
| 75 and older | $335,600 | $1,620,000 | RMDs, healthcare costs, asset drawdown |
Sources: Federal Reserve 2022 SCF; CPI-adjusted 2026 estimates.
How to tell whether you are ahead, behind, or on track
Now that you have the benchmarks, the next step may be to compare them with your own balance sheet.
When age-based averages help and when they mislead
Age-based benchmarks may work well as a directional check. They offer a quick way to see whether your progress may be on track. But they may get less useful when your situation looks very different from the national household profile.
A physician finishing residency at 32, for example, may still have a low net worth early on due to education debt and delayed earning power. That alone may not mean they're off track. The median net worth for households under 35 is about $39,000, and some late-start careers may catch up over time.
Net worth depends on where your money sits, not just how much you earn. A better test may be whether your net worth lines up with your income, savings rate, and investable assets.
If the age number feels off, it may make sense to check whether your savings are keeping pace with your income.
A better framework: median net worth paired with income-based savings targets
Using two checks may give you a clearer read: age-based median net worth and income-based savings targets. The median shows where you may stand relative to peers. The income multiple shows whether your savings may be proportional to your own lifestyle and spending needs.
A widely used set of savings milestones - sometimes called the Fidelity guideline - suggests roughly 1x your annual income saved by 30, 3x by 40, 6x by 50, 8x by 60, and 10x by 67.
It may also help to separate investable assets from total net worth. Home equity counts toward net worth, but it may not fund monthly retirement expenses unless the home is sold or borrowed against.
| Benchmark Type | Use | Limit |
|---|---|---|
| Age-Based Median | Quick check against peers | Ignores cost of living, debt composition, and career timing |
| Income Multiples | Ties savings goals to your pay and lifestyle | Harder to apply for late-career starters or high-debt graduates |
| Investable Assets Only | Helps assess retirement readiness | Excludes home equity and other illiquid wealth |
| Percentile Comparison | Creates stretch goals | Top percentiles include outliers and may feel discouraging |
For context on where you might fall, the 75th percentile for ages 35 to 44 is $370,000, and the 90th percentile is $888,000. If you're above the median but want a clearer target, moving toward the 75th percentile for your age group may offer a concrete, measurable goal.
How Mezzi personalizes the benchmark using your real accounts

This is where a personal balance-sheet view may matter more than a national average.
When you connect your accounts - 401(k)s, IRAs, brokerage accounts, and mortgages - Mezzi builds a full net worth snapshot through read-only access. It lets you see the difference between cash and investments versus home equity and retirement accounts.
Mezzi's X-Ray feature surfaces concentration risk and overlapping holdings across your connected accounts - something that's easy to miss when each account is viewed on its own. From there, Mezzi may connect your current net worth picture to retirement projections, Roth conversion timing, and allocation decisions based on your actual holdings. Mezzi shows the gap; you decide the next move.
Turn the comparison into better financial goals
Use benchmark gaps to set clearer savings, investing, and debt targets
Once you know whether you're ahead or behind, use that gap to decide on the next move. For some people, that may mean saving more. For others, it may mean paying down high-rate debt or putting more money into investments. If your net worth falls below the directional band for your age group, the two fastest levers may be your savings rate and high-interest debt.
A 15% savings rate may be a workable floor, while 20% to 30% may speed up wealth accumulation for some households. If you carry credit card debt above 12% to 15% APR, paying it down first may make sense in some cases; a 20% APR balance may be viewed as the same as earning a guaranteed 20% return. After debt, the next move for some savers may be higher tax-advantaged contributions.
In 2026, eligible employees may contribute up to $24,500 to a 401(k) or 403(b), plus an $8,000 catch-up at age 50+ and an $11,250 catch-up at ages 60 to 63. For people with an employer match, getting the full match first may be a common starting point, then automating the rest may help keep contributions steady.
Build after-tax net worth through smarter account and tax decisions
After the amount, focus on where the money sits. After-tax net worth may improve when assets are placed in the right accounts, whether that's tax-deferred, Roth, or taxable.
Conclusion: Use the benchmark as context, then plan from your real balance sheet
The median net worth for your age group may be a useful starting point, not a finish line. The gap may be more useful when it leads to one concrete action: a higher savings rate, less high-APR debt, or more tax-aware account placement. If your net worth looks behind due to student loans, a recent home purchase, irregular income, or a late start, it may help to focus on trajectory instead of a single snapshot: keep saving automatically, build an accessible cash floor, and use catch-up contributions when possible.
FAQs
Should I compare myself to median net worth or average net worth?
Compare yourself to median net worth instead of average net worth. The median may give a better picture of a typical financial situation because it’s less affected by ultra-wealthy households, which may pull the average much higher.
For example, among Americans under 35, the median net worth is about $39,000, while the average is about $183,000. For many people, the median may be the more useful benchmark.
Does home equity count when judging retirement readiness?
Yes. Home equity may be included when judging retirement readiness because it may make up a large share of household net worth for homeowners.
What should I do first if my net worth is below my age benchmark?
First, put your attention on the drivers of your net worth, not the comparison itself. Review your assets and liabilities, then set priorities around:
- increasing your savings rate
- paying off high-interest debt
- investing consistently in diversified assets
Track your progress monthly or quarterly, and try to avoid lifestyle creep. Small, steady moves may improve your financial position over time.
Related Blog Posts
Table of Contents
Book Free Consultation
Walk through Mezzi with our team, review your current situation, and ask any questions you may have.