
Private credit may offer more income than many public bond funds - but that extra yield may come with lower liquidity, less-clear pricing, credit risk, leverage, fees, and ordinary-income taxes.
If I were sizing it up in plain English, I’d put it like this: private credit may fit as a small income sleeve, not as a full bond replacement. Recent yields for some direct lending vehicles have landed around 10% to 12%, while many public investment-grade bonds have been in the mid-single digits. But once I factor in defaults, fund fees, leverage, redemption limits, and taxes, the gap may look smaller than the headline number suggests.
Here’s the short version:
- What it is: Private loans made outside public markets, often to middle-market companies
- Why income looks high: Floating-rate coupons, spreads over SOFR, fees, and loan terms
- Main tradeoff: Higher yield may come with 5–10 year lockups, quarterly gates, or share-price swings
- Main risks: Credit losses, soft covenants, fund leverage, model-based valuations, and manager selection
- Tax point: Most payouts may be taxed as ordinary income, which may reduce after-tax results in taxable accounts
- Where it may fit: More as a satellite position, often around 5% to 15% for some investors, depending on time horizon and liquidity needs
- How access differs: Private funds, listed BDCs, non-traded BDCs, and interval funds each come with a different mix of liquidity, fees, and pricing clarity
Private Credit Explained: Why It’s Booming (And What Could Go Wrong)
Quick Comparison
So the big question may not be “Does private credit pay more?”
It may be “Does the extra yield make up for the lack of liquidity, higher complexity, and manager risk?”
How private credit generates yield and how it compares to public markets
Yield drivers, floating rates, and realized income
Private credit income may come from a few sources that stack on top of each other. The biggest piece is usually the floating-rate coupon. That often means a benchmark such as SOFR, plus a fixed credit spread. BIS research puts private credit loan spreads at about 630 basis points over SOFR, which is roughly 300 basis points more than broadly syndicated leveraged loans.
Lenders may also collect origination fees, OID, and call protection, which may lift effective yield. Mezzanine loans may include equity kickers, such as warrants.
Many loans also have interest rate floors. These set a minimum base rate, so income may not fall all the way if rates drop. Even so, lower rates may still reduce distributions. Borrowers may also refinance earlier, which may push funds to redeploy capital at lower spreads.
That yield may come from spread, fees, and structure. But those same features may also be tied to the main risks.
Headline yield may overstate net return. Defaults, restructurings, and lower-than-expected recoveries may chip away at what first looked like an appealing coupon. Then there are fund costs: management fees of about 1% to 1.5% per year, plus 15% to 20% carried interest above a preferred return hurdle. After all of that, net return may end up much closer to public market benchmarks than the headline yield suggests.
The basic math looks like this:
net return ≈ yield + fee income − defaults − fund costs
Private credit versus investment-grade bonds, high-yield, and private equity
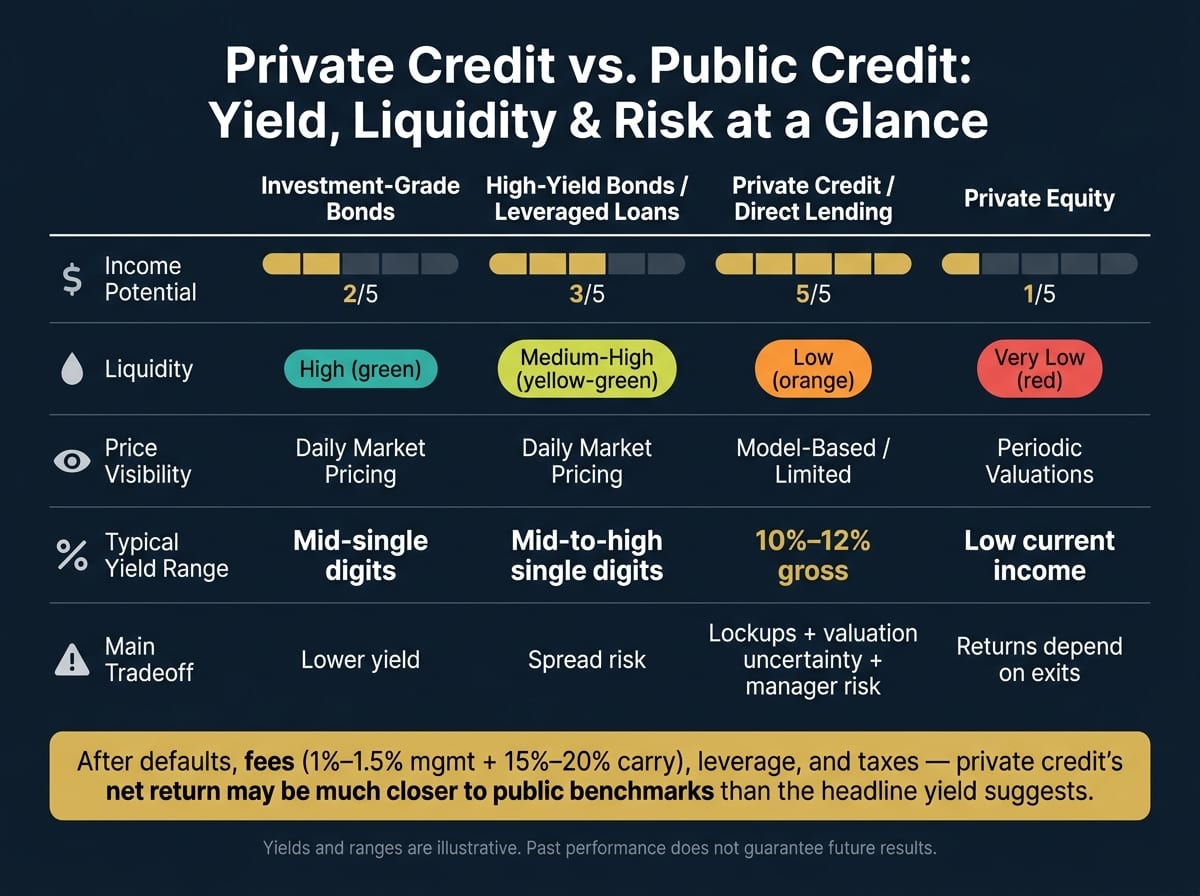
The table below shows where private credit may sit next to public credit and private equity.
Private credit may offer more current income than investment-grade bonds. It may also offer yield that is in line with, or above, public high-yield. At the same time, it may rely far less on capital appreciation than private equity. The trade-off is pretty clear: liquidity may be much lower, and price transparency may be weaker than in public markets.
Lower reported volatility may mainly reflect less frequent marks, not lower economic risk.
Taxes and account location for U.S. investors
Most private credit distributions are taxed as ordinary income. In a taxable account, that may reduce after-tax yield by a lot. For investors in higher tax brackets, ordinary-income treatment may cut after-tax yield in a material way.
Account location may matter. Holding private credit in a traditional IRA, Roth IRA, or 401(k) may shelter the interest income from annual taxation, which may let it compound without the yearly drag of ordinary-income tax rates. Because of that, ordinary-income treatment may make private credit look much less appealing in taxable accounts than the headline yield suggests.
After-tax yield is only one part of the picture. Liquidity, defaults, and manager skill may play a large role in whether that income holds up in practice. Yield advantages may matter only if credit losses, leverage, and illiquidity remain contained.
Risks that can erase the yield advantage
Illiquidity, redemption limits, and valuation opacity
Private direct lending funds are usually closed-end vehicles that call capital over time. That setup may tie up capital for roughly 5–10 years. Distributions usually come back as loans are repaid, not whenever an investor wants cash. So if life changes - say an emergency comes up or retirement happens earlier than expected - you may not have a simple way to exit.
Illiquidity is only one part of the issue. Private credit may also be harder to value in the moment. Some vehicles are marketed as semi-liquid, such as interval funds and non-traded BDCs, but they still tend to use scheduled, limited redemptions. Those windows are often quarterly and may be capped at a small share of NAV per window, sometimes around 5%. If redemption requests go past that cap, investors may be filled pro rata, and the balance may roll into later windows. During stress periods, boards may also restrict or suspend redemptions entirely, even if the fund keeps paying distributions and showing fairly smooth NAVs.
That smooth NAV may not tell the full story. Private credit loans rarely trade, so managers often rely on model-based valuations based on internal assumptions, occasional appraisals, and borrower financials instead of live market prices. One large non-traded BDC reported 89% of its assets classified as Level 3, which means most positions were valued with models and projections rather than observable market data. The IMF has warned that stale valuations in private credit may hide rising risk until a restructuring or default forces a sudden repricing.
Once liquidity and pricing become less clear, the next issue may be the loans themselves - and the leverage wrapped around them.
Credit, leverage, and manager risk
Borrower-level risk may chip away at the income story. Many middle-market borrowers in private credit carry high debt-to-EBITDA ratios. Federal Reserve analysis found that interest coverage ratios for private credit borrowers were meaningfully lower than for broadly syndicated loan borrowers, where interest coverage ratios averaged around 2.7x as of 2023. Thin coverage may leave less room if earnings soften and debt service gets harder.
Covenant quality may add another layer of risk. The rise of covenant-lite structures in private credit may reduce a lender's ability to step in early when a borrower's performance weakens. Research associates weaker covenants with higher default probabilities and lower recovery rates in downturns. J.P. Morgan Private Bank lays out a simple example: a private credit strategy yielding 9% gross with a 2% annual default rate and 30% recovery may end up at only about 7% net total return after defaults. The headline yield and the final result may be pretty far apart.
Then there is fund-level leverage. The fund itself may borrow through credit facilities or notes while also lending to borrowers that may already be leveraged. A fund using 30%–50% leverage may magnify gains and losses. If borrower defaults or markdowns reduce NAV, the debt does not disappear. That may turn a moderate credit event into a larger hit for equity investors. Sharp markdowns may also trigger covenant breaches in the fund's own borrowing arrangements, which may force asset sales at a bad time.
Manager quality may matter as much as, or more than, the stated yield. Weak underwriting, high fees, or payment-in-kind interest - where cash interest is deferred and added to the loan balance - may make a higher coupon less meaningful.
How risks differ across direct lending funds, BDCs, and interval funds
The same broad risks may show up in different ways depending on the vehicle. Listed BDCs offer daily pricing, but they may come with more market-driven volatility. Share prices may swing with sentiment and may trade at discounts or premiums to NAV. Private direct lending funds do not offer that kind of live price signal, so investors may rely heavily on quarterly manager reports and internal valuations. Interval funds sit somewhere in the middle, with periodic redemption windows and more frequent reporting than private funds, but still no live market pricing.
The table below shows how those risks may stack up across the four main vehicle types.
These differences may matter because each vehicle comes with a different mix of liquidity, transparency, and price risk. Some investors track total exposure across accounts and managers so private credit does not turn into an accidental concentration.
How to access private credit and where it fits in a portfolio
Direct lending funds, BDCs, and interval funds explained
The wrapper you use may shape access, fees, and liquidity. It changes how you get exposure, but it does not remove the basic tradeoff between yield and liquidity.
Here’s the big distinction: interval fund repurchases are mandatory by regulation, while non-traded BDC repurchase programs are discretionary. In plain English, the board may reduce or suspend non-traded BDC repurchases. That difference may matter most when markets get shaky and redemption requests start piling up.
Because of that, the wrapper may affect whether private credit belongs in a core income sleeve or whether it may make more sense as a small satellite allocation.
How private credit fits alongside bonds, public credit, and private equity
These wrappers do not change the underlying credit risk. They mainly determine how much liquidity you may give up for the income stream.
Private credit may fit better as a satellite allocation than as a core bond substitute. Where it may add something is in the income layer: lending to smaller, less-followed borrowers and accepting illiquidity in return. Common portfolio ranges run about 5%–15% of total assets, depending on income needs and tolerance for lockups.
The table below is a rough framework, not a recommendation, for how that range might look across investor profiles.
The right weight may depend less on headline yield and more on a simple question: how much illiquidity may you hold through a full market cycle?
Liquidity planning, retirement timing, and tax-aware placement
Once the allocation looks reasonable, the next question may be whether your cash needs and account type line up with the vehicle.
Do not treat private credit like a bond fund you may sell on demand. A direct lending fund with a 7–10 year lockup, or an interval fund that only allows redemptions during scheduled quarterly windows, may not help with an unexpected expense or a home purchase next year. Some investors map out known cash needs first and then make sure liquid assets cover them before adding less-liquid credit exposure.
Retirement timing adds another layer. If retirement may happen in five years, a 10-year private credit lockup may outlast the accumulation window. Semi-liquid vehicles such as interval funds or listed BDCs may fit better only when the lockup matches the investor’s timeline.
Ordinary-income treatment may make tax-advantaged accounts a cleaner home for private credit. Holding high-yield private credit in a taxable account may create tax drag, especially for investors in higher brackets.
How to decide if private credit fits your portfolio
A due-diligence checklist for evaluating private credit
Once you know the risks, the next step is to test whether the income may hold up over time. This checklist ties back to the same issues from the prior section: underwriting quality, leverage, and redemption terms.
- Loan quality and borrower protection: Check whether the fund focuses on senior secured first-lien loans, mezzanine, or opportunistic credit. Review debt-to-EBITDA ratios, interest coverage, covenant discipline, and watchlist size and trends. Covenant-lite structures may offer less protection in a downturn.
- Borrower diversification: If any single borrower exceeds 5% of NAV, or any single industry exceeds 20% of NAV, concentration risk may deserve a closer look.
- Sector exposure: Review exposure to cyclical sectors versus more resilient areas. Sector tilts may need to line up with your risk tolerance.
- Credit performance and mark quality: Ask for gross default and recovery rates by year, including stressed periods. CDLI’s roughly 1% annual default loss rate may serve as a rough benchmark for diversified direct lending. It also may help to ask how the fund handled valuations during past stress periods and whether third-party marks are used.
- Team stability: Look for multi-cycle experience, low turnover, and clear key-person provisions in the fund documents.
- Fee structure: Model how a 1% management fee plus a 10% to 15% performance fee over a preferred return structure may affect net return under realistic scenarios, not just the base case.
- Fund leverage: Higher debt-to-equity ratios may amplify both income and losses. Yield driven mainly by leverage may carry more risk than yield driven by underwriting quality.
- Redemption terms: Confirm lockup length, notice periods, redemption frequency, and any gates or repurchase limits. These terms may matter most when markets are under stress.
For funds older than five years, request DPI and TVPI to separate cash returned from unrealized gains.
Matching vehicle choice to investor profile
Vehicle choice may follow your liquidity needs, tax bracket, and time horizon more closely than headline yield. The table below lines up liquidity needs, tax drag, and horizon with a simple vehicle fit.
Key takeaways
With the fit decision made, the last step may be sizing the allocation conservatively.
Private credit may improve portfolio income, but that yield comes with real tradeoffs: illiquidity, underwriting uncertainty, manager dependence, and structural complexity. Most private credit income may be treated as ordinary income for U.S. tax purposes, which may make tax-advantaged accounts a cleaner home for many investors, especially those in higher brackets. Private credit may work best as a deliberate, sized allocation within a broader plan - not a bond substitute and not a core holding.
FAQs
Is private credit safer than high-yield bonds?
No. Private credit may not be safer than high-yield bonds by default, and both may carry meaningful credit and default risk.
High-yield bonds may be more exposed to market swings and interest-rate moves. Private credit, on the other hand, may add illiquidity, valuation opacity, and manager risk. So the choice may be less about safety and more about liquidity and yield.
How much private credit is too much in a portfolio?
There’s no one-size-fits-all percentage here. The right allocation may depend on your liquidity needs, time horizon, and risk tolerance.
A common rule of thumb: any single position, or any concentrated cluster, above 20% of total household assets may point to meaningful concentration risk.
It also may make sense to look at overlap across accounts. That way, your exposure may be less tied to the same economic factors affecting your public stocks and bonds.
Which private credit vehicle fits my liquidity needs?
It may depend on how much liquidity you may need and how comfortable you may feel with lock-up periods. If quick access to cash may matter more, liquid public alternatives like high-yield bond ETFs may be a better fit for some people.
If limited access may feel acceptable in exchange for possible yield premiums, interval funds and BDCs may offer different levels of liquidity. Some investors keep enough liquid assets outside these holdings for near-term financial needs.Disclosures:
- This content is for informational purposes only and does not constitute investment advice or a recommendation to buy or sell any security.
- Past performance is not indicative of future results. No guarantee of future performance or outcomes is implied.
Related Blog Posts
- Capital Call: How Private Equity and Capital Call Lines Work
- Capital Call: Private Equity and Capital Call Lines and How They Work
- The Complete Guide to Alternative Investments including farmland, art, pre-ipo, and private credit
- YieldStreet vs Fundrise: Real Estate Platform Comparison
No. Private credit may not be safer than high-yield bonds by default, and both may carry meaningful credit and default risk.
High-yield bonds may be more exposed to market swings and interest-rate moves. Private credit, on the other hand, may add illiquidity, valuation opacity, and manager risk. So the choice may be less about safety and more about liquidity and yield.
There’s no one-size-fits-all percentage here. The right allocation may depend on your liquidity needs, time horizon, and risk tolerance.
A common rule of thumb: any single position, or any concentrated cluster, above 20% of total household assets may point to meaningful concentration risk.
It also may make sense to look at overlap across accounts. That way, your exposure may be less tied to the same economic factors affecting your public stocks and bonds.
It may depend on how much liquidity you may need and how comfortable you may feel with lock-up periods. If quick access to cash may matter more, liquid public alternatives like high-yield bond ETFs may be a better fit for some people.
If limited access may feel acceptable in exchange for possible yield premiums, interval funds and BDCs may offer different levels of liquidity. Some investors keep enough liquid assets outside these holdings for near-term financial needs.Disclosures:
- This content is for informational purposes only and does not constitute investment advice or a recommendation to buy or sell any security.
- Past performance is not indicative of future results. No guarantee of future performance or outcomes is implied.