
Think your portfolio is diversified? It might not be. Even if you hold accounts across different brokerages like Fidelity, Vanguard, and Schwab, overlapping investments can expose you to concentration risk. For example, owning S&P 500 (VOO), Nasdaq 100 (QQQ), and Total Market (VTI) funds may seem varied, but they often share the same stocks - sometimes over 80. Add in tech-heavy compensation or direct stock holdings, and your exposure to a single sector like tech could hit 30–40% without you knowing.
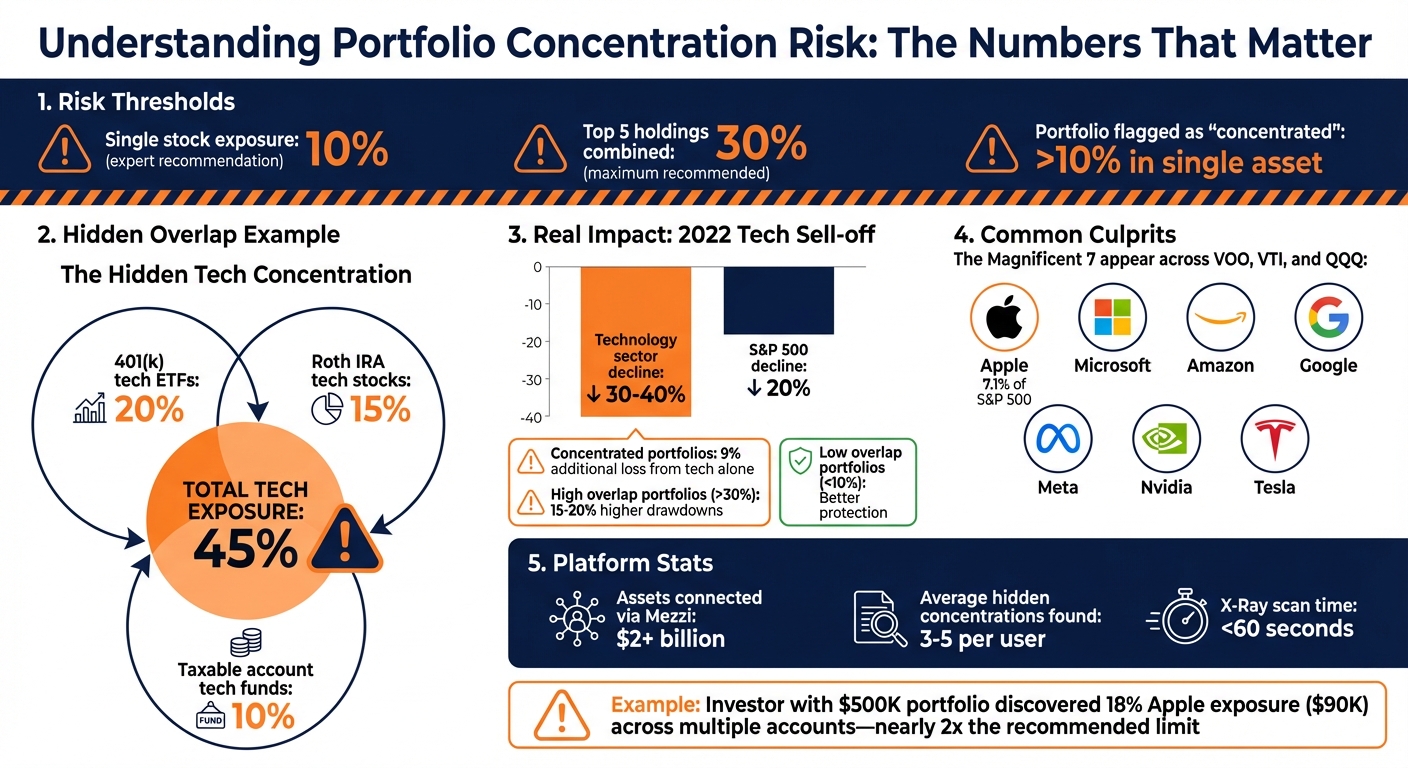
Why does this matter? If one sector or stock dominates your portfolio, a downturn - like the 2022 tech selloff - could lead to outsized losses. Experts recommend limiting single-stock exposure to 10% and your top five holdings to 30% of total risk.
How can you check? Mezzi’s X-Ray tool consolidates all your accounts into a single view, helping you identify overlaps and sector risks. Using a portfolio overlap checker helps identify these redundancies across different accounts. In just 60 seconds, you can see where your portfolio may be overexposed and receive suggestions to rebalance and diversify.
Portfolio Concentration Risk: Key Thresholds and Impact Statistics
What Concentration Risk Means for Your Portfolio
Defining Concentration Risk
Concentration risk arises when a portfolio is heavily dependent on a small number of securities, sectors, or asset classes. This means that if one or more of these key holdings underperform, the entire portfolio can take a significant hit. Many experts flag a portfolio as "concentrated" if over 10% of its value is tied to a single asset. The problem becomes even more pronounced when a single stock faces multiple overlapping risks - such as issues with its business fundamentals or challenges tied to its geographic market. In such cases, even minor downturns can lead to amplified losses, sometimes making recovery extremely difficult.
Deliberate vs. Accidental Concentration
To fully grasp concentration risk, it’s important to differentiate between intentional and unintentional allocation choices. Modern tools even use AI to customize diversification based on these specific choices. Concentration risk generally falls into two categories: deliberate and accidental.
Deliberate concentration happens when investors intentionally focus on specific assets. For example, someone might choose to heavily invest in technology stocks, leveraging their personal knowledge and belief in the sector’s long-term growth potential.
On the other hand, accidental concentration occurs when overlapping exposures sneak into a portfolio without the investor realizing it. A common example? Holding Apple shares directly, while also owning a tech-focused mutual fund and an S&P 500 fund - where Apple alone makes up 7.1% of the index. This kind of hidden overlap can create a false sense of diversification, leaving the portfolio exposed to concentrated risks. Tools like Mezzi's X-Ray can help uncover these overlaps, giving investors a chance to address them proactively.
"I discovered individual stock exposure I didn't even know I had. Turns out my 'diversified' ETF portfolio had significant overlap, with some companies appearing across multiple funds." - Nishant Jayant, Meta Engineer
How Mezzi Connects Your Accounts to Show the Full Picture

Connecting All Your Accounts in One Place
Mezzi simplifies account management by securely linking your financial accounts through Plaid and Finicity, Mastercard’s financial data platform. This includes everything from 401(k)s and IRAs to HSAs, 529 plans, and trusts. The process is quick - just about 2 minutes - and completely secure. Mezzi operates in a read-only mode, meaning it can view your holdings but cannot move money or access your credentials. With this setup, you get a consolidated dashboard that offers institutional-level analysis, a level of analysis commonly found on institutional platforms. So far, over $2 billion in assets have been connected through Mezzi’s platform. This comprehensive view helps uncover risks that often go unnoticed, such as hidden overlaps in sectors or stocks.
Individual Account Views Can Be Misleading
Viewing accounts separately can obscure risks you didn’t even know existed. For example, consider a 401(k) with 20% invested in tech ETFs, a Roth IRA with 15% in individual tech stocks, and a taxable account with 10% in tech mutual funds. Together, that’s a 45% exposure to the tech sector.
This kind of hidden concentration leaves you vulnerable to downturns in a specific sector. Interestingly, some Mezzi users report identifying previously unrecognized stock concentrations after linking their accounts. A common culprit? The "Magnificent 7" - Apple, Microsoft, Amazon, Google, Meta, Nvidia, and Tesla. These companies often appear across popular funds like VOO, VTI, and QQQ, creating a false sense of diversification while actually amplifying your exposure.
Finding Overlaps and Sector Exposure with Mezzi's X-Ray Tool
How to Run an X-Ray Scan
The X-Ray tool is designed to uncover hidden overlaps and sector exposures in your portfolio. Once your accounts are connected, running a scan is quick - less than 60 seconds. From the Portfolio dashboard, just head to the Analysis menu and select "Run X-Ray." You can choose to analyze your entire portfolio or focus on specific accounts, like your 401(k) and Roth IRA, to see how they interact.
This tool dives into ETFs, mutual funds, and target-date funds to reveal the underlying stocks they hold. It calculates your total exposure across all holdings. For instance, if you own 5% of Apple directly, plus 3% through one ETF and 4% through another, your total exposure to Apple is 12% - well above the 10% threshold that experts often consider risky.
The results are presented in an interactive dashboard featuring a holdings overlap matrix, a sector exposure pie chart, and a risk heatmap. These visuals highlight flagged concentrations and offer actionable steps like "diversify into underrepresented sectors." This level of detail provides a clear path to identify and address sector risks.
Example: Finding Hidden Tech Stock Concentration
Take an investor with a $500,000 portfolio spread across various accounts: 20% in VTI (which includes 4% Apple), 15% in QQQ (8% Apple), 10% in direct Apple shares, and 10% in a tech-focused mutual fund (6% Apple). When analyzed, the X-Ray tool reveals a total Apple exposure of 18% - or $90,000 in a single company. That’s nearly double the recommended 10% limit.
The scan also uncovers a 45% total exposure to the Technology sector, factoring in other stocks like Microsoft and Nvidia held across these funds. This level of concentration can leave your portfolio vulnerable to sector-specific downturns. For example, during the 2022 tech sell-off, the Technology sector dropped by 30–40%, compared to the S&P 500’s 20% decline. A portfolio like this would have taken about a 9% hit from tech losses alone.
The X-Ray tool helps differentiate between intentional and unintentional overlaps, which is key for managing risk. Accidental concentrations are often easier to fix - swapping one fund for another with less overlap may help reduce unintentional risk. This makes it an essential tool for maintaining a balanced and resilient portfolio.
How to Reduce Concentration Risk
Rebalancing to Improve Diversification
Once you've identified concentration risks using Mezzi's X-Ray tool, the next step is rebalancing your portfolio. This involves selling positions that are too heavily weighted and reallocating funds to other sectors or asset classes. For example, if your tech holdings make up 25% of your portfolio - split between 15% in Apple and 10% in Microsoft - you could sell $50,000 worth of Apple stock to bring your tech exposure down to 10%. The funds could then be redirected to sectors like healthcare or bonds. This adjustment could lower sector volatility from 18% to 12% and help you achieve a more balanced 60/40 equity-to-fixed-income allocation.
Mezzi supports this process by analyzing your linked accounts and providing a suggested rebalance plan. The plan specifies suggested adjustments, such as reducing certain holdings to meet your chosen portfolio targets. It also highlights tax implications and updates your risk metrics after the rebalance. You remain in full control - Mezzi provides the guidance, but you execute the trades yourself through your brokerage accounts.
For better tax efficiency, focus on rebalancing within tax-advantaged accounts like 401(k)s or IRAs first, where capital gains taxes aren't an issue. In taxable accounts, you can offset gains by harvesting losses, up to $3,000 annually. This rebalancing process should be revisited quarterly or after major market fluctuations to keep your portfolio aligned with your goals. Additionally, exploring alternative funds can further enhance diversification.
Finding Funds with Less Overlap
Another effective way to reduce concentration risk is by swapping out funds with high overlap. Replacing these funds with alternatives that provide similar returns but more diverse holdings can significantly improve your portfolio's balance. Mezzi's X-Ray tool identifies overlap - for instance, it might reveal that two tech ETFs share 40% of the same stocks. The platform then suggests alternatives with less overlap and similar investment objectives.
For example, you could replace VGT (a tech-heavy ETF with over 50% sector concentration) with a mix of VTI (U.S. total market) and BND (broad bonds) to bring tech exposure below 15%. Alternatively, you might opt for VT (global stocks) to reduce U.S. geographic concentration while maintaining similar investment objectives and lower volatility. Portfolios with higher sector overlap experienced greater drawdowns during the 2022 tech correction than more diversified portfolios. To keep costs low, focus on ETFs with expense ratios between 0.03–0.10%.
Mezzi highlights these opportunities for your consideration. You can review the suggestions, evaluate them in light of your tax strategies and timing preferences, and decide which changes to implement. This approach allows you to maintain control while accessing portfolio analysis tools.
Managing Concentrated Stock Risk: From Concentration to Confidence
Conclusion
Concentration risk often flies under the radar in multi-account portfolios. But when more than 10% of your assets are tied up in a single stock or sector, you’re setting yourself up for heightened losses and unpredictable swings that can throw off your financial plans. The 2022 tech correction was a clear example - portfolios with heavy concentrations saw losses 30–50% higher than those that were more diversified.
Mezzi tackles this issue by giving you a unified, comprehensive view of your investments. By securely connecting all your accounts - 401(k)s, IRAs, taxable brokerages, HSAs - through read-only access, Mezzi uncovers hidden concentrations that individual brokerage statements might overlook. Its X-Ray tool scans your entire portfolio in just minutes, pinpointing areas where your sector exposure exceeds safe limits.
With the help of AI-powered insights, Mezzi provides detailed sector breakdowns, overlap scores, and risk metrics, to help you identify where your portfolio may be overexposed. Beyond identifying risks, it offers suggested rebalancing actions, alternative fund options to adjust overlap, and tax strategies for adjusting your positions. Importantly, you stay in control - Mezzi provides the guidance, but you decide and execute the trades.
FAQs
What counts as 'too much' exposure to one stock or sector?
When a single stock or sector makes up more than 10–20% of your portfolio, it’s often seen as overexposure. This kind of concentration can lead to heightened risks, including increased volatility, liquidity challenges, and the potential for significant losses. By spreading your investments across various assets, you can help reduce these risks and maintain a more balanced portfolio.
Will Mezzi include my 401(k), IRA, HSA, and taxable accounts in one view?
Mezzi securely connects your 401(k), IRA, HSA, and taxable accounts, bringing them all together into one streamlined view. This makes it easier to analyze your entire portfolio and identify potential risks, such as being too heavily invested in certain sectors or assets.
How can I reduce overlap without triggering a big tax bill?
To avoid overlap and keep taxes in check, leverage Mezzi's AI-powered X-Ray feature to spot duplicate holdings across your accounts. You can then rebalance your portfolio strategically - timing asset sales or using gains to offset losses. Techniques like tax-loss harvesting can also help lower your tax bill while enhancing diversification. Regular portfolio reviews using these tools ensure you stay diversified and manage taxes more efficiently.
Related Blog Posts
- What are the risks of having overlapping exposures in my fund investments?
- How can I identify and reduce over-concentration risks in my 401(k) (by issuer, sector, and factor)?
- Portfolio Overlap Checker: How to Find Hidden Duplication Across All Your Accounts
- Sector Exposure Analyzer: Find the Bets You Didn’t Know You Were Making
Table of Contents
Book Free Consultation
Walk through Mezzi with our team, review your current situation, and ask any questions you may have.