
Looking for a safe place to park your money? VGSH, SHY, and SCHO are three short-term Treasury ETFs offering relative stability, lower risk compared to longer-duration bonds, and consistent income. Here's a quick breakdown to help you choose:
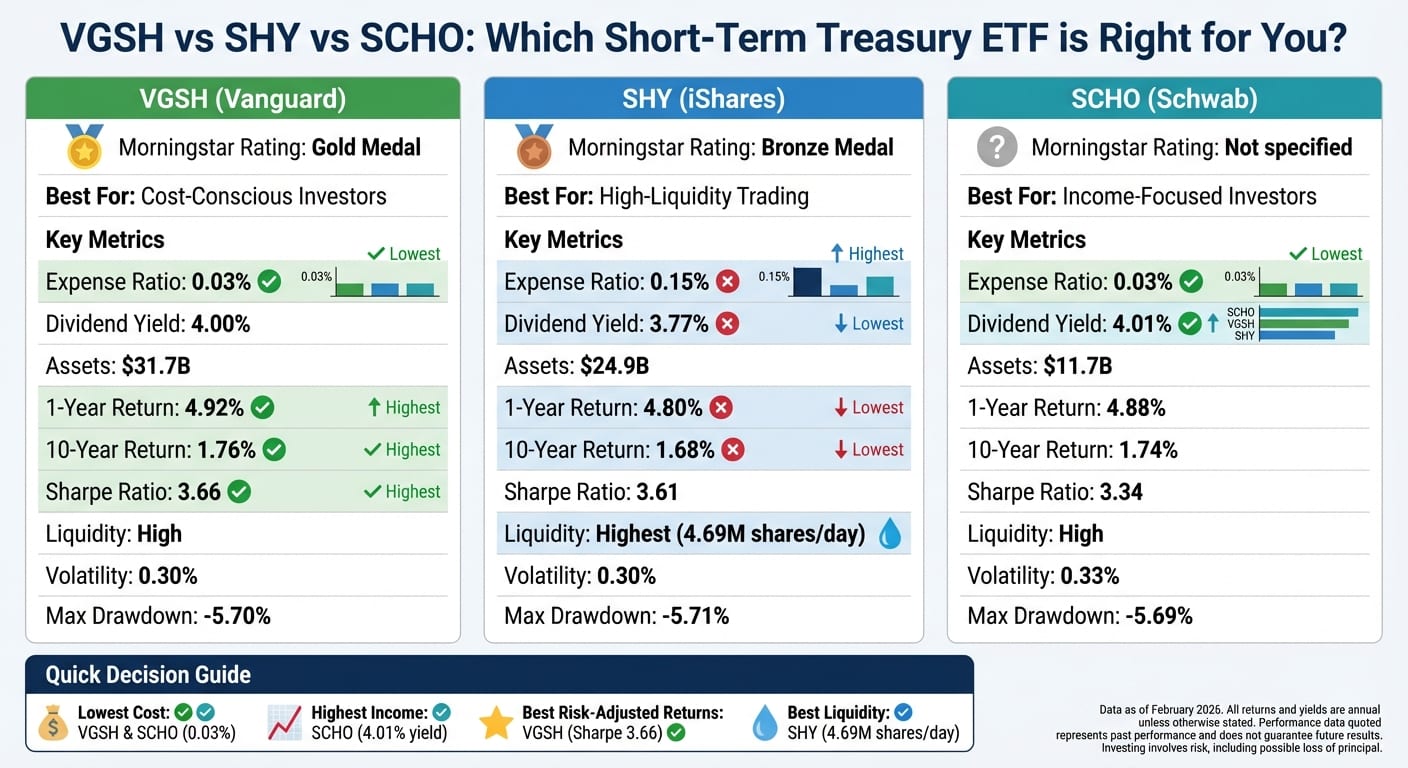
- VGSH (Vanguard Short-Term Treasury ETF): Lowest expense ratio (0.03%), historically strong risk-adjusted returns, and a Gold Morningstar rating. Offers a 4.00% dividend yield and may be appropriate for cost-conscious investors.
- SHY (iShares 1-3 Year Treasury Bond ETF): Highly liquid with 4.69 million shares traded daily. However, its higher expense ratio (0.15%) makes it less efficient for long-term returns. Dividend yield: 3.77%.
- SCHO (Schwab Short-Term U.S. Treasury ETF): Offers the highest dividend yield (4.01%) and matches VGSH's ultra-low expense ratio (0.03%). May be appropriate for investors prioritizing income.
Quick Comparison
Key takeaway: VGSH is the most cost-efficient and risk-conscious among these ETFs. SCHO offers slightly higher income, while SHY may be considered for larger trades due to its liquidity. Your choice depends on whether you prioritize costs, income, or trading flexibility.
VGSH: Vanguard Short-Term Treasury ETF
Fund Characteristics and Metrics
VGSH follows the Bloomberg 1-3 Year U.S. Treasury Index, comprising a market-value-weighted portfolio of 93 U.S. Treasury securities with maturities ranging from one to three years. Since its launch on November 19, 2009, the fund has grown significantly, reaching $31.68 billion in net assets.
With an expense ratio of just 0.03% and an average effective duration of 1.9 years - about six months shorter than many of its peers - VGSH is designed to minimize sensitivity to interest rate changes. As of February 2026, it offered a 4.00% dividend yield with monthly payouts. The fund's market price was $58.86, staying within a narrow 52-week range of $58.32 to $58.98. Vanguard's robust portfolio management team ensures the fund closely mirrors the underlying index while keeping transaction costs to a minimum.
These features contribute to VGSH's recognition as a conservative investment option.
Risk Profile and Performance
VGSH is recognized for its conservative risk profile, thanks to its low cost and short duration. Since its inception, the fund has recorded a maximum drawdown of -5.70%, a Sharpe ratio of 3.66, and a beta of 0.26 relative to the S&P 500 - showing limited correlation with equity market volatility.
In 2022, during a period of rising inflation, VGSH outperformed its category peers by more than 1 percentage point, as its short duration shielded it from the impact of rising interest rates. Over the past decade, the fund delivered an annualized return of 1.76% with exceptionally low volatility of 0.30%.
"Interest rate risk is the only risk the portfolio is exposed to, but even that is kept under wraps by focusing on the short end of the US Treasury yield curve." - Zachary Evens, Analyst, Morningstar
Morningstar has recognized VGSH with its Gold Medalist Rating as of July 14, 2025, awarding Above Average ratings for both the Process and People pillars. Additionally, interest income from Treasury funds like VGSH is often exempt from state and local taxes, though it remains subject to federal income tax.
SHY: iShares 1-3 Year Treasury Bond ETF
Fund Characteristics and Metrics
SHY is designed to track the ICE BofA US Treasury Bond (1-3 Year) Index, holding around 90 U.S. Treasury securities with maturities ranging from one to three years. Since its launch on July 22, 2002, the fund has grown to manage approximately $24.9 billion in assets. While its expense ratio sits at 0.15% - notably higher than VGSH and SCHO's 0.03% - it compensates with strong liquidity, boasting an average daily trading volume of about 4.69 million shares over the past month. As of February 2026, SHY provided a dividend yield of 3.77%, paid out monthly, with its portfolio overwhelmingly comprised of sovereign debt (99.06%) and a small 0.94% cash allocation.
Morningstar has recognized SHY with a Bronze Medalist Rating as of December 31, 2025, highlighting its reliable management team and disciplined investment approach. However, this ranks below VGSH's Gold rating. These attributes emphasize SHY's focus on maintaining a well-balanced and risk-conscious portfolio.
Risk Profile and Performance
SHY's structure is designed to support capital preservation, supported by its impressive liquidity and conservative cost framework. It has earned a top Lipper Preservation rating of 5, affirming its commitment to safeguarding investor capital. The fund's cautious approach is evident in its low beta range (0.01 to 0.05), a standard deviation of 1.07%, and a maximum drawdown of -5.71%. Over the past 10 years, SHY has achieved an annualized return of 1.68%, with monthly volatility of just 0.30%. More recently, it delivered a 1-year return of 4.80%, coupled with strong risk-adjusted metrics like a Sharpe ratio of 3.61 and a Sortino ratio of 6.50.
"SHY is light on both interest rate risk and credit risk, and as such will generally deliver a relatively [stable performance]." – ETF Database Analyst
Like other Treasury funds, SHY's holdings are backed by the full faith and credit of the U.S. government, eliminating default risk. Its focus on short-term maturities minimizes interest rate sensitivity, making it an option for safety-conscious investors.
SCHO: Schwab Short-Term U.S. Treasury ETF
Fund Characteristics and Metrics
SCHO follows the Bloomberg US Treasury 1-3 Year Index, offering exposure to 98 U.S. Treasury securities with maturities ranging from one to three years. As of February 20, 2026, the fund manages about $11.72 billion in assets and boasts an ultra-low expense ratio of 0.03%, which is far below SHY's 0.15% fee. Early 2026 figures show SCHO providing a SEC yield of 3.52% and a distribution yield of 4.05%. Its portfolio is nearly fully allocated to U.S. government securities (99.77%), ensuring minimal credit risk.
A 2-for-1 share split on October 10, 2024, doubled the number of shares while halving the share price, making it more accessible for investors. With an effective duration of 1.9 years and a weighted average maturity of 1.97 years, the fund's sensitivity to interest rate changes remains minimal. Liquidity metrics are strong, with a 30-day median bid/ask spread of 0.04% and an average daily trading volume of 3.5 million shares, slightly trailing SHY's 4 million shares.
Risk Profile and Performance
SCHO's conservative approach is reflected in its Lipper Preservation rating of 5, indicating a focus on capital preservation. It carries a beta of 0.05, a three-year standard deviation of 1.85%, and experienced its steepest three-month loss of –2.49% during the period from December 2021 to March 2022. Over the last decade, SCHO delivered an annualized return of 1.74%, with a 1-year return of 4.88% and a 3-year return of 4.28% as of January 31, 2026.
"SCHO is light on both interest rate risk and credit risk, and as such will generally deliver a relatively low expected return. SCHO may serve as a safe haven to park assets in volatile markets, especially for those with Charles Schwab accounts that can trade the security for free." – ETF Database Analyst
SCHO's performance as of February 19, 2026, shows a year-to-date return of 0.51%, closely matching VGSH's 0.52% and slightly outperforming SHY's 0.49%. For Schwab account holders, the ability to trade SCHO commission-free adds to its appeal. Its Treasury holdings also provide state and local tax exemptions, which can enhance after-tax returns. These attributes make SCHO an option for conservative investors prioritizing safety and liquidity, standing alongside VGSH and SHY in this category.
Side-by-Side Comparison of VGSH, SHY, and SCHO
Comparison Table
Data as of February 2026
The following analysis highlights the key differences these metrics reveal.
What the Data Shows
VGSH and SCHO are notable for their cost efficiency, with expense ratios ranging from 0.03% to 0.05%. This is significantly lower than SHY's 0.15%, a difference that can add up over time, particularly for long-term investors.
SCHO has the highest income yield among the three, offering a trailing twelve-month dividend yield of 4.01%, which is slightly higher than VGSH's 3.96% and SHY's 3.77%. For those prioritizing income, this makes SCHO an attractive option.
VGSH has demonstrated higher risk-adjusted returns historically, boasting a Sharpe ratio of 3.66. This suggests it delivers more return per unit of risk compared to SHY and SCHO. Additionally, with assets under management hovering around $30 billion, VGSH ensures high liquidity, which may make it appropriate for large-scale trades. As Morningstar analyst Zachary Evens puts it:
"An ultralow-risk fund charging mere basis points like this one presents a high hurdle for any active manager in the category to beat".
These insights provide a clear framework for determining which ETF may align best with your specific investment needs and goals.
Choosing the Right Short-Term Treasury ETF
Matching ETFs to Your Goals
Picking between VGSH, SHY, and SCHO depends on what matters most to you. If you're focused on keeping costs low, VGSH and SCHO are better options thanks to their much lower expense ratios compared to SHY.
For those prioritizing income, SCHO edges ahead with a trailing 12-month dividend yield of 4.01%, slightly higher than VGSH at 3.96% and SHY at 3.77%. That small yield bump can make a difference in cash flow while still keeping your investment safe.
If you're looking at risk-adjusted returns, VGSH takes the lead. It boasts a Gold Morningstar Medalist Rating and has a shorter average duration of 1.9 years, which is about six months less than its peers. This helped it outperform by over 1 percentage point during 2022's rising-rate environment. Morningstar analyst Zachary Evens highlights:
"An ultralow-risk fund charging mere basis points like this one presents a high hurdle for any active manager in the category to beat".
Each ETF offers unique strengths, making them suitable for different roles in your overall investment strategy.
Adding These ETFs to Your Portfolio
Once you've identified your priorities, think about how these ETFs can fit into your portfolio. Short-term Treasury ETFs are great for anchoring a diversified portfolio. They work as a "cash-plus" option, providing higher yields than money market accounts while maintaining liquidity - commonly used for funds needed in one to three years. With average daily trading volumes of over 3.8 million shares for VGSH and 4.6 million shares for SHY, buying or selling these ETFs is hassle-free.
However, avoid holding both VGSH and SHY at the same time. With a correlation of 0.81, they tend to move together, offering little in terms of diversification. Instead, choose the one that aligns best with your goals and use it as a defensive asset during market volatility or credit market stress.
3 Great Short-Term Bond ETFs
Conclusion
Deciding between VGSH, SHY, and SCHO comes down to your investment goals. These ETFs share a focus on 1–3 year U.S. Treasuries, offering minimal credit risk and a reliable option for preserving capital.
VGSH shines with its Gold Morningstar Medalist Rating and a hefty $31.7 billion in assets under management. Its ultra-low 0.03% expense ratio and 1.9-year average duration allowed it to outperform by over 1 percentage point during 2022’s rising-rate climate. SCHO also boasts a 0.03% fee but edges ahead with a slightly better yield - typically ranging from 4.01% to 4.06%, compared to VGSH’s 3.96% to 4.00%. On the other hand, SHY offers higher liquidity compared to the others, with 4.69 million shares traded daily. However, its expense ratio of 0.15% - five times higher than the other two - can weigh on long-term returns, earning it a Bronze Morningstar rating.
Morningstar analyst Neal Kosciulek emphasizes the importance of fees in this space:
Expense ratios are extremely important in comparing short‐term Treasury ETFs because return potential is limited in this narrow opportunity set.
Even a small difference, like SHY's 0.12% higher fee, can compound significantly over time.
Ultimately, the choice depends on what you value most. If low costs and strong ratings are your priorities, VGSH is a strong contender. For those who want every basis point of yield, SCHO might be the better fit. Meanwhile, SHY offers superior liquidity for large trades but may underperform over the long term due to its higher fees. Your decision should align with whether cost efficiency, yield, or trading flexibility is most important to you.
FAQs
How can these ETFs lose money if they hold U.S. Treasuries?
When you invest in these ETFs, there's a chance of losing money due to interest rate risk. Here's why: as interest rates go up, the value of existing Treasury bonds drops. Why? Because new bonds come with higher yields, making the older ones less attractive. This can lead to losses if the ETF sells those bonds before they mature.
On top of that, bond prices can be influenced by shifts in inflation expectations or changes in market sentiment. These fluctuations can lower the ETF’s net asset value (NAV). While the principal amount is safe if held until maturity, selling during periods of market downturns could still result in a loss.
Which matters more for me: SEC yield or distribution yield?
The SEC yield represents a fund's annualized income over the past 30 days, adjusted for expenses, making it a standardized metric for comparison. This measure is particularly useful for assessing current income potential, especially when interest rates are climbing. On the other hand, the distribution yield indicates the actual income paid out to investors, which can fluctuate based on market conditions. For those prioritizing safety, the SEC yield provides a better snapshot of income potential, while the distribution yield highlights recent cash flow trends.
Are Treasury ETF dividends exempt from state income tax?
Dividends from U.S. Treasury ETFs are usually exempt from state and local income taxes since interest earned on U.S. government obligations is generally not taxed at the state level. However, these dividends are still subject to federal income taxes. It's always a good idea to check with a tax professional to understand how this applies to your personal financial situation.
Disclosures:
- This content is for informational purposes only and does not constitute investment advice or a recommendation to buy or sell any security.
- Past performance is not indicative of future results. No guarantee of future performance or outcomes is implied.
- Savings and performance examples are hypothetical and for illustrative purposes only. Actual results will vary based on individual circumstances, portfolio composition, market conditions, and fees.
Related Blog Posts
- SCHZ vs AGG: are Schwab’s core bonds meaningfully different?
- SCHD/VYM/DGRO head-to-head: dividend yields, 5/10-year dividend growth, fees, and top-10 overlap.
- SGOV vs BIL vs SHV vs TFLO - Best T-bill ETF for cash parking in a taxable account
- SCHD vs DGRO: Dividend Growth ETF for Long-Term Compounders
When you invest in these ETFs, there's a chance of losing money due to interest rate risk. Here's why: as interest rates go up, the value of existing Treasury bonds drops. Why? Because new bonds come with higher yields, making the older ones less attractive. This can lead to losses if the ETF sells those bonds before they mature.
On top of that, bond prices can be influenced by shifts in inflation expectations or changes in market sentiment. These fluctuations can lower the ETF’s net asset value (NAV). While the principal amount is safe if held until maturity, selling during periods of market downturns could still result in a loss.
The SEC yield represents a fund's annualized income over the past 30 days, adjusted for expenses, making it a standardized metric for comparison. This measure is particularly useful for assessing current income potential, especially when interest rates are climbing. On the other hand, the distribution yield indicates the actual income paid out to investors, which can fluctuate based on market conditions. For those prioritizing safety, the SEC yield provides a better snapshot of income potential, while the distribution yield highlights recent cash flow trends.
Dividends from U.S. Treasury ETFs are usually exempt from state and local income taxes since interest earned on U.S. government obligations is generally not taxed at the state level. However, these dividends are still subject to federal income taxes. It's always a good idea to check with a tax professional to understand how this applies to your personal financial situation.