
Looking for the best tech ETF? Here’s the breakdown:
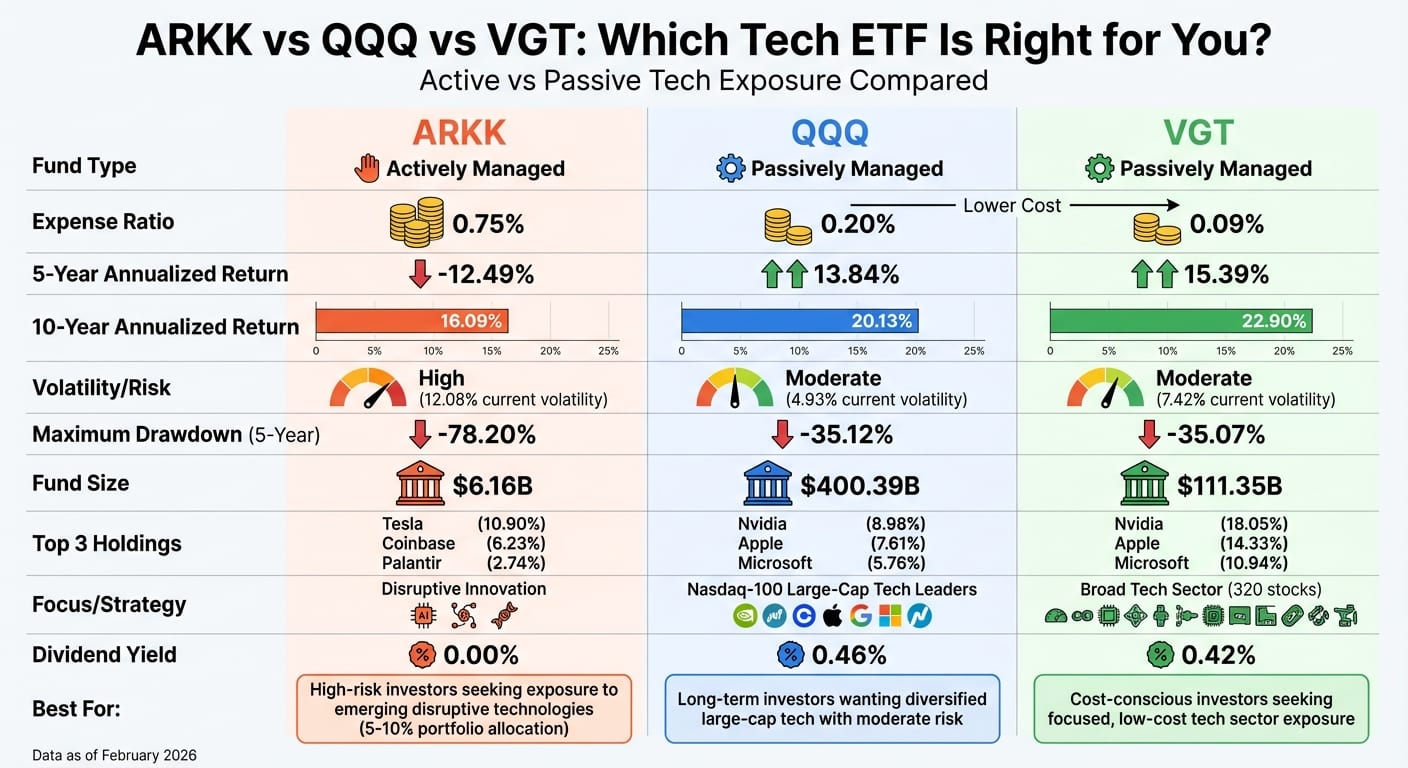
- ARKK: Actively managed, focuses on disruptive innovation (AI, robotics, genomics). High risk, high fees (0.75%), and volatile returns. Over 5 years, it lost an annualized 12.49%.
- QQQ: Passively tracks the Nasdaq-100, featuring large-cap tech leaders like Apple and Microsoft. Moderate risk, fees (0.20%), and stable long-term performance with a 5-year annualized return of 13.84%.
- VGT: Passively tracks the MSCI US Tech Index, offering broad tech exposure. Low fees (0.09%), strong returns (15.39% annualized over 5 years), and a focus on mega-cap stocks like NVIDIA.
Quick Comparison:
MetricARKK (Active)QQQ (Passive)VGT (Passive)Expense Ratio0.75%0.20%0.09%5-Year Return-12.49%13.84%15.39%VolatilityHighModerateModerateTop HoldingsTesla, Coinbase, PalantirNvidia, Apple, MicrosoftNvidia, Apple, MicrosoftFund Size$6.16B$400.39B$111.35B
Key Takeaway: ARKK suits high-risk takers with a focus on emerging tech, while QQQ and VGT are better for long-term, cost-conscious investors. For diversification, consider combining these funds based on your risk tolerance and goals.
QQQ vs VGT: The 2 Best Growth ETFs in Comparison
ARKK: Active Management Focused on Disruptive Technology
ARKK breaks away from traditional index tracking by actively selecting stocks through its proprietary research focused on "disruptive innovation". The fund zeroes in on five key areas of innovation: public blockchains, artificial intelligence, multiomic sequencing, energy storage, and robotics. Unlike funds that stick strictly to tech, ARKK's approach spans across industries, including healthcare (genomics), financial services (fintech), and industrials (robotics).
Investment Strategy and Portfolio Holdings
ARKK maintains a concentrated portfolio of 35–55 stocks, with its top 10 holdings making up 58.5% of the fund. As of February 2026, Tesla was the largest holding, accounting for 10.90% of the portfolio. Other prominent names include Coinbase, Palantir, Robinhood, and Roku. The fund's strategy revolves around identifying companies where technological convergence - like artificial intelligence enhancing genomics or robotics - creates synergistic growth opportunities.
"We believe that investing in disruptive innovation will outperform broad-based market benchmarks significantly over the course of a full market cycle."
– ARK Investment Management LLC
The fund's turnover rate of roughly 75% is far higher than the average 10% seen in passive funds. This reflects ARKK's active and high-conviction management style, which comes with its own set of costs.
Fees and Fund Size
ARKK charges a 0.75% expense ratio, which reflects the intensive research and active management required for its strategy. While this fee is higher compared to VGT's 0.09% or QQQ's 0.20%, it aligns with ARKK's focus on disruptive growth. As of February 2026, the fund managed $6.16 billion in assets, showing continued investor interest in its forward-thinking investment approach.
"ARKK is actively managed... It looks into the high innovation areas of this economy. So you're going to pay for that. I don't think 75 basis points is actually unreasonable for the strategy."
– David Dierking, Independent ETF Analyst
Returns and Volatility
ARKK's active management brings both opportunities and risks, which are reflected in its performance metrics. Over a 5-year period, the fund delivered an annualized return of -0.8%, with a maximum drawdown of -80.97%. Its standard deviation of 38.3% is nearly double QQQ's 21.8%, highlighting its higher volatility. However, in 2025, ARKK surged 62%, significantly outpacing QQQ's 24% gain during the same year. Despite this, ARKK's Sharpe ratio of 0.50 indicates lower risk-adjusted returns compared to QQQ's 0.87.
"ARKK is known for high-conviction bets... geared toward investors who have the fortitude and faith to ride out short-term volatility in favor of long-term gains."
– ETF Database Analyst Report
Given its unpredictable nature, ARKK is best suited as a satellite holding, ideally making up no more than 10% of a portfolio. This allocation works well for investors who are comfortable with significant drawdowns in pursuit of potentially large long-term gains.
QQQ: Index Tracking for Large-Cap Tech Stocks
QQQ is designed to track the Nasdaq-100 Index, which represents the 100 largest non-financial companies listed on the Nasdaq Stock Market. Since its launch on March 10, 1999, this ETF has grown into one of the most actively traded funds, managing an impressive $400.39 billion in assets as of February 22, 2026. Unlike ARKK, which focuses on high-risk, disruptive innovation, QQQ provides exposure to well-established tech leaders while also including companies from sectors like consumer discretionary, healthcare, and industrials.
Large-Cap Technology Holdings
QQQ's market-cap-weighted structure prioritizes established tech giants, giving larger companies a stronger influence on fund performance. As of February 2026, the top 10 holdings make up 47.65% of the portfolio. Leading the list are Nvidia (8.98%), Apple (7.61%), Microsoft (5.76%), Amazon (4.37%), Tesla (4.00%), Meta Platforms (3.75%), and both Alphabet stock classes (3.57% and 3.31%).
While technology dominates at 63.28% of the fund's sector allocation as of December 31, 2025, QQQ also offers exposure to consumer discretionary (17.89%), healthcare (5.42%), and industrials (3.75%).
"QQQ includes companies from other sectors, it also includes all the companies mentioned above [Alphabet, Amazon, Meta, Tesla], as well as those that technically fall into the tech sector."
– Stefon Walters, Writer, The Motley Fool
This mix of concentrated holdings highlights QQQ's focus on tech while also contributing to its strong liquidity and cost efficiency.
Fees and Fund Size
QQQ has a 0.20% expense ratio, reflecting its passive management approach, which involves quarterly rebalancing and annual reconstitution to align with the Nasdaq-100 Index. With a 30-day average trading volume of 62.54 million shares, the fund is highly liquid, making it easy for investors to buy or sell shares without difficulty.
Performance History and Risk Level
QQQ has shown strong long-term results, delivering a 10-year annual return of 18.54% as of December 2025. Its beta of 1.16 and a 10-year Sharpe ratio of 0.82 indicate that it generates solid returns relative to its level of volatility. The fund's 200-day volatility stands at 16.95%, which is lower than more volatile options like ARKK, making it appealing for investors who want growth without extreme market swings.
Additionally, QQQ's turnover ratio of 22% is much lower than ARKK's 71%, leading to reduced transaction costs and more tax-efficient returns for long-term investors. The fund also offers a modest dividend yield of 0.46%, with an annual dividend rate of $2.80. This combination of steady performance, lower risk, and cost efficiency makes QQQ a compelling choice for those seeking balanced growth.
VGT: Low-Cost Broad Technology Sector Exposure
VGT stands out as a low-cost option for investors looking for focused exposure to the technology sector. Managed by Vanguard, this passively managed ETF tracks the MSCI US Investable Market Information Technology 25/50 Index. It includes 320 stocks from large, mid, and small-cap U.S. companies, all within the Information Technology sector as defined by the Global Industry Classification Standard (GICS).
Diversified Technology Holdings
As of January 31, 2026, VGT's portfolio is heavily concentrated in three key players: NVIDIA (18.05%), Apple (14.33%), and Microsoft (10.94%). Together, these three account for over 43% of the fund's total assets. The sector allocation shows a strong emphasis on semiconductors (34.40%), technology hardware, storage & peripherals (17.30%), systems software (15.80%), and application software (12.00%).
While VGT holds more stocks than QQQ (320 compared to 102), its top 10 holdings make up 60% of its assets, compared to 45% for QQQ. Notably, VGT excludes companies like Alphabet, Meta, Amazon, and Tesla, as these fall under other GICS classifications such as Communication Services or Consumer Discretionary. The fund's median market cap of $467.2 billion reflects its focus on mega-cap technology stocks, though it also includes smaller companies. This combination of concentrated exposure and broad diversification enhances its appeal.
Low-Cost Structure
One of VGT's key strengths is its cost efficiency. With an expense ratio of just 0.09% as of December 19, 2025, it is significantly cheaper than QQQ's 0.20% and ARKK's 0.75%. This rate is also far below the 0.94% average for comparable technology funds. Its passive management style helps keep costs low by limiting frequent trading, which also improves tax efficiency for long-term investors.
Performance and Price Stability
VGT pairs its low costs with strong historical performance. Over the past decade, it has delivered an average annual return of 23.20%, surpassing both QQQ and ARKK. While its beta of 1.22 indicates higher volatility compared to the broader market, its average drawdown of -7.99% is far less severe than QQQ's (-33.09%) and ARKK's (-29.58%). Additionally, VGT offers a modest 30-day SEC yield of 0.38%, providing some income alongside capital growth potential.
With its mix of high returns, controlled volatility, and minimal fees, VGT presents a compelling option for those seeking concentrated technology sector exposure without breaking the bank.
Side-by-Side Comparison: Performance, Risk, and Costs
Let’s take a closer look at how these funds stack up in terms of performance, risk, and costs.
Return Comparison Across Time Periods
When it comes to long-term performance, the differences are striking. As of February 24, 2026, VGT leads the pack with a 10-year annualized return of 22.90%, followed by QQQ at 20.13%. ARKK trails significantly at 16.09%. Over a 5-year period, ARKK’s strategy has struggled, posting an annualized return of –12.49%, while QQQ and VGT delivered 13.84% and 15.39%, respectively.
MetricARKK (Active)QQQ (Passive)VGT (Passive)YTD Return–9.00%–2.10%–3.57%1-Year Return16.28%14.90%16.98%5-Year Return (Annualized)–12.49%13.84%15.39%**10-Year Return (Annualized)**16.09%20.13%22.90%**Sharpe Ratio (1-Year)**0.370.640.61
In terms of risk-adjusted returns, QQQ takes the lead with a Sharpe Ratio of 0.64 over the past year, edging out VGT’s 0.61. ARKK, on the other hand, lags significantly with a Sharpe Ratio of just 0.37. These numbers highlight the trade-offs between ARKK’s active, high-risk approach and the steadier, cost-efficient strategies of QQQ and VGT.
Volatility and Drawdown Analysis
ARKK’s strategy comes with higher volatility and steeper losses. Its current volatility is 12.08%, more than double QQQ’s 4.93% and significantly higher than VGT’s 7.42%. Moreover, ARKK experienced a staggering maximum drawdown of –78.20% over the past five years, compared to roughly –35% for both QQQ and VGT.
MetricARKKQQQVGTCurrent Volatility12.08%4.93%7.42%Max Drawdown (5-Year)–78.20%–35.12%–35.07%Ulcer Index12.66%5.34%6.95%**Dividend Yield (TTM)**0.00%0.46%0.42%
The Ulcer Index, which measures the depth and duration of drawdowns, further emphasizes ARKK’s risk. Its reading of 12.66% dwarfs QQQ’s 5.34% and VGT’s 6.95%. Additionally, while QQQ and VGT offer modest dividend yields of 0.46% and 0.42%, ARKK does not pay dividends at all.
Fees and Portfolio Overlap
When it comes to costs, VGT is the most budget-friendly option with an expense ratio of just 0.10%, compared to 0.20% for QQQ and 0.75% for ARKK.
Despite their differences, these funds have significant overlap in their top holdings, including major tech players like NVIDIA, Apple, and Microsoft. The correlations between them are high, with ARKK showing a 0.73 correlation with QQQ and 0.72 with VGT. However, the impact of fees on long-term investment growth varies significantly depending on the fund. ARKK’s higher expense ratio funds active research into disruptive innovation, while QQQ and VGT track indices with much lower overhead.
Choosing Between Active and Passive Tech Investing
Deciding between active and passive tech investing depends largely on your risk tolerance, investment timeline, and financial objectives.
Active vs. Passive: Weighing the Pros and Cons
Active management, like ARKK, aims to outperform the market by leveraging opportunities created during volatile periods. For example, in 2020, 49% of roughly 3,500 active funds outperformed passive funds. However, long-term success is less common. Studies show that most active large- and mid-cap fund managers fail to beat their passive benchmarks over a 10-year period, with few repeating their wins.
The trade-offs are straightforward. Passive ETFs like QQQ and VGT are known for their lower costs, tax benefits, and consistency, thanks to broad diversification and minimal trading. On the flip side, ARKK's frequent trading can lead to more taxable events. As Christopher C. Geczy, Adjunct Professor of Finance at Wharton, explains:
"The big issue still applies... whether you believe in trying to beat the market or whether you believe in [minimizing] costs".
FactorActive (ARKK)Passive (QQQ/VGT)Primary GoalOutperform through disruptive innovationMatch index performanceAnnual Cost0.75% 0.10%–0.20% TurnoverHighLowTax EfficiencyLower due to frequent tradingHigher with a buy-and-hold strategyVolatilityHigh (12.08%) Moderate (7.42%) Best ForHigh-risk, short-term investorsLong-term, stability-focused investors
A core-satellite approach is a smart way to combine the strengths of both strategies. Passive ETFs can serve as the "core" of your portfolio, offering steady, low-cost exposure to established tech giants. Meanwhile, a smaller "satellite" allocation to ARKK allows for targeted investments in disruptive technologies. This setup balances the stability of index tracking with the potential for higher returns from active management, all while managing risk and cost effectively.
Leveraging AI for Smarter Portfolio Management
Beyond choosing between active and passive funds, managing overlapping exposures and optimizing tax efficiency are key to building a balanced portfolio. This is where AI tools can make a difference.
Tracking multiple tech ETFs across accounts can get complicated fast, especially when funds share significant holdings like NVIDIA, Apple, or Microsoft. AI-powered tools, such as Mezzi's X-Ray feature, help identify hidden overlaps in your portfolio. This insight minimizes concentration risk and ensures a more diversified investment strategy.
AI also simplifies tax management. Mezzi's tax optimization tools monitor transactions across all connected accounts, flagging potential wash sales that could lead to hefty penalties. By identifying these risks and providing actionable insights, the platform helps maintain tax efficiency during portfolio rebalancing, saving both time and money.
Conclusion: Matching ETFs to Your Investment Goals
Choosing the right ETF comes down to aligning it with your investment goals and how much risk you’re comfortable taking. For instance, VGT offers focused exposure to Information Technology with a low expense ratio of 0.10%. On the other hand, QQQ provides broader diversification across the Nasdaq-100 at 0.20%. If you're looking to tap into the potential of disruptive innovation, ARKK takes an active approach with a higher expense ratio of 0.75%. However, the risk levels vary significantly - VGT's maximum drawdown is 34.10%, while ARKK’s reaches a much steeper 76.05%, reflecting the volatility that often comes with active management.
Performance metrics also tell a compelling story. VGT stands out with a Sharpe ratio of 1.43, outperforming QQQ's 0.82 and ARKK's 0.55. This means VGT delivers more return relative to the risk taken. For long-term investors focused on cost efficiency and stability, VGT or QQQ can serve as foundational investments. Meanwhile, ARKK, with a beta of 2.81, is better suited as a smaller, complementary position - perhaps 5–10% of your portfolio - to capture potential upside from emerging technologies without overwhelming your overall risk.
Managing your portfolio effectively goes beyond picking the right funds. Tools like Mezzi’s X-Ray and tax optimization features can help you identify overlaps in your holdings and avoid costly wash sales during rebalancing. At $39/month or $399/year for the Advisory, these AI-driven tools offer actionable insights that could lead to meaningful savings over time.
Whether you choose VGT's low-cost focus, QQQ's broader tech exposure, or ARKK's high-conviction strategy, the key is to align your selection with your investment timeline and tolerance for risk. Combining smart fund choices with real-time portfolio analysis and tax optimization ensures your investments are not only aligned with your goals but also managed efficiently for the long haul.
FAQs
Should I choose ARKK, QQQ, or VGT for my time horizon?
When it comes to long-term investing, QQQ tends to stand out. Its appeal lies in lower fees (0.20%), solid diversification, and impressive risk-adjusted returns over the past decade. While ARKK targets disruptive innovation, it comes with higher fees (0.75%) and significantly more volatility, which can make its performance less predictable for steady long-term growth. Another contender, VGT, offers strong potential, but QQQ’s broader focus on leading Nasdaq tech companies often makes it a more dependable choice for the majority of investors.
How risky is ARKK compared to QQQ and VGT in a downturn?
ARKK tends to carry more risk than QQQ and VGT, especially during market downturns. This is largely because ARKK actively targets disruptive innovation and high-growth sectors, which are known for their volatility. With a daily standard deviation of 45.36% compared to QQQ's 23.62%, ARKK's concentrated investments increase its exposure to sharp declines. In contrast, QQQ and VGT offer broader and more diversified exposure, making them less vulnerable to such significant swings.
How can I avoid overlap if I own more than one of these ETFs?
When managing a portfolio with multiple ETFs like ARKK, QQQ, and VGT, it's important to keep an eye on potential overlap in their holdings. Start by reviewing the stocks or sectors each ETF invests in - this will help you identify where they might share similar assets. If you notice significant overlap, consider rebalancing your portfolio. You can do this by reducing your exposure to ETFs that heavily overlap or by introducing funds with different investment strategies or sector focuses.
It’s also a good idea to regularly check the holdings and performance of your ETFs. This ensures your portfolio remains diversified and continues to align with your financial goals and risk tolerance. A little proactive monitoring can go a long way in keeping your investments on track!
Mezzi is free to get started. Choose Advisory for unlimited advice and advanced features at $39/month or $399/year. Concierge includes the same, plus hands-on support, at $99/month or $999/year.
Disclosures:
- This content is for informational purposes only and does not constitute investment advice or a recommendation to buy or sell any security.
- Past performance is not indicative of future results. No guarantee of future performance or outcomes is implied.
- Savings and performance examples are hypothetical and for illustrative purposes only. Actual results will vary based on individual circumstances, portfolio composition, market conditions, and fees.
- Registration does not imply a certain level of skill or that the SEC has approved the company or its services.
Related Blog Posts
- 5 Best AI-Focused ETFs for Diversification
- Provide 10-year and 20-year returns for two selected funds and list their top holdings (at latest disclosure).
- QQQM vs VGT: 5-year total return, sector concentration, top-10 weight drift, valuation metrics snapshot.
- QQQ vs QQQM vs VOO: Nasdaq 100 or S&P 500 for Your Portfolio