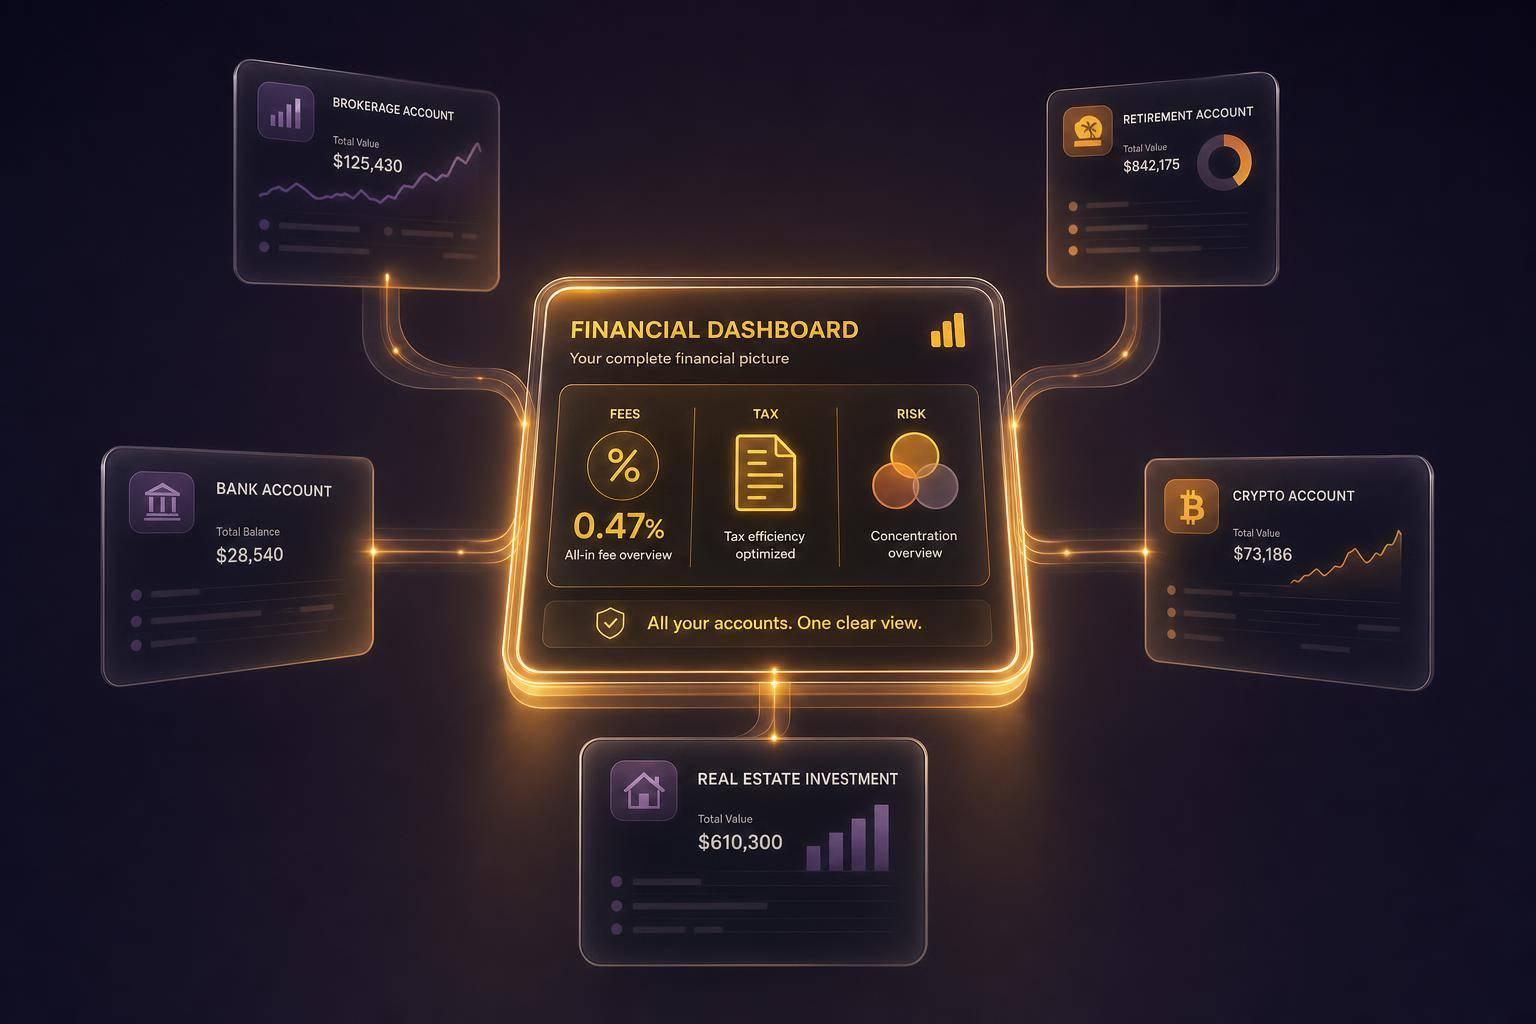
If your money sits across several accounts, a financial dashboard may give you one view of what you own, owe, and may need to watch. For some U.S. investors, that may mean seeing asset mix, fees, tax lots, cash flow, debt, and stock concentration in one place instead of across many logins.
Here’s the short version:
- A financial dashboard is a single view of your finances across accounts
- It may show net worth, balances, cash flow, returns, debt, and asset mix
- Some dashboards also flag portfolio drift, wash sale risk, tax-loss harvesting ideas, and stock overlap
- This may matter more if you have 401(k)s, IRAs, taxable accounts, HSAs, RSUs, or shared household accounts
- It may matter less if you have one main account and a simple fund setup
- One cited stat stands out: 65% of retirement savers may not know they pay fees inside their 401(k) because those costs may sit inside expense ratios rather than appear as line items
A simple tracker shows what you have. A dashboard with analysis may show what may need attention.
| Setup | What you may see without a dashboard | What a dashboard may add |
|---|---|---|
| One account, simple portfolio | Basic balances and returns | Limited extra value |
| Multiple accounts | Split views across portals | One combined picture |
| Taxable investing | Gains and losses by account | Cross-account tax view |
| RSUs or company stock | Partial stock exposure | Total concentration view |
| Household finances | Separate money decisions | Shared visibility |
If you spend time checking spreadsheets, jumping between portals, or guessing how accounts fit together, a dashboard may be worth a closer look.
What a financial dashboard is and what it should show
A financial dashboard gives you a visual view of your money across accounts. It pulls balances, investments, cash flow, and liabilities into one snapshot that may be easier to read and act on. A practical starting point is the set of numbers many investors look at first.
The basics: balances, net worth, cash flow, and returns
At the base level, a dashboard may show net worth, balance trends, monthly cash flow, savings rate, account balances, and portfolio performance against benchmarks.
A solid dashboard also separates market-driven growth from contribution-driven growth. That way, you may see what changed because markets moved and what changed because of your own deposits or withdrawals.
Deeper views: allocation, tax lots, and wash sale risk
Once the basics are in view, the next layer gets more useful. This is where a dashboard may show what no single account view shows on its own.
For example, it may show your overall stock, bond, and cash allocation, plus signs of allocation drift that some investors may review when thinking about rebalancing. It may also point out uninvested cash sitting idle in brokerage accounts.
A dashboard may also show debt balances and rates, which may make the cost of carrying debt easier to see. On the tax side, it may show realized and unrealized gains, separate short-term and long-term positions, and flag tax-loss harvesting candidates. It should also flag wash sales, where a loss in one account may be disallowed by a nearly identical purchase in another within 30 days.
Balance tracker versus insight-driven dashboard: what is the difference
A simple balance tracker shows what you have. An insight-driven dashboard shows why it may matter and what some investors may consider next. That gap becomes clear in the way the data appears.
| Feature | Balance Tracker | Insight-Driven Dashboard |
|---|---|---|
| Investment data | Total value of holdings | Performance vs. benchmarks, allocation drift |
| Tax visibility | None | Tax lots, short- vs. long-term gains, wash sale risk |
| Risk view | Account-level balances | Cross-account concentration and ETF overlap |
| Actionability | Needs manual analysis | Flags rebalancing and tax-aware opportunities |
| Context | Raw data | Insights and benchmarks |
Mezzi gives self-directed investors analysis without placing trades or moving money. Once the full picture is clear, the next question may be what it helps you decide.
What a financial dashboard helps you decide
A dashboard matters most when it changes decisions, not just convenience. So the next question is pretty simple: what does that added visibility may help you decide?
Risks and costs that are easy to miss across separate accounts
A lot of the value may come from spotting risks that no single account view may show on its own. Concentration risk is one of the most common examples. If you hold company stock through RSUs and also own that same stock inside your 401(k), one account by itself may not show how much of your net worth may be tied to a single company. A dashboard brings that exposure into one view.
Fee drag is another cost that may stay hidden when accounts sit in separate places. Small annual fee differences may compound over time into larger long-term shortfalls. Allocation drift may also be easier to spot when all accounts appear together instead of in separate tabs and logins.
How better visibility supports tax-aware decisions
That same cross-account view may also make tax decisions easier to read. A unified dashboard may make tax-loss harvesting opportunities easier to spot across taxable accounts. It may also flag wash sale risk across accounts before a loss may be disallowed. And it may support asset location by showing which assets may fit better in taxable accounts versus retirement accounts.
Faster answers on rebalancing and retirement readiness
The same visibility may also speed up two common decisions: rebalancing and retirement planning. It may show when rebalancing is due across accounts. A dashboard may also show whether your savings rate, contributions, and target retirement age may still keep you on track.
Do you need a financial dashboard
Financial Dashboard vs. Balance Tracker: What Each Shows Investors
A dashboard may be worth it when financial complexity starts creating blind spots.
When a dashboard is worth it
A dashboard may earn its keep when things get messy enough that you no longer have a clean view of your money. That may apply if you're managing accounts across multiple brokerages, several 401(k)s, taxable accounts, RSUs, or 529 plans. The same may be true if you coordinate money decisions with a spouse or partner.
Without one central view, it may be harder to see how your money lines up with different time horizons. It may also be harder to tell whether near-term goals are being funded with assets that carry more risk than you intended.
A dashboard may make it easier to spot concentration risk, portfolio drift, and tax timing issues before they turn into costly surprises. If you spend time reconciling spreadsheets or making decisions by guesswork, a dashboard may be worth a closer look. A quick checklist may help show whether that complexity is enough to justify the cost.
When a dashboard may not be necessary
If you have one main account, use target-date funds, and have little taxable investing, a dashboard may not be necessary. In that case, your account portal and a basic spreadsheet may be enough. If that sounds like your setup, the next step may be asking whether the cost still makes sense.
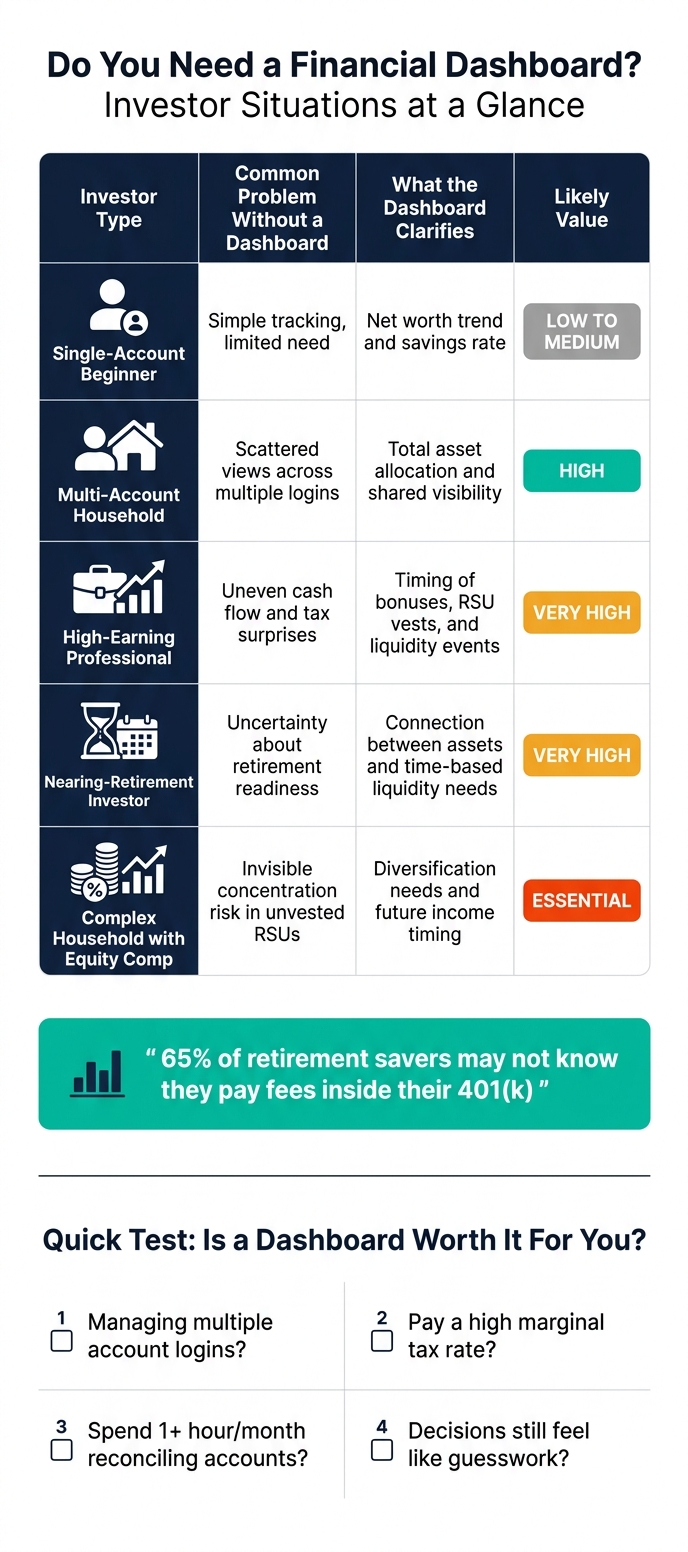
Investor situations, common blind spots, and dashboard value: a comparison
| Investor Type | Common Problem Without a Dashboard | What the Dashboard Clarifies | Likely Value |
|---|---|---|---|
| Single-account beginner | Simple tracking, limited need for a dashboard | Net worth trend and savings rate | Low to Medium |
| Multi-account household | Scattered views across multiple logins | Total asset allocation and shared visibility | High |
| High-earning professional | Uneven cash flow and tax surprises | Timing of bonuses, RSU vests, and liquidity events | Very High |
| Nearing-retirement investor | Uncertainty about retirement readiness | Connection between assets and time-based liquidity needs | Very High |
| Complex household with equity comp | Invisible concentration risk in unvested RSUs | Diversification needs and future income timing | Essential |
That gap between what you can already see and what you may be missing may be a simple way to judge whether a dashboard clears your bar for value.
How to decide if a financial dashboard is worth paying for
A simple checklist: accounts, taxes, time, and confidence
If the dashboard’s value still feels unclear, these four questions may help test it.
How many accounts are you managing? If you manage several separate logins, the visibility gap alone may justify the cost.
How much does tax timing matter to your portfolio? If you pay a high marginal rate, wash-sale and tax-loss alerts may pay off fast.
How much time do you spend reconciling accounts? If you spend more than an hour a month reconciling accounts, that time may carry a real cost. A dashboard that updates automatically may change that equation.
How confident are you turning data into decisions? If your decisions still feel like guesswork, a dashboard may be worth the cost.
What Mezzi offers self-directed investors

If those answers point to yes, the next question may be which dashboard fits a self-directed investor.
Mezzi is built for self-directed investors who want one read-only view across their accounts. You connect all your accounts - 401(k), Roth IRA, taxable brokerage, HSA, and more - through read-only access via Plaid and Finicity. Your assets stay exactly where they are. No transfers required.
These are the gaps Mezzi is designed to surface. Once connected, Mezzi shows one view across all accounts. It surfaces overlapping holdings, tax-loss opportunities, wash-sale risk, and rebalancing signals in one place. Mezzi gives analysis and alerts; you keep control of execution. Mezzi surfaces the analysis; you make the decision.
Conclusion: when scattered accounts create blind spots, a dashboard earns its keep
That is the practical test: does the dashboard reveal enough that it changes what you do next?
When scattered accounts create blind spots, a dashboard may earn its keep by making fees, taxes, allocation, and risk visible at once.
FAQs
How is a dashboard different from a spreadsheet?
A dashboard is designed to give you one up-to-date view of your finances. A spreadsheet, by contrast, is often a manual tool that may need regular data entry, updates, and recalculations.
Dashboards usually automate data collection and show information visually, which may make it easier to scan and understand at a glance. Spreadsheets offer more control and flexibility, but they often take more work to maintain and may be easier to ignore or update incorrectly.
Can a dashboard help me catch hidden 401(k) fees?
Yes. A dashboard may help you spot hidden 401(k) fees by pulling account data into one place and highlighting fee details.
It may also make costs easier to see next to account performance, so you may better understand what you’re paying.
Is a financial dashboard worth paying for?
It may be, especially if it gives you a clear, consolidated view of your finances across bank accounts, investments, retirement accounts, and debts.
A paid dashboard may help you track net worth, investment performance, cash flow, fees, and asset allocation in one place. For people managing multiple accounts or more complex finances, that may save time, reduce manual errors, and support better decisions.
Related Blog Posts
Table of Contents
Book Free Consultation
Walk through Mezzi with our team, review your current situation, and ask any questions you may have.