
Your 401(k) dashboard might look helpful, but it only scratches the surface. It doesn’t show how all your accounts work together, misses tax inefficiencies, and fails to highlight overlapping investments. These gaps may result in additional costs over time.
Here’s what you need to know:
- Your 401(k) provides limited insights: It focuses on one account, ignoring IRAs, HSAs, and taxable accounts.
- Tax inefficiencies are costly: Holding the wrong investments in the wrong accounts can quietly reduce your returns.
- Hidden portfolio overlaps increase risk: You might unknowingly have too much exposure to certain stocks or sectors.
- AI tools offer better solutions: Platforms like Mezzi analyze all your accounts, flag tax issues, and suggest smarter allocation strategies.
3 Essential Tools to Evaluate Your Investment Portfolio
Tax Inefficiencies That Reduce Your Returns
Tax-Efficient Asset Location Strategy for Retirement Accounts
Your 401(k) dashboard may show your account balance, but it doesn’t account for tax drag - the yearly toll taxes take on dividends and interest, quietly eating into your compounding returns. For instance, if you have $10,000 invested in a high-income fund like JEPI in a taxable account rather than a Roth IRA, you may experience higher taxes over a decade. Think of tax drag as an invisible expense ratio, steadily eroding your gains. Let’s break down the specific tax pitfalls that can impact your retirement accounts.
Common Tax Problems in Retirement Accounts
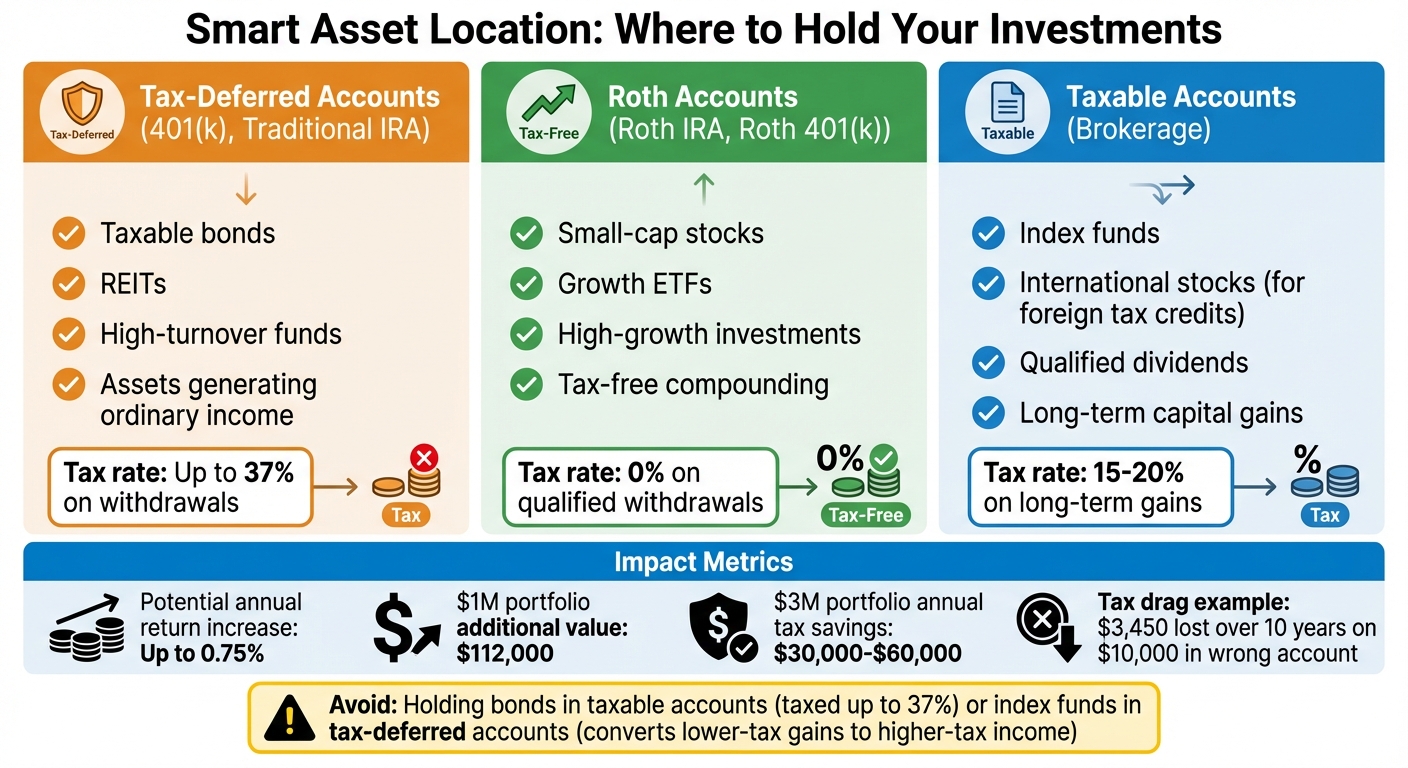
One of the most expensive tax mistakes is poor asset placement. For example, holding taxable bonds or REITs in a brokerage account subjects you to ordinary income taxes as high as 37%. Meanwhile, placing index funds - which typically generate long-term capital gains taxed at 15–20% - in a tax-deferred account turns those lower-tax gains into higher-taxed income. This mismatch, known as negative rate arbitrage, can reduce after-tax returns over time.
Another issue that often flies under the radar is lost foreign tax credits. If you hold international equity funds in an IRA or 401(k), you lose the foreign tax credits that are only available in taxable accounts. Additionally, wash sale risks can create complications. For instance, if you sell a fund in a taxable account at a loss and then repurchase a similar one in your 401(k), the IRS disallows the loss deduction. Unfortunately, most account dashboards don’t warn you about these risks across multiple accounts.
Then there’s the problem of required minimum distributions (RMDs). Starting at age 73, you’re forced to withdraw a portion of your tax-deferred accounts, even if you don’t need the income. These mandatory withdrawals can push you into higher tax brackets and even increase your Medicare premiums two years down the line.
Asset Location Strategies for Lower Taxes
To address these tax challenges, consider fine-tuning your asset location strategy. This involves strategically placing assets in the right accounts to reduce your tax burden. Here’s how:
- Use tax-deferred accounts for assets that generate ordinary income, such as taxable bonds, REITs, and high-turnover funds.
- Reserve Roth accounts for high-growth investments like small-cap stocks or growth ETFs, allowing tax-free compounding.
- Place index funds that yield qualified dividends and long-term capital gains in taxable accounts to benefit from lower tax rates and a step-up in basis.
- Keep international stocks in taxable accounts to take advantage of foreign tax credits.
"Wealthier people should be as focused on tax allocation as they are on asset allocation. And they're not." – Ted Jenkin, CFP and Founder, oXYGen Financial
Strategic asset placement can improve after-tax outcomes. For example, proper asset location may increase after-tax returns. Over time, this adds up. A $1 million portfolio may see a higher final value, while a $3 million portfolio may experience lower taxes by reducing tax drag. Tools like Mezzi’s can help automate this process, helping you pursue growth while considering tax implications.
Important: This information is for educational purposes only and is not intended as tax advice. Always consult a qualified tax professional for guidance tailored to your specific situation.
Finding Hidden Overlaps and Exposures
Your 401(k) dashboard might list a variety of funds, but what it often doesn’t show is how many of these funds hold the same underlying stocks. For instance, you might own an S&P 500 index fund alongside a large-cap growth ETF - both of which could allocate 5–7% to companies like Apple and Microsoft. Without realizing it, this overlap could result in 10–15% of your portfolio being concentrated in just two companies, increasing your exposure to risk. Addressing such overlaps may help reduce portfolio risk. That’s where Mezzi’s X-Ray tool comes in, helping to uncover these hidden overlaps.
Using X-Ray Analysis to Uncover Duplicate Holdings
Unlike standard dashboards, Mezzi’s X-Ray tool digs deeper by breaking down ETFs and mutual funds to reveal the individual securities they contain. This allows you to see exactly what you’re invested in. By analyzing all your linked accounts - whether it’s your 401(k), IRA, or taxable brokerage - the tool calculates overlap percentages and highlights where your holdings duplicate. For example, if you own both a tech-focused ETF and a total market fund, X-Ray might show that 25% of your portfolio is tied up in FAANG stocks. This level of detail makes it possible to identify where your diversification strategy may need adjustment.
Reducing Risk by Diversifying Smarter
Once you’ve pinpointed these hidden overlaps, you can take steps to spread your risk more effectively. Imagine a $500,000 401(k) split between two tech-heavy ETFs with a 25% overlap in FAANG stocks. By reallocating to broader index funds, you may reduce concentrated exposure and potentially lower portfolio volatility. Additionally, a more diversified portfolio may reduce drawdowns during market downturns. The takeaway? True diversification comes from looking beyond fund names and understanding the actual investments within your portfolio.
AI-Powered Asset Allocation Advice
Building on the challenges of tax inefficiencies and portfolio overlaps, AI tools now offer asset allocation suggestions that consider your unique financial situation.
Take a 2045 target-date fund in your 401(k) as an example. While it provides a basic, age-based strategy, it doesn’t consider your personal risk tolerance, tax situation, or other investments. Tools like Mezzi go further by analyzing all your linked accounts to deliver personalized allocation suggestions. This approach fills the gaps left by traditional dashboards and helps create a more dynamic and responsive portfolio strategy.
Rebalancing Guidance and Risk Alerts
AI tools don’t just provide static snapshots - they actively monitor your portfolio to address potential issues before they escalate. For instance, if a 45-year-old investor has 70% of their portfolio in domestic stocks but their target is 60%, the AI might recommend reallocating 10% to international bonds. This shift may help reduce volatility over time.
These tools also evaluate sector imbalances, like being overly concentrated in utilities while underweight in healthcare, and suggest rebalancing to support your financial objectives. Real-time alerts can flag hidden risks by identifying overly correlated assets, helping you avoid unintended concentration. Additionally,Monte Carlo simulations provide a probabilistic view of retirement longevity, forecasting whether your withdrawal strategy is sustainable over time. These insights help you adjust your approach in response to market changes.
But AI doesn’t stop at immediate fixes - it’s also about planning for the future.
Building Better Allocation Plans for Long-Term Growth
AI tools are designed to look ahead, crafting strategies that help manage your investments across various accounts, such as 401(k)s, IRAs, HSAs, and taxable accounts. For example, they might recommend placing tax-inefficient investments like bonds and REITs in tax-deferred accounts while positioning tax-efficient ETFs in taxable accounts to reduce tax drag. These strategies complement the tax-aware rebalancing methods discussed earlier.
Here’s a real-world example: A user with a $500,000 401(k) discovered, through an AI tool, that they were paying high fees (1.2%) and lacked proper diversification. The AI suggested shifting to low-cost index funds and adjusting the allocation to a 60/40 stock-to-bond mix. This change was projected to result in a higher retirement balance and lower risk.
AI-driven tools are transforming how we approach asset allocation, making it more responsive and data-driven.
More Accurate Retirement Projections
Getting an accurate picture of your retirement readiness means more than just looking at your 401(k) balance. Most 401(k) dashboards show a single number - your projected balance at retirement. This estimate assumes a fixed retirement age, steady contributions, and average market returns. But it doesn’t factor in other accounts, your spending habits, or what happens if the market takes a downturn just as you’re about to retire.
AI-powered tools change the game by aggregating data across all your accounts - 401(k)s, IRAs, HSAs, and taxable brokerage accounts. These tools don’t just base projections on age; they analyze your real financial behavior, including income, spending, and debt. With 59% of Americans participating in retirement savings plans, having a clearer, more complete forecast is crucial. AI tools bring all these pieces together, offering a broader view of your financial situation.
Modeling Withdrawal Sustainability
The big question isn’t just "How much will I have?" but "Will it last?". AI tools use Monte Carlo simulations to answer this. These simulations run thousands of market scenarios to see how your portfolio might perform under varying conditions. For instance, with a $1 million portfolio and $50,000 annual withdrawals, simulations may estimate the likelihood that funds last a certain period, even after accounting for inflation, fees, and market fluctuations.
These tools also prepare you for worst-case scenarios. They model the impact of market crashes, unexpected medical expenses, or higher-than-anticipated inflation. If a shortfall appears likely, you can make adjustments - like increasing contributions or reducing withdrawals - before it’s too late. Traditional dashboards, which rely on static assumptions, simply can’t match this level of detail and adaptability.
Standard Projections vs. AI-Enhanced Forecasts
AI-enhanced forecasts go beyond static estimates by continuously updating as your financial situation evolves. Standard 401(k) dashboards typically provide a single projection based on your age, risk tolerance, and contributions. They don’t account for other investment accounts, actual spending patterns, or how fees can compound over time. In contrast, AI-enhanced tools integrate data from all your accounts, factor in real-time market conditions, and tailor projections to your unique financial circumstances.
For example, platforms like Mezzi pull data from all your connected accounts to create a comprehensive strategy. They can model how to sequence withdrawals - for instance, deciding when to draw from a Roth IRA versus a traditional 401(k) - to minimize taxes and maximize your savings. This approach highlights opportunities and risks that single-account dashboards completely overlook. And because these forecasts adapt to changes in your life, they offer insights that update as your financial circumstances change.
Conclusion
Key Takeaways for Better Retirement Planning
Your 401(k) dashboard might not tell the whole story when it comes to retiring comfortably. Factors like tax inefficiencies can quietly chip away at your returns - potentially by 0.5% to 1% annually - while hidden overlaps in your portfolio could leave you exposed to unnecessary risks. The key to a sustainable retirement lies in personalized asset allocation that reflects your unique financial situation, rather than relying on cookie-cutter, age-based formulas.
To get the most out of your savings, you need to address these issues head-on. For example, placing bonds and REITs in tax-advantaged accounts while holding stocks in taxable accounts may improve tax efficiency. Tools like X-Ray analysis can help you spot duplicate exposures across ETFs, helping you avoid duplicative fees for overlapping holdings. And with AI-driven rebalancing, your portfolio may be adjusted as market conditions or your risk tolerance change, rather than relying solely on outdated, static assumptions. These strategies may help improve your financial outcomes.
What Makes Mezzi Different

Mezzi takes these insights and turns them into a seamless, data-driven strategy. By connecting all your accounts - 401(k)s, IRAs, taxable brokerage accounts, and even HSAs - through read-only access, Mezzi provides a complete view of your financial landscape. This allows for smarter tax planning, like identifying the right timing for Roth conversions or avoiding wash sale risks - things that single-account dashboards often overlook.
One standout feature is Mezzi's X-Ray tool, which uncovers hidden stock overlaps and over-concentrations in your portfolio. It doesn’t just point out the problem; it offers steps to address it. On top of that, Mezzi’s AI-driven recommendations provide suggestions for rebalancing, risk management, and projecting growth based on your holdings and tax situation - not generic industry benchmarks. You get insights that supplement those available from traditional platforms.
With Mezzi, you gain access to personalized, actionable guidance that empowers you to make smarter decisions. Whether you're focused on ensuring your withdrawals last or setting up your portfolio for long-term growth, Mezzi offers tools and advice that go far beyond what standard 401(k) platforms can deliver. It’s about giving you the confidence to take control of your financial future, backed by real data and insights.
FAQs
How do I know if I have tax drag?
Tax drag occurs when taxes on capital gains, dividends, or interest eat into your portfolio's growth. It's like a hidden fee that slows down your investment progress. You can often spot tax drag by looking for high turnover rates or inefficient asset placement - both of which can lead to higher taxes in taxable accounts.
The good news? Tools powered by AI can help. They analyze your portfolio to pinpoint inefficiencies and highlight ways to improve your after-tax returns. If you notice a big gap between your pre-tax gains and after-tax returns, chances are tax drag is playing a role.
How can I spot overlapping holdings across accounts?
Mezzi's AI-powered X-Ray feature makes it easy to spot overlapping holdings in your portfolio. It highlights duplicate securities, sectors, or asset classes, giving you a clear view of potential concentration risks. Regularly reviewing these overlaps ensures you can address unintended exposures. Plus, Mezzi's Portfolio Overlap Checker scans for redundancies, helping you rebalance effectively and diversify your investments. By tackling overlaps, you can lower risks, cut unnecessary fees, and create a more balanced portfolio.
What should I rebalance first to lower risk?
To manage risk effectively, begin by tackling over-concentration in your portfolio. This means reducing heavy exposure to specific stocks, sectors, or investment strategies - particularly employer stock or any sector or style that dominates your holdings (like growth or value). Regular rebalancing is key here. Tools like Mezzi can help you diversify your investments, spreading risk across different issuers and categories. This approach helps reduce volatility and limits the potential for significant losses tied to a single area.
Related Blog Posts
Table of Contents
Book Free Consultation
Walk through Mezzi with our team, review your current situation, and ask any questions you may have.