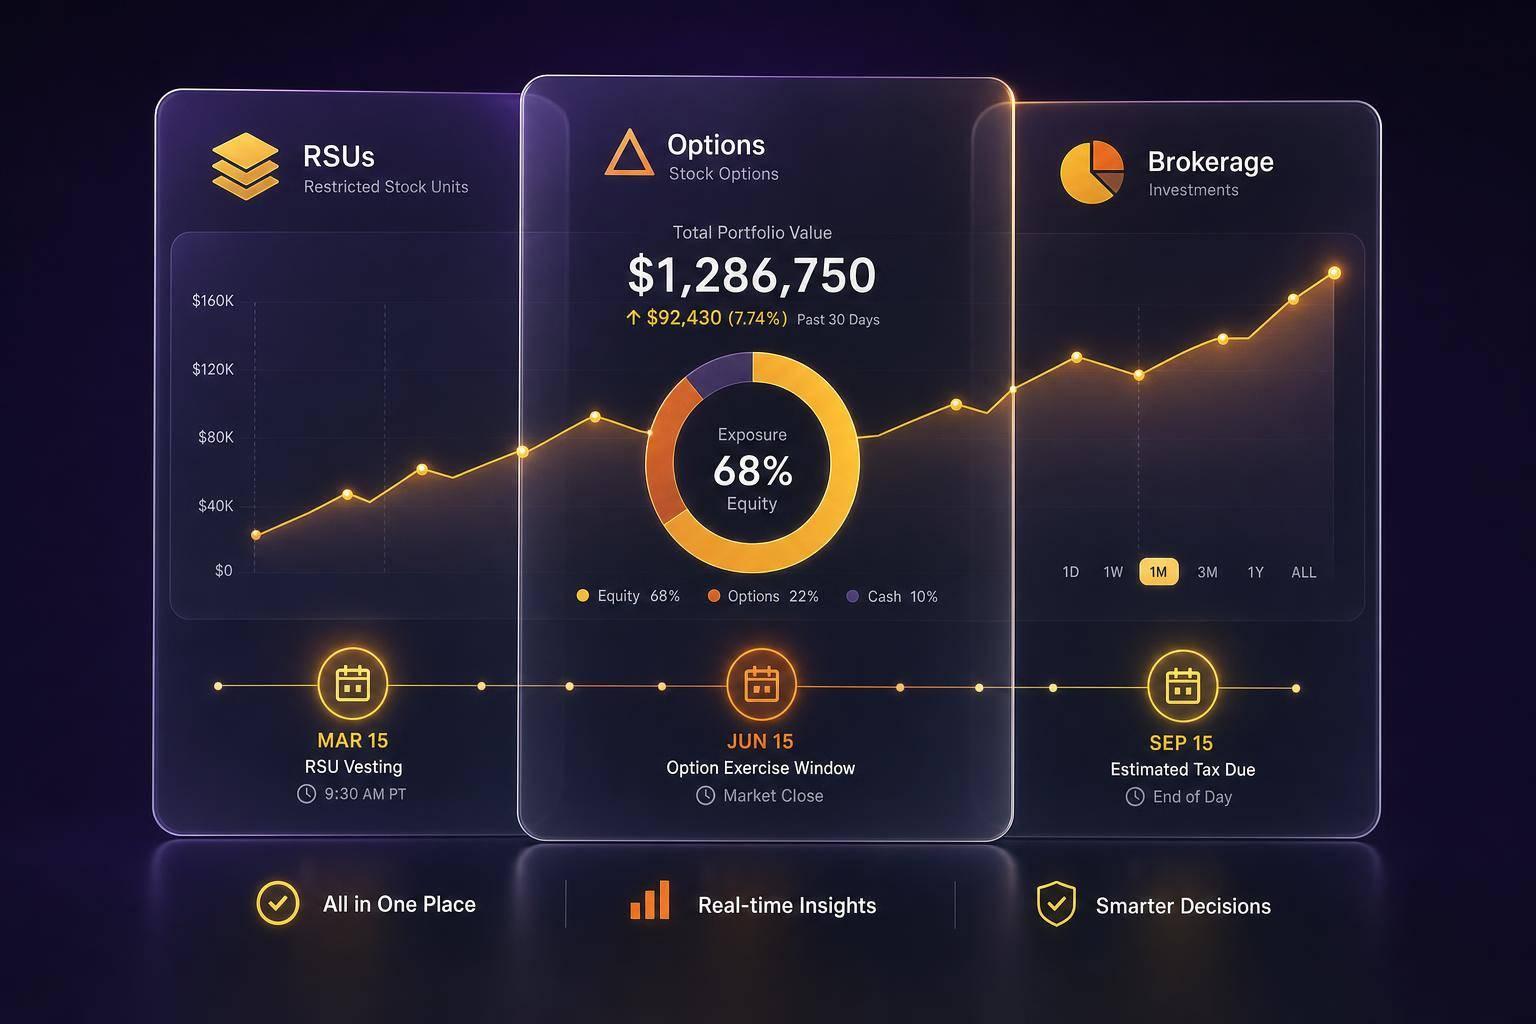
If your money sits in three portals, your risk may be split in three places too. A single dashboard may give you one view of RSUs, stock options, and taxable brokerage holdings so you may track exposure, tax dates, and sell timing without jumping between accounts.
Here’s the short version:
- RSUs may need vest dates, fair market value at vesting, and tax withholding records
- Options may need strike price, vesting, expiration date, and exercise history
- Brokerage holdings may need cost basis, holding period, dividends, and realized gains
- A combined view may make it easier to spot employer stock concentration, missed option deadlines, and tax lot issues
- Some investors use alerts for upcoming vesting, expiration dates, and wash sale windows
- A common rule of thumb may be to flag a single position above 10% of total portfolio value or a sector above 30%
The setup is fairly simple: connect each account with read-only access, check the imported share counts against statements, then keep one master view plus a couple of filtered views for employer equity and taxable accounts.
That way, I may see the full picture in one place instead of piecing it together across separate logins.
Quick Comparison
| Asset | Main fields | Main tax event | Date to watch | What a combined view may show |
|---|---|---|---|---|
| RSUs | Grant date, vest schedule, FMV, withheld shares | Vesting | Vest date | Employer stock exposure |
| Options | Strike price, vesting, expiration, exercise history | Exercise or sale | Expiration date | Time-sensitive grants that may lose value |
| Brokerage holdings | Cost basis, holding period, dividends, gains/losses | Sale | 1-year holding mark | Tax lot choices and wash sale risk |
If I keep those fields current after each grant, vest, exercise, or sale, the dashboard may stay useful for day-to-day tracking and year-end tax review.
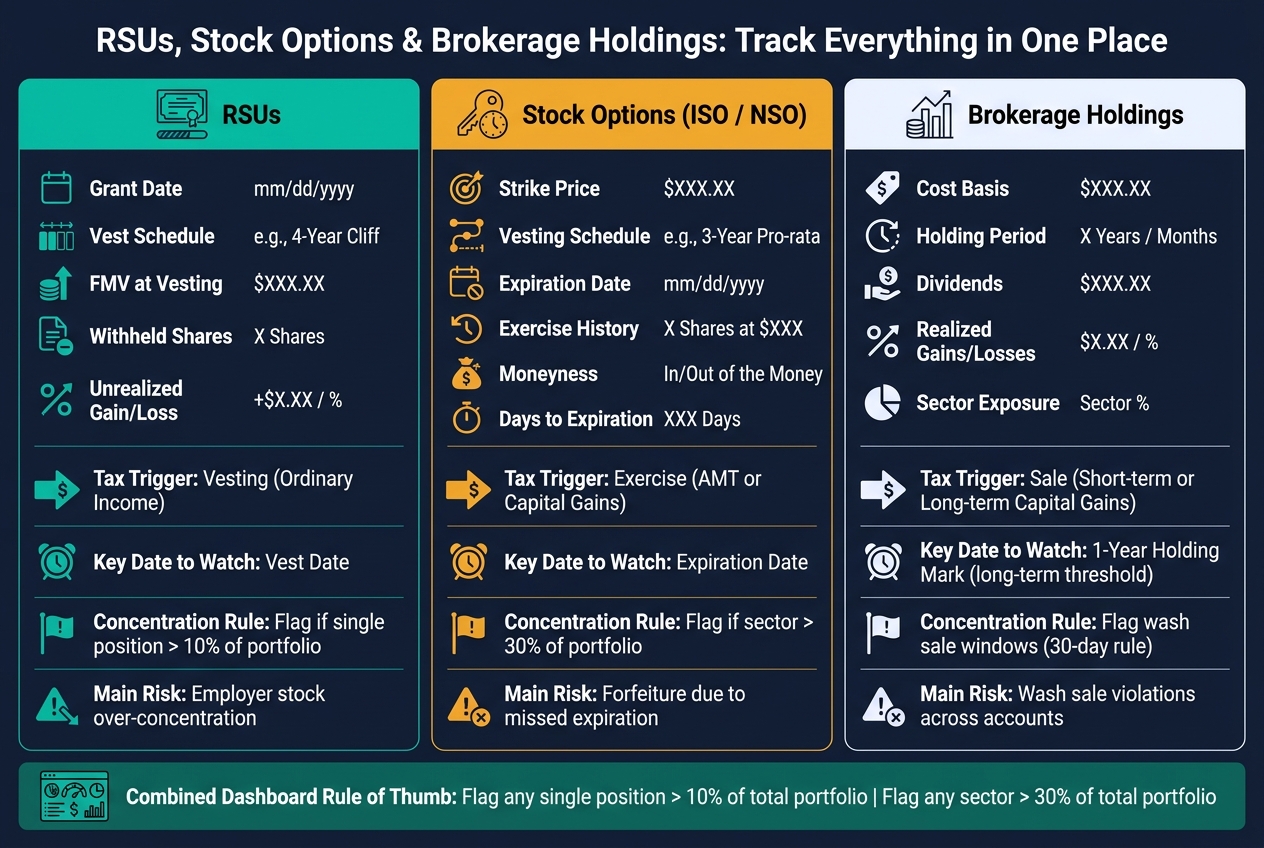
RSUs vs. Stock Options vs. Brokerage Holdings: Key Tracking Fields at a Glance
Step 1: connect every account and create a single source of truth
List your data sources before you start
Start by listing every account that holds investments, including old employer plans. That may include employer equity portals like E*Trade, Schwab, or Morgan Stanley for RSUs and options, retirement accounts, taxable brokerage accounts, and invested HSAs.
For equity grants, save the plan documents too. Account feeds may miss vesting schedules and expiration dates, and those details may matter later. Once your list is done, connect each account to the same dashboard.
Use read-only connections to pull balances, holdings, and transactions
Connect accounts through read-only access so Mezzi may pull balances, holdings, and transactions without moving money. Mezzi never sees your actual brokerage login credentials. The connection uses tokenized access, which you may revoke at any time through your brokerage's security settings.
That synced data may become your single source of truth.
After connecting, cross-check share counts against your most recent brokerage statements. This quick check may catch data gaps early, especially in equity plan accounts where grant details may get messy.
Set up one master view with optional filtered views
After the accounts sync, split the data into one master view and a couple of focused views. Use the master view for total allocation. Then create filtered views for employer equity and taxable accounts.
An employer equity-only view may keep vesting timelines and grant details front and center. A taxable-only view may make it easier to review positions for tax-loss harvesting or other tax-aware moves. Both views pull from the same data, so you may get a cleaner way to look at the same picture.
Tracking employee stock options
Step 2: track the right fields for RSUs, options, and brokerage holdings
With your accounts synced, define the fields that matter for each asset type. Once the connections are in place, track the details tied to tax, timing, and allocation.
RSUs: grant date, vest schedule, FMV at vesting, and shares withheld
For each RSU grant, track Grant ID, grant date, vesting schedule, units granted, units vested, unvested units, FMV at vesting, shares withheld for taxes, and current unrealized gain/loss on vested shares.
FMV at vesting may set the tax basis for later capital gains. It also helps to track shares withheld for taxes as a separate field so you may compare withholding with what your final tax bill may look like.
Options: strike price, vesting, expiration date, and exercise history
Options need a different set of fields because their value and tax treatment may change before and after exercise. Track option type (ISO or NSO/NQSO), grant date, vesting schedule, strike price per share, shares vested and unvested, and expiration date. If options have been exercised, also log the exercise date, number of shares acquired, cash paid to exercise, and whether you sold the shares immediately.
It may also help to keep moneyness and days to expiration in view. Those two fields may make it easier to judge whether an option still has value and how much time may be left to act. The ISO vs. NSO distinction may also shape how some people think about exercise and sale timing.
Brokerage accounts: cost basis, holding period, dividends, and realized gains
Taxable holdings need their own lot-level fields. Track ticker, share count, current price, cost basis, holding period, realized gains/losses, dividends received, and sector exposure.
The holding period field may determine whether gains are treated as short-term or long-term. That difference may change your tax bill when deciding which tax lot to sell.
Step 3: build a dashboard that turns raw data into decisions
Put exposure, timelines, gains, and performance on one screen
Set up the dashboard so the most urgent items show up first. Put concentration, key dates, and gains in the top row. On one screen, it may make sense to show employer-stock exposure as a share of total portfolio value, upcoming vest dates, option expiration dates, realized and unrealized gains, and account-level performance.
A common rule of thumb may be to flag any single position that exceeds 10% of your total portfolio or any sector that exceeds 30%. Start with exposure. Then bring forward the dates and tax events that may call for attention. That way, one dashboard may help show what may need action first.
Use Mezzi to spot overlap, concentration, and tax issues across accounts

Mezzi's X-Ray feature scans across your RSUs, individual shares, and any ETFs or mutual funds in your brokerage accounts to show total exposure to a single stock, including indirect exposure that may be easy to miss. Beyond overlap, Mezzi surfaces tax-loss harvesting candidates year-round and flags wash sale risk across taxable accounts, notifying you when the 30-day wash sale window has passed so you can consider rebuying.
Here's the minimum view that makes the data usable.
Comparison table: RSUs, options, and brokerage holdings at a glance
| Asset Type | Key Fields to Track | Tax Trigger | Key Date | What It Helps You Catch |
|---|---|---|---|---|
| RSUs | Vest date, FMV at vesting, withheld shares | Vesting (Ordinary Income) | Vesting dates | Over-concentration in employer stock across all accounts |
| Stock Options | Strike price, expiration date, exercise history | Exercise (AMT or Capital Gains) | Expiration date | Forfeiture due to missed expiration |
| Brokerage Holdings | Cost basis, holding period, unrealized gain | Sale (Capital Gains) | 1-year mark (long-term) | Wash sale violations triggered in other accounts |
Each asset type has its own deadline and its own way of creating blind spots. Putting all three in one dashboard may turn a scattered set of accounts into a system that's easier to act on. Once this view is current, updating it after each grant, vest, exercise, or sale may take only minutes.
Step 4: maintain the system and use it for tax and retirement planning
Review new grants, vesting events, exercises, and cost basis accuracy
A dashboard only works if the data stays current. Log every trade right away, and update manual accounts every quarter.
Equity comp usually needs more hands-on checking. New RSU grants, extra grants, updated vesting schedules, and option strike prices may need manual review against your plan documents or a CSV export from your equity platform.
Match each vest to your plan records. Match each exercise or sale to your transaction history. Cost basis accuracy matters here too, since small errors may carry into tax reporting later.
Use the consolidated view for tax-aware moves and retirement tradeoffs
Once the data is up to date, use that same view for tax and retirement planning. The same dashboard may help track tax-loss harvesting and wash-sale timing.
And this is where a consolidated view starts to earn its keep. The same screen that shows concentration and deadlines may also shape your next review. If a large share of your projected retirement outcome may depend on employer stock, that concentration becomes a lot easier to spot when everything sits in one place instead of across separate account statements.
It may also help with asset location. Some investors place tax-inefficient assets in tax-advantaged accounts with the goal of improving after-tax returns over time.
Conclusion: the minimum system that keeps you informed
Connect every account, track the right fields, and review the system after each grant, vest, exercise, or sale. Keep the data current, and one dashboard may show exposure, deadlines, and tax impact in one place.
FAQs
How often should I update my dashboard?
For most investors, a monthly review may be enough to spot trends and keep tracking on course.
If you hold equity compensation, it may also make sense to check your account on each vesting date to confirm new shares were recorded correctly. Even if updates are automated, a monthly manual reconciliation may help confirm that dividends, stock splits, or trades were captured.
What should I do if imported RSU or option data looks wrong?
First, compare the imported data with your official brokerage or equity portal statements. If auto-sync isn’t available - or the numbers look off - use manual entry to fix share counts, cost basis, or vesting schedules.
Some tax-lot issues may take extra cleanup. ESPP discounts and incorrect 1099-B reporting are common examples. In cases like that, you may need to adjust cost basis manually so it matches fair market value at vesting.
Regular reviews may help keep net worth tracking and tax records aligned.
How can a combined view help me avoid tax mistakes?
A combined view may make it easier to avoid costly tax mistakes because it shows your equity and brokerage accounts in one place. With that setup, tracking cost basis for assets like ESPPs and RSUs may get simpler, which may reduce the chance of misreporting or overstating capital gains.
It may also make it easier to spot tax-loss harvesting opportunities, manage tax withholding, and plan for large vesting events. For some people, that may lower the chance of overpaying or running into tax bills they didn’t expect.
Related Blog Posts
Table of Contents
Book Free Consultation
Walk through Mezzi with our team, review your current situation, and ask any questions you may have.