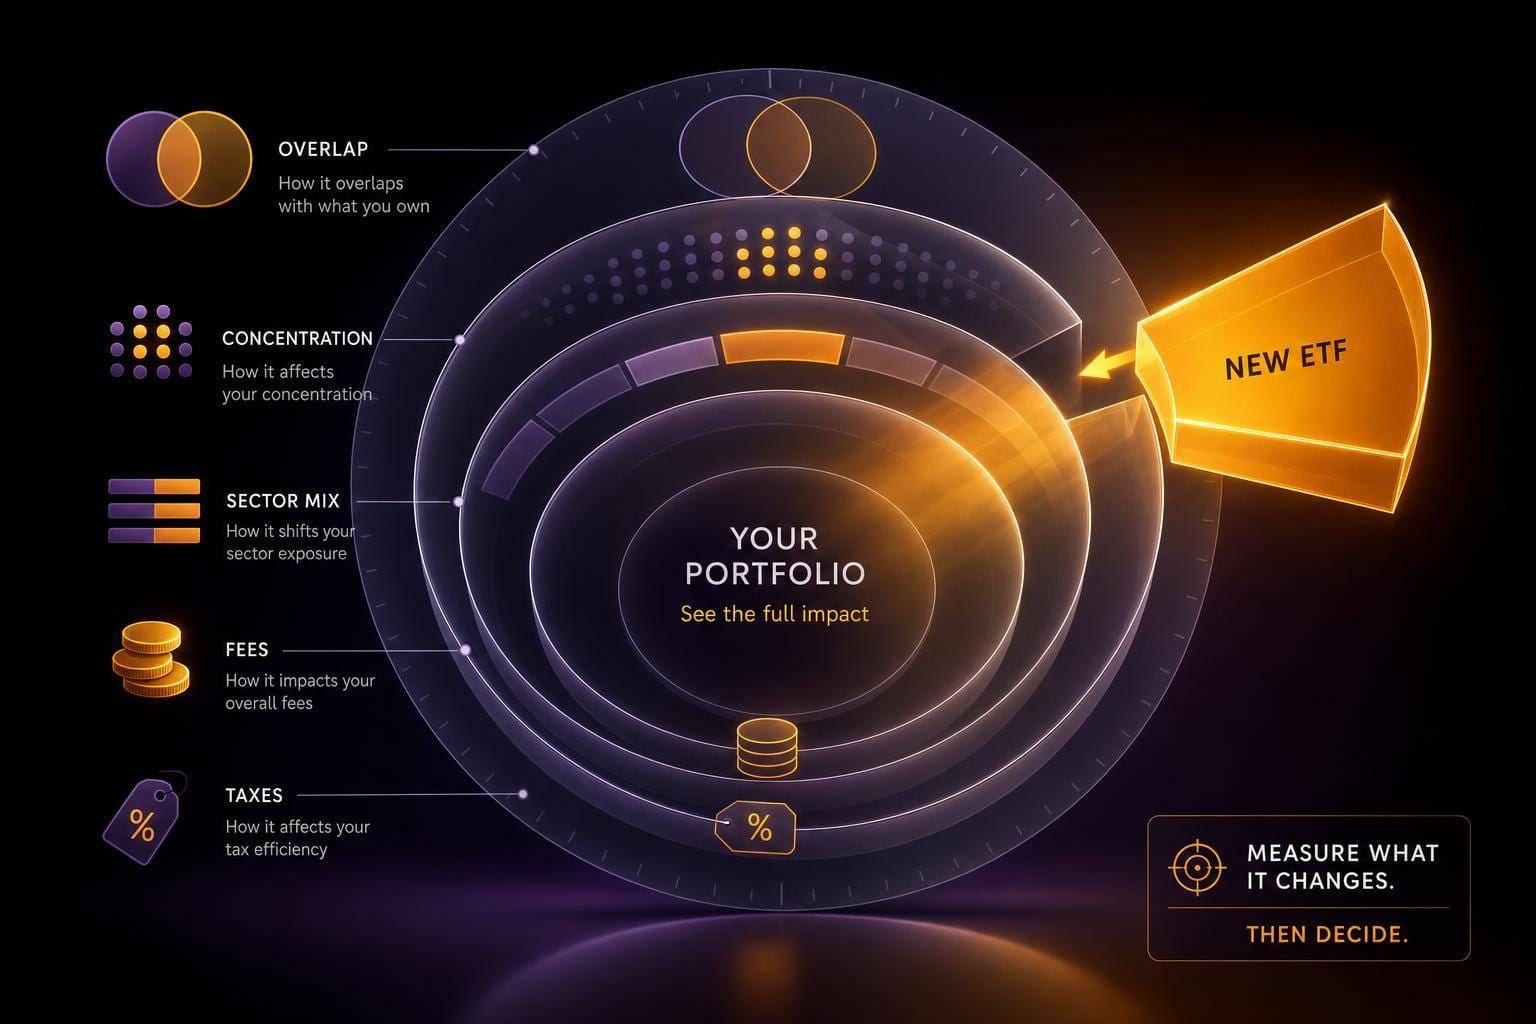
A new ETF may change less than it seems. With about 5,100 U.S. ETFs and roughly $14.9 trillion in assets as of 4/30/2026, a new fund may look different on the surface but still leave your portfolio with almost the same stock, sector, and tax mix.
Here’s the short version: before I add an ETF, I may get a better read by checking what changes after the trade, not by looking at the fund alone. That usually means reviewing:
Overlap with what I already own across taxable, IRA, Roth IRA, and 401(k) accounts
Top holdings concentration, especially in mega-cap U.S. tech names
Sector and country mix after the purchase
Yield and tax treatment, including qualified dividends vs. ordinary income
Total cost, not just the expense ratio
Volatility impact on the full portfolio
A few examples make the point fast:
VOO and QQQ may overlap by about 53.5%
VTI and QQQ may overlap by about 47%
A fund with a 0.75% fee may cost about $720 more per year than a 0.03% fund on a $100,000 position
That means a “growth,” “dividend,” or “innovation” label may not tell me much by itself. I may still end up with more exposure to the same names - like Apple, Microsoft, Nvidia, Amazon, Alphabet, and Meta - while adding cost, tax friction, or extra swings.
The ETF Overlap Nobody's Talking About
Quick Comparison
| Check | What I may look for | What it may tell me |
|---|---|---|
| Overlap | Shared holdings and weighted overlap | Whether the ETF may mostly duplicate current exposure |
| Concentration | Top positions after the trade | Whether a few stocks may take up too much of the portfolio |
| Sector mix | Tech, financials, healthcare, etc. | Whether the ETF may add a tilt instead of diversification |
| Country mix | U.S. vs. non-U.S. exposure | Whether it may fill a geography gap |
| Income and taxes | Qualified dividends, ordinary income, fund turnover | Whether after-tax return may change |
| Total cost | Expense ratio, spread, liquidity, tracking gap | Whether the fund may cost more than it first appears |
| Volatility | Portfolio risk before and after | Whether the combined mix may swing more or less |
So the filter may be simple: if the ETF does not fill a gap or add a clear tilt, it may just add another ticker.
What Adding a New ETF Actually Changes
A new ETF only changes your portfolio if it changes your exposure, risk, income, or taxes. That’s the main point. The better question isn’t whether the ETF looks good on its own. It’s what your portfolio may look like after the trade.
That means checking a few things side by side: diversification, sector and country exposure, fees, income, volatility, and taxes.
Diversification, concentration, and look-through exposure
To do that well, you need look-through exposure. In plain English, that means you don’t treat an ETF as one neat line item. You look through the fund to the stocks it actually holds, then compare those holdings with the rest of your portfolio.
So yes, the ticker matters. But the holdings matter more.
If you add a tech ETF to VTI or VOO, you may not get much new exposure at all. In many cases, you may just end up with more weight in the same mega-cap names. Your total number of holdings may barely change, while a small group of giant stocks may take up more of the portfolio.[2][3]
A simple rule of thumb may help:
Above 80% overlap by weight usually points to a near-duplicate
Below 20% overlap usually means the fund adds new diversification
For example, adding an international small-cap or emerging markets ETF to a VTI-based portfolio may bring in holdings with much less overlap. That may offer more diversification than adding another U.S. stock ETF with a different label.
After exposure, the next step is to check what the fund may do to cash flow and taxes.
Income, volatility, and account placement
A high-dividend ETF may lift your portfolio yield, but it may also shift more of your distributions into ordinary income, which may be taxed at higher rates. Broad U.S. equity ETFs often produce a higher share of qualified dividends, which may be taxed at the lower 0%, 15%, or 20% long-term capital gains rates. By contrast, a high-yield bond ETF or REIT ETF may distribute ordinary income, which may add tax drag in a taxable account. That same fund held in a Traditional IRA or 401(k) may defer taxes until withdrawal.[5][7]
Because of that, broad, low-turnover equity ETFs may be a better fit for taxable accounts, while high-yield bond funds, REITs, and covered-call ETFs may fit more naturally in tax-advantaged accounts.
Risk may shift too. Concentrated sector or thematic ETFs may increase volatility and may lead to deeper drawdowns, even if recent performance looks strong. An investment-grade bond ETF, on the other hand, may lower total portfolio volatility and may cushion stock selloffs. What matters is the combined risk profile of the full portfolio after the trade, not just the past record of the new fund by itself.[4][6]
Next, compare sector, country, cost, and tax impact before you buy.
How to Check Overlap and Hidden Concentration
Before comparing sector mix, country exposure, fees, or tax impact, check overlap first. That may show whether an ETF actually changes your portfolio at all. That's the main test.
Compare VTI, VOO, and QQQ by what they actually hold
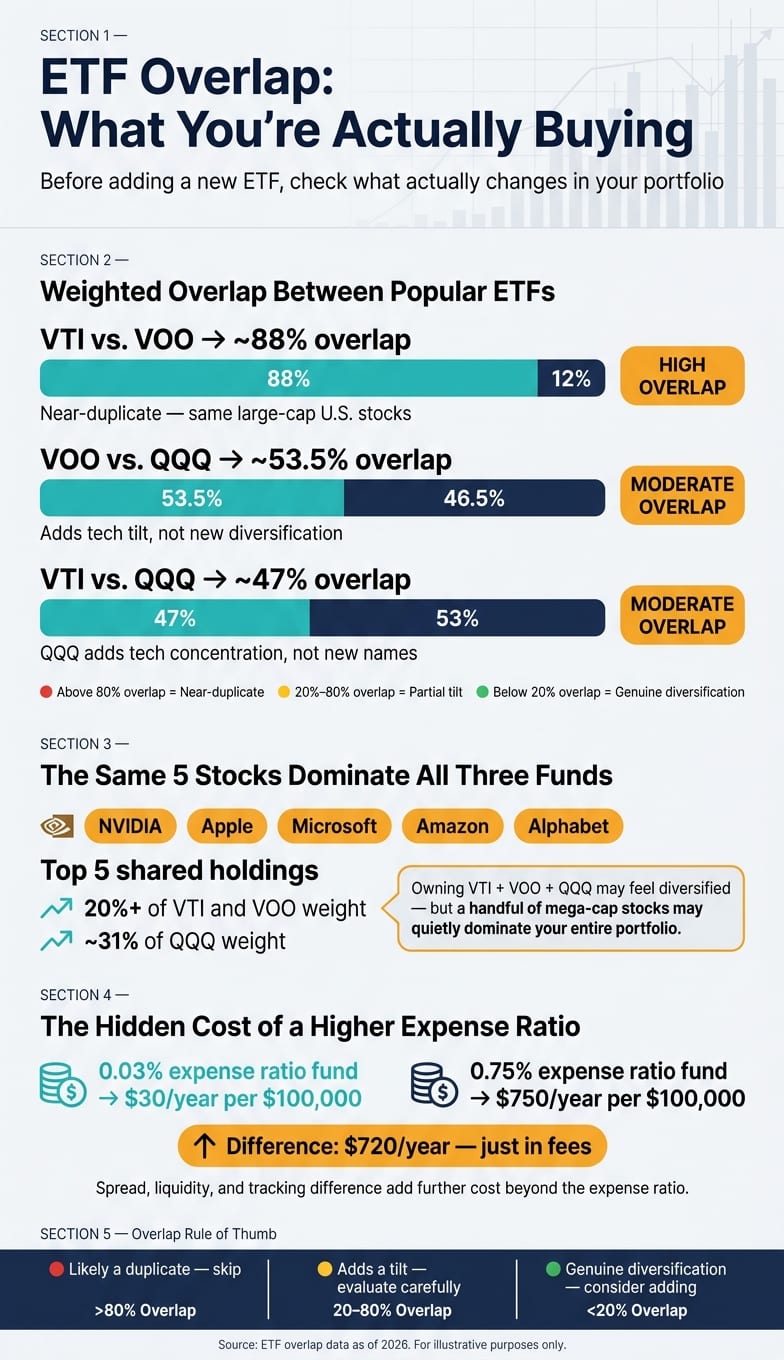
VTI and VOO share more than 500 stocks and overlap by roughly 88% by weight [9][1]. In plain English, much of the money in both funds may sit in the same large-cap companies. Adding VTI on top of VOO may give you a bit more mid- and small-cap exposure, but the mix may still be far less different than the fund names suggest. The same mega-cap names may still take up a big part of both funds.
QQQ overlaps with VOO by about 53.5% by weight [13], again mostly through the same mega-cap stocks. So it may add more of a tilt than a new layer of diversification. A new ETF may matter only if it changes your total exposure across all your accounts.
Look beyond overlap count to weighted overlap and top positions
Counting shared holdings is a decent first pass, but it may miss the bigger issue. Weighted overlap looks at how much of each portfolio sits in the same names [14][15].
The top five shared holdings - NVIDIA, Apple, Microsoft, Amazon, and Alphabet - account for more than 20% of each fund [10]. In QQQ, those same five names make up roughly 31% of the fund's total weight [11]. If you own all three ETFs, those stocks may quietly grow into a large share of your full portfolio, even if it looks like you're spread across three different funds.
| ETF Pair | Weighted Overlap | What the Overlap Mostly Represents |
|---|---|---|
| VTI vs. VOO | ~88% | Same large-cap U.S. stocks across both funds [9][1] |
| VOO vs. QQQ | ~53.5% | Shared mega-cap stocks [13] |
| VTI vs. QQQ | ~47% | Overlapping large-cap tech; QQQ adds a tech tilt, not new names [12] |
Run a portfolio X-ray across every account
You may hold VTI in a taxable brokerage account, a target-date fund in your 401(k), and QQQ in a Roth IRA. Each account may look fine on its own. Put them together, though, and you may be much more concentrated in the same tech stocks than you think.
Mezzi's X-Ray view pulls brokerage, IRA, Roth IRA, and workplace accounts into one read-only dashboard and shows where the same stocks appear across funds. Once you can see the overlap, you may then compare sector mix, country exposure, fees, and tax impact.
How to Compare Sector, Country, Cost, and Tax Impact
If overlap is low, it still makes sense to check the new tilt before buying. Once overlap is out of the way, the next step is simpler: look at what the ETF may change in your mix - sector weights, country exposure, total holding cost, and taxes.
Measure Sector and Country Exposure Before Adding Risk
It may help to treat broad-market funds as the core of a portfolio, while sector or thematic ETFs act as deliberate tilts.
Start with post-trade sector weights. If technology and communication services already make up a large share of your equities, adding another tech ETF may increase concentration rather than diversification.
Then check country exposure on its own. A U.S. tech ETF may increase domestic exposure. An international ETF may increase non-U.S. exposure without changing sector mix very much. That same review matters because a fund may shift geography even when sector weights look similar.
After exposure, compare what you may pay to hold the fund.
Go Beyond Expense Ratio: Include Spreads, Liquidity, and Tracking
The expense ratio is only one part of cost. It also helps to look at bid-ask spread, liquidity, and tracking difference.
A thin ETF may carry a spread that costs more than a year of fee savings. As a rough guide:
A spread under 0.10% may be low
0.10% to 0.25% may be acceptable
Above 0.30% may be costly and may call for careful use of limit orders [8]
Tracking difference shows how closely the ETF follows its benchmark after fees and trading costs. For example, a fund with a 0.15% expense ratio that regularly trails its index by 0.35% may end up costing more in practice than a fund with a 0.20% fee that tracks closely. Looking at both numbers gives a clearer view.
Use a Side-by-Side Comparison Table Before Deciding
A side-by-side view may show whether an ETF fills a gap or mostly adds more of the same.
| ETF | Primary Holdings | Sector Tilt | Geographic Tilt | Expense Ratio | Spread / Liquidity | Volatility Impact | Tax Efficiency | Typical Role |
|---|---|---|---|---|---|---|---|---|
| VTI | Broad U.S. market | All 11 sectors at market weight | U.S. only | 0.03% | Usually very tight | Baseline / diversified | High in taxable accounts | Often used as a core holding |
| QQQ | U.S. large-cap growth and tech names | Heavy technology tilt | U.S. large-cap only | 0.20% | Usually liquid; check the spread for larger trades | Higher short-term volatility | Generally good, but review distributions | Adds tech tilt, not diversification |
| International ETF | Developed and emerging non-U.S. stocks | Broad international exposure | Non-U.S. developed + emerging | Varies by fund | Varies by fund | May diversify U.S. risk, but may add country risk | Foreign withholding taxes apply [16] | Fills a geographic gap |
If a fund mostly duplicates what you already hold, the table may make that visible before you buy - not after. And a high-turnover thematic ETF may create more taxable events than its fee suggests, which may add drag in a taxable account that the expense ratio alone does not show.
You may also use Mezzi's X-Ray view to compare sector weights, country exposure, and cost before a trade.
How to Decide Whether the ETF Improves Your Portfolio
After checking overlap, cost, and tax impact, there’s one last test: does the ETF make the whole portfolio better aligned with what you’re trying to do?
An ETF May Earn a Spot If It Fills a Gap or Adds a Deliberate Tilt
Each ETF you add needs a clear role. Before buying, write down that role in one sentence. It may be adding international exposure, tilting toward a factor, reducing concentration, or improving tax efficiency. If you can’t describe the job plainly, it may make sense to pass.
An ETF may earn a spot when it adds something your current holdings may not already provide. That might mean:
exposure to a region you’re missing
a factor tilt that may not already be built in
a better fit for your income or risk target
Here’s a simple example. If your portfolio may be 95% U.S. equity with no international exposure, adding a low-cost fund that tracks the MSCI ACWI ex-U.S. may fill a real geographic gap. If the new ETF doesn’t change your exposure in a meaningful way, it may not deserve the slot.
It May Be Worth Skipping If the Result Is Duplication, Extra Cost, or More Tax Friction
High weighted overlap may be the clearest warning sign. If the ETF you’re looking at has more than 70% weighted overlap with your current portfolio, it may mostly add duplication. A tech ETF on top of a broad-market fund may leave you with more concentration, not more diversification.
Cost matters too. If fees go up without a better exposure mix, the trade may not make much sense. For illustration, a 0.75% thematic ETF would cost about $720 more per year than a 0.03% fund on a $100,000 allocation. That gap may not sound huge at first, but over time it may add up.
Taxes may also matter, especially in a taxable account. High-turnover funds may generate short-term capital gains, which may weigh on after-tax returns. That’s why account placement may be part of the decision, not an afterthought.
Verify the Result With Portfolio Analytics Before Placing the Trade
Before you place the trade, check the result with the same look-through view from the last step. Don’t rely on the fund name or the pitch. Look at the numbers.
Aggregate all accounts, run a look-through analysis, and model the portfolio before and after the trade. Then focus on what may actually change:
sector weights
country mix
top holding concentration
yield
volatility
estimated tax impact
total cost
Mezzi's X-Ray view lets you do this across every connected account in one place with read-only access. If the data shows a real gap, the ETF may have a role. If it shows duplication, higher cost, or more risk than you meant to take on, it may be worth skipping. Base the call on portfolio impact, not fund branding.
FAQs
How do I measure ETF overlap across all my accounts?
First, bring your investments into one view. Mezzi does this by securely linking your brokerage, 401(k), IRA, and other accounts with read-only access through Plaid or Finicity.
Then use the X-Ray tool to scan your full portfolio. It breaks ETFs and mutual funds into their underlying stocks and calculates your total company and sector exposure across accounts. That may make it easier to spot hidden concentration risk and duplicate fees.
When does a new ETF improve diversification?
A new ETF may improve diversification when it adds exposure that complements your current holdings instead of duplicating them.
One simple check: look at the overlap in underlying securities. Below 40% may suggest more complementary exposure. Above 70% usually points to a high level of redundancy.
An analytical tool may help you spot that overlap and check whether each ETF serves a distinct role in the portfolio.
Which ETFs are better in a taxable account?
In taxable accounts, some investors may put tax-efficient ETFs near the top of the list. Funds like VTI and VOO are often favored because they may rarely make capital gains distributions.
For global exposure, some people use VTI plus VXUS instead of VT. One reason is that VXUS may qualify for the foreign tax credit. Holding them separately may also make tax-loss harvesting more flexible than using one all-in-one fund.
Disclosures:
This content is for informational purposes only and does not constitute investment advice or a recommendation to buy or sell any security.
Past performance is not indicative of future results. No guarantee of future performance or outcomes is implied.
Savings and performance examples are hypothetical and for illustrative purposes only. Actual results will vary based on individual circumstances, portfolio composition, market conditions, and fees.