If you're looking for the best small-cap value ETF, the choice between AVUV, VBR, and IJS depends on your goals:
- AVUV: Focuses on small, cheap, and profitable stocks with an active, rules-based approach. Higher expense ratio (0.25%) but offers strong exposure to value and profitability factors. Best for investors prioritizing factor targeting despite higher fees.
- VBR: A low-cost (0.07%) passive ETF with broad exposure but includes mid-cap stocks, reducing its small-cap focus. Ideal for cost-conscious, tax-efficient investing.
- IJS: Tracks the S&P SmallCap 600 Value Index with a quality screen. Moderate cost (0.18%) and better small-cap focus than VBR but less targeted than AVUV.
Quick Comparison
Key Takeaway: Choose AVUV for aggressive factor exposure, VBR for low-cost, broad diversification, or IJS for a passive option with a quality screen. Your choice depends on cost sensitivity, portfolio goals, and risk tolerance.
Expense Ratios: Cost Comparison
Expense Ratio Breakdown
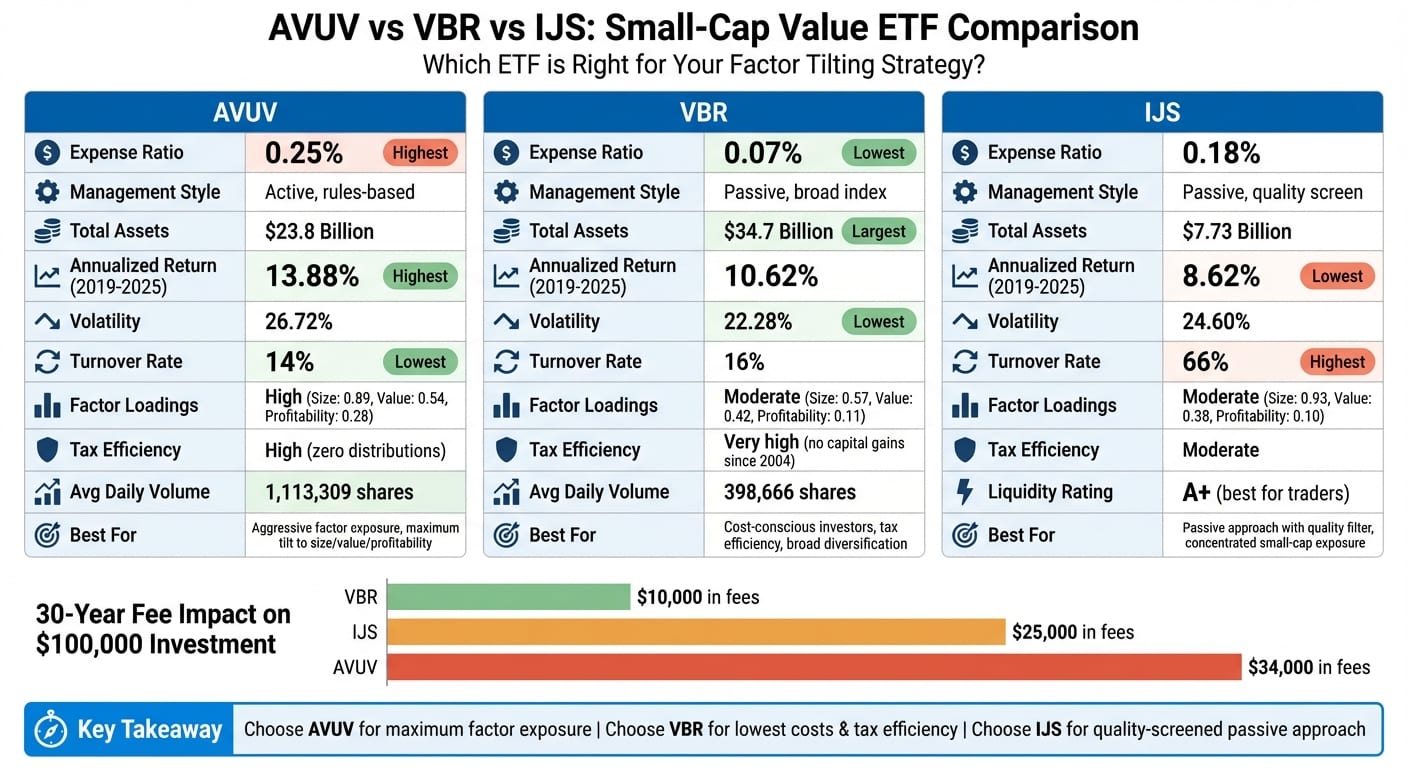
When comparing these ETFs, the expense ratios tell an important story. VBR stands out as the most affordable option, charging just 0.07%. IJS sits in the middle at 0.18%, while AVUV comes in as the priciest at 0.25%. In fact, AVUV's fees are over three times higher than VBR's annually. This higher cost reflects a different management approach.
The key difference lies in how these funds are managed. VBR and IJS are passive index funds, meaning they aim to replicate the performance of their benchmarks without much intervention. AVUV, however, takes an active, rules-based approach to optimize factor exposure. As John Williamson from Optimized Portfolio explains:
Fees are relative and should not be compared in absolute terms. Does the premium we expect to receive justify the higher expense ratio?
Julian Cruz from AInvest adds:
The expense ratio is the single most predictable cost investors face over time.
Cost Impact Over Time
Even small differences in fees can add up dramatically over the years. For example, a $100,000 investment held for 30 years would incur approximately $10,000 in fees with VBR, $25,000 with IJS, and $34,000 with AVUV - assuming standard market returns. That’s a staggering $24,000 more in costs for AVUV compared to VBR.
In June 2025, Julian Cruz analyzed the long-term impact of these fees. His findings revealed that a $10,000 investment in VBR would retain nearly $15,000 more than the same investment in AVUV over 30 years, based solely on the 0.18% fee difference. Furthermore, even if VBR underperformed AVUV by 0.5% annually, it could still accumulate $100,000 more over three decades, thanks to its lower fees and better tax efficiency. These numbers highlight how critical fee differences are when assessing an ETF’s long-term suitability for factor tilting.
For investors managing their own portfolios, this is a vital consideration because fees are guaranteed, while returns are uncertain. Proponents of AVUV argue that the higher fee is justified by its stronger exposure to size, value, and profitability factors. Ultimately, whether this trade-off is worth it depends on your confidence in factor investing and your investment horizon.
Best 6 Small-Cap Value ETFs to Maximize Your Size and Value Factor Exposure
Factor Exposure: Style and Concentration Analysis
Taking a closer look at style allocations and factor loadings reveals how each ETF manages exposure to key factors - an essential part of effective factor-focused investing.
Morningstar Style Box Analysis
The three ETFs employ noticeably different strategies when it comes to small-cap value investing. AVUV allocates 63.71% to mid-cap stocks, 31.00% to small-caps, and just 0.28% to large-caps. On the other hand, VBR allocates 32.88% to large-cap stocks and 58.35% to mid-caps, leaving a mere 7.86% in actual small-cap stocks. Meanwhile, IJS, which tracks the S&P SmallCap 600 Value Index, applies stricter size criteria and uses an earnings screen to exclude companies with weak financials.
This explains why VBR has been criticized as “neither very small nor very value-y”. With over 91% of its portfolio invested in mid- and large-cap stocks, VBR behaves more like a mid-cap value fund than a true small-cap option. In contrast, IJS offers a purer focus on small-cap value by adhering to the S&P 600 universe. AVUV, however, employs a rules-based approach that zeroes in on the smallest and cheapest stocks within its eligible universe. These allocation differences provide a foundation for understanding their factor loadings and overall portfolio characteristics.
Factor Loadings and Portfolio Characteristics
The differences in allocation strategies are further highlighted when examining factor loadings. Between October 2019 and December 2022, AVUV demonstrated a Size loading of 0.82, compared to VBR’s 0.50. For Value exposure, AVUV scored 0.59, outperforming VBR’s 0.45. When it came to Profitability, AVUV achieved a factor loading of 0.15, while VBR lagged behind at 0.04.
In terms of portfolio concentration, AVUV holds around 773 stocks, with 8.50% of its assets concentrated in its top 10 holdings. VBR, by comparison, has a broader portfolio of 845 stocks. IJS, the most concentrated of the three, tracks approximately 600 stocks in the S&P SmallCap 600 Value Index. While the S&P index’s profitability screen gives IJS better factor exposure than VBR, it still doesn’t match AVUV’s targeted approach.
Daniel Sotiroff, a Senior Analyst at Morningstar, pointed out that as of May 2023, AVUV’s return on invested capital outperformed 97% of its small-value peers. These distinctions in style allocations and factor loadings play a crucial role in determining how effectively each ETF captures the small-cap value premium - an essential aspect for long-term portfolio performance in factor-driven strategies.
Tax Efficiency and Turnover
For investors holding small-cap value ETFs in taxable accounts, understanding how tax efficiency affects after-tax returns is crucial. The three ETFs in question take very different approaches regarding portfolio turnover and capital gains distributions, which directly influence tax outcomes.
Turnover Rates and Capital Gains Distributions
Turnover rates reveal how frequently a fund trades its holdings, and this metric plays a big role in managing tax liabilities. AVUV maintains a relatively low turnover rate of 14%, while VBR is slightly higher at 16%. In contrast, IJS stands out with a much higher turnover rate of 66% - over four times that of its peers. Why does this matter? High turnover not only increases transaction costs and fees but also significantly raises the likelihood of taxable capital gains distributions.
"High turnover not only increases costs but also exposes investors to short-term capital gains taxed at ordinary income rates - a major drag on after-tax returns." - Julian Cruz, AI Writing Agent, AInvest
Short-term capital gains, which apply to holdings sold within one year, are taxed at ordinary income rates - up to 39.60%. On the other hand, long-term capital gains enjoy a much lower tax rate of 20.00%. With its 66% turnover rate, IJS exposes investors to a higher risk of short-term capital gains taxes, which can significantly eat into after-tax returns.
Tax Efficiency for Long-Term Investors
Tax efficiency becomes even more important for long-term investors. Here, VBR has a standout record: since its inception in 2004, it has never distributed capital gains to shareholders. This zero-distribution history provides a unique advantage, enabling investors to compound returns without the drag of annual tax liabilities. As of January 31, 2026, VBR reported realized losses of -$27.06 per share (or -12.13% of its net asset value), which can offset future gains and further boost tax efficiency.
Meanwhile, AVUV combines active management with a rules-based strategy and a low 14% turnover rate, delivering tax efficiency on par with VBR’s zero-distribution track record. Both VBR and AVUV allow investors to control when they realize gains by choosing when to sell shares, avoiding the forced taxable events caused by fund distributions.
For tax-advantaged accounts like IRAs or 401(k)s, tax efficiency becomes less of a concern. In these cases, investors can shift their focus to other factors like expense ratios and exposure to specific investment factors. However, for taxable accounts, managing tax implications alongside costs and factor exposures is key to optimizing long-term returns.
Performance and Volatility: Historical Returns and Risk
Multi-Period Returns
Since its launch in late 2019, AVUV has consistently delivered better returns compared to its peers. Between October 2019 and November 2025, AVUV achieved an annualized return of 13.88%, outpacing VBR's 10.62% and IJS's 8.62%. This trend holds across various timeframes: AVUV posted a 1-year return of 20.00% compared to VBR's 16.03%, and a 3-year return of 13.56%, exceeding VBR's 12.47%. As of February 2026, AVUV's year-to-date return stood at 12.75%, higher than VBR's 9.40%.
The fund's standout performance is attributed to its "rules-based active" management strategy, which emphasizes smaller, lower-cost, and more profitable stocks compared to the passively managed VBR and IJS. Over a 5-year period, AVUV's 13.80% return significantly surpassed the 7.45% average for the small-cap value category. While VBR boasts a minimal expense ratio of 0.07%, its portfolio includes a sizable allocation - 58% to 63% - to mid-cap stocks, which reduces its exposure to the small-cap value factor. Meanwhile, IJS, which follows the S&P SmallCap 600 Value Index with an earnings-based profitability screen, has historically lagged behind both AVUV and VBR in total returns. To fully assess these funds, it's essential to also consider their volatility and risk profiles.
Volatility and Risk-Adjusted Performance
Higher returns often come with greater volatility, and AVUV is no exception. From October 2019 to November 2025, AVUV recorded an annualized standard deviation of 26.72% - the highest among the three ETFs - compared to 22.28% for VBR and 24.60% for IJS. Its market beta of 1.07 also highlights its greater sensitivity to market movements, compared to 0.99 for VBR and 0.97 for IJS. This increased volatility reflects AVUV's focus on the smallest, most value-oriented, and profitable stocks.
Despite the heightened volatility, AVUV has delivered better risk-adjusted returns. John Williamson of Optimized Portfolio remarked:
"AVUV has handily beaten both [VBR and S&P 500]. And while it was also much more volatile, it was still able to deliver a much greater risk-adjusted return than those two as well for both Sharpe and Sortino".
AVUV's concentrated factor-investing approach sets it apart. Its size loading of 0.89, value loading of 0.54, and profitability loading of 0.28 outpace VBR's respective exposures of 0.57, 0.42, and 0.11. VBR's lower volatility is partly due to its substantial mid-cap holdings, which act as a stabilizer during market fluctuations. However, as Williamson observed, this also means VBR is "neither very small nor very value-y".
Liquidity and Trading Considerations
Trading Volume and Bid-Ask Spreads
When it comes to trading activity, AVUV stands out with an average daily volume of 1,113,309 shares over the past month. In contrast, VBR, despite being the largest fund with $34.7 billion in assets, sees a lower daily volume of 398,666 shares. IJS, known for its "A+" liquidity rating, is a favorite among day traders due to its tight spreads and ease of trade execution.
For active traders, even minor bid-ask spreads can add up over time. AVUV boasts impressively low bid-ask spreads, averaging 0.03%, while VBR’s spreads are slightly higher at around 0.06%. AVUV also maintains a median premium/discount of just 0.02%, ensuring its market price stays closely aligned with its net asset value. As John Williamson of APMA points out, ETFs with lower trading volume often experience wider spreads, which can increase execution costs for frequent traders.
For self-directed investors, using limit orders is a smart move to avoid unexpected price swings, especially near market open or close. While AVUV’s 0.25% expense ratio is higher, its narrow spreads and trading efficiency appeal to certain investors. On the other hand, VBR’s 0.07% expense ratio, combined with its relatively tight spreads, may offer a more cost-effective option for frequent traders. Understanding these liquidity nuances is crucial for balancing short-term trading costs and the long-term performance of factor-tilting strategies.
Fund Size and Stability
Fund size also plays a key role in price stability and execution efficiency. VBR leads the pack with $34.7 billion in assets under management as of February 20, 2026, providing unmatched stability for large institutional trades. Meanwhile, AVUV has grown significantly, jumping from $1 billion in 2021 to $23.8 billion in early 2026, addressing earlier liquidity concerns for retail investors. IJS, with $7.73 billion in assets, also delivers strong liquidity metrics.
Larger funds like VBR tend to have tighter bid-ask spreads and are better equipped to handle large capital inflows or outflows without disrupting prices. For investors managing sizable portfolios or executing block trades, VBR’s massive asset base offers the most stability. However, AVUV’s higher daily trading volume makes it an attractive choice for both retail and institutional traders looking for quick and efficient trade execution.
How to Choose the Best ETF for Factor Tilting
Decision Framework for Investors
If you're looking to fine-tune your small-cap value strategy with factor tilting, start by addressing these four key questions that align with your investment objectives.
First, consider your sensitivity to costs. If even a 20-basis point difference has a big impact on your portfolio, VBR's ultra-low 0.07% expense ratio might be the best fit. To put this into perspective, over a 30-year period, a $10,000 investment in VBR could save nearly $15,000 in fees compared to AVUV, assuming both generate identical returns.
Second, clarify your factor goals. Are you aiming for pure "Size" exposure or a more nuanced mix of "Value" and "Profitability"? AVUV’s higher factor loadings, as mentioned earlier, might justify its higher fee for those seeking deeper factor exposure. As John Williamson points out, AVUV’s enhanced exposure can make the additional cost worthwhile.
Third, decide on your preference for management style. Do you prefer a rules-based active approach, like AVUV’s, which incorporates momentum and current pricing? Or would you rather stick with a purely passive index like IJS or VBR? Keep in mind, AVUV’s active approach involves management discretion, which might not appeal to those who want strictly rules-driven exposure.
Finally, assess your tolerance for tracking error. Are you comfortable with the idea that your tilted ETF might underperform the broader market for extended periods? AVUV is designed to diverge from benchmarks in pursuit of higher returns, which requires patience during periods of underperformance.
With these considerations in mind, here’s a summary of tailored recommendations based on your investment priorities.
Summary of Key Recommendations
- Choose VBR if minimizing costs is your top priority. VBR offers broad, diversified exposure with a "set-it-and-forget-it" approach. Its low 16% annual turnover and history of zero capital gains distributions make it especially tax-efficient. This ETF is ideal for cost-conscious investors willing to accept some mid-cap drift while prioritizing simplicity over maximum factor intensity.
- Choose IJS if you want a passive index with a built-in quality filter. The S&P 600's earnings screen inherently includes profitability measures, offering concentrated small-cap exposure at a moderate 0.18% expense ratio. IJS provides a middle ground between factor purity and cost, making it a good option for those seeking better factor exposure than VBR but without the active management of AVUV.
- Choose AVUV if you're a factor-focused investor aiming for maximum exposure to Size, Value, and Profitability factors. With a portfolio of roughly 776 stocks and a weighted average market cap of $3.52 billion, AVUV targets smaller and cheaper companies than its competitors. Its 0.25% expense ratio is justified for those who believe in the potential for higher risk-adjusted returns over time. AVUV is best suited for investors willing to pay a bit more, embrace higher volatility (18.27% 200-day volatility compared to VBR’s 15.10%), and stay patient through market ups and downs.
Conclusion
Deciding between AVUV, VBR, and IJS comes down to your priorities: cost sensitivity, factor exposure preferences, and management style. If you're willing to pay a higher fee for more targeted factor exposure, AVUV's enhanced factor loadings might make sense for you. On the other hand, if keeping costs low and maximizing tax efficiency are your main concerns, VBR's strong track record in taxable accounts could be the better choice. For those who prefer a passive approach with a built-in quality screen, IJS provides concentrated small-cap exposure at a reasonable 0.18% expense ratio.
Fees are relative and should not be compared in absolute terms. Basically, does the premium we're expecting to receive outweigh the greater expense ratio?
Your decision should align with your overall investment goals and risk tolerance. VBR excels with its low-cost, tax-efficient structure. IJS offers a balanced, passive approach with a focus on quality. AVUV stands out for its aggressive factor tilting and potential for higher returns over time. There’s no one-size-fits-all option here - just the ETF that best complements your broader portfolio strategy.
Understanding the nuances of these ETFs empowers you to make informed choices. Tools like Mezzi's AI-driven platform can simplify this process, offering insights into tax implications, factor tilts, and asset allocation - without the hefty advisor fees that could add up to over $1 million across 30 years. Whether you're managing wash sales across multiple accounts or fine-tuning your small-cap value tilt, Mezzi provides the clarity you need to stay on track.
FAQs
Which ETF is best for a taxable account?
For taxable accounts, VBR stands out as a smart option. Why? Its low expense ratio of just 0.07%, broad exposure to approximately 842 stocks, and strong tax efficiency make it a solid pick. On the other hand, AVUV does provide stronger factor tilts, but its higher expense ratio (0.25%) and increased turnover could result in more taxable events. IJS strikes a middle ground with moderate costs (0.18%) and tax efficiency similar to VBR. However, VBR’s lower cost gives it an edge when it comes to keeping taxes down.
How much small-cap exposure do these ETFs actually have?
The small-cap focus of AVUV, VBR, and IJS differs based on their holdings and strategies. VBR stands out with approximately 842 stocks, aiming for broader diversification. On the other hand, AVUV narrows its scope to 400–500 stocks, prioritizing companies with lower valuations and higher profitability. Similarly, IJS follows a profitability-screened index, holding over 400 stocks. While VBR casts the widest net, AVUV and IJS hone in on more specific small-cap value opportunities.
Should I choose higher factor exposure over lower fees?
When deciding between higher factor exposure and lower fees, it all boils down to your investment objectives. Funds like AVUV, which emphasize factors such as size, value, and profitability, could potentially deliver higher returns - provided those factors perform well. However, this approach often comes with higher costs.
On the other hand, if keeping expenses low and maximizing tax efficiency are key priorities, options like VBR, with lower fees, might be a better fit. Ultimately, weigh your risk tolerance, investment timeline, and whether the potential for higher returns justifies the added expense.
Disclosures:
- This content is for informational purposes only and does not constitute investment advice or a recommendation to buy or sell any security.
- Past performance is not indicative of future results. No guarantee of future performance or outcomes is implied.
- Savings and performance examples are hypothetical and for illustrative purposes only. Actual results will vary based on individual circumstances, portfolio composition, market conditions, and fees.
- Registration does not imply a certain level of skill or that the SEC has approved the company or its services.
Related Blog Posts
- How do VPU and XLU compare on dividend yield, dividend growth, fees, and sector concentration?
- IWM vs VB vs IJR - Best small-cap core ETF for long-horizon growth
- VBR vs AVUV vs IJS - Best small-cap value ETF for factor tilt
- VXUS vs VEU vs IXUS - Best total international ETF for one-ticket ex-US exposure
For taxable accounts, VBR stands out as a smart option. Why? Its low expense ratio of just 0.07%, broad exposure to approximately 842 stocks, and strong tax efficiency make it a solid pick. On the other hand, AVUV does provide stronger factor tilts, but its higher expense ratio (0.25%) and increased turnover could result in more taxable events. IJS strikes a middle ground with moderate costs (0.18%) and tax efficiency similar to VBR. However, VBR’s lower cost gives it an edge when it comes to keeping taxes down.
The small-cap focus of AVUV, VBR, and IJS differs based on their holdings and strategies. VBR stands out with approximately 842 stocks, aiming for broader diversification. On the other hand, AVUV narrows its scope to 400–500 stocks, prioritizing companies with lower valuations and higher profitability. Similarly, IJS follows a profitability-screened index, holding over 400 stocks. While VBR casts the widest net, AVUV and IJS hone in on more specific small-cap value opportunities.
When deciding between higher factor exposure and lower fees, it all boils down to your investment objectives. Funds like AVUV, which emphasize factors such as size, value, and profitability, could potentially deliver higher returns - provided those factors perform well. However, this approach often comes with higher costs.
On the other hand, if keeping expenses low and maximizing tax efficiency are key priorities, options like VBR, with lower fees, might be a better fit. Ultimately, weigh your risk tolerance, investment timeline, and whether the potential for higher returns justifies the added expense.