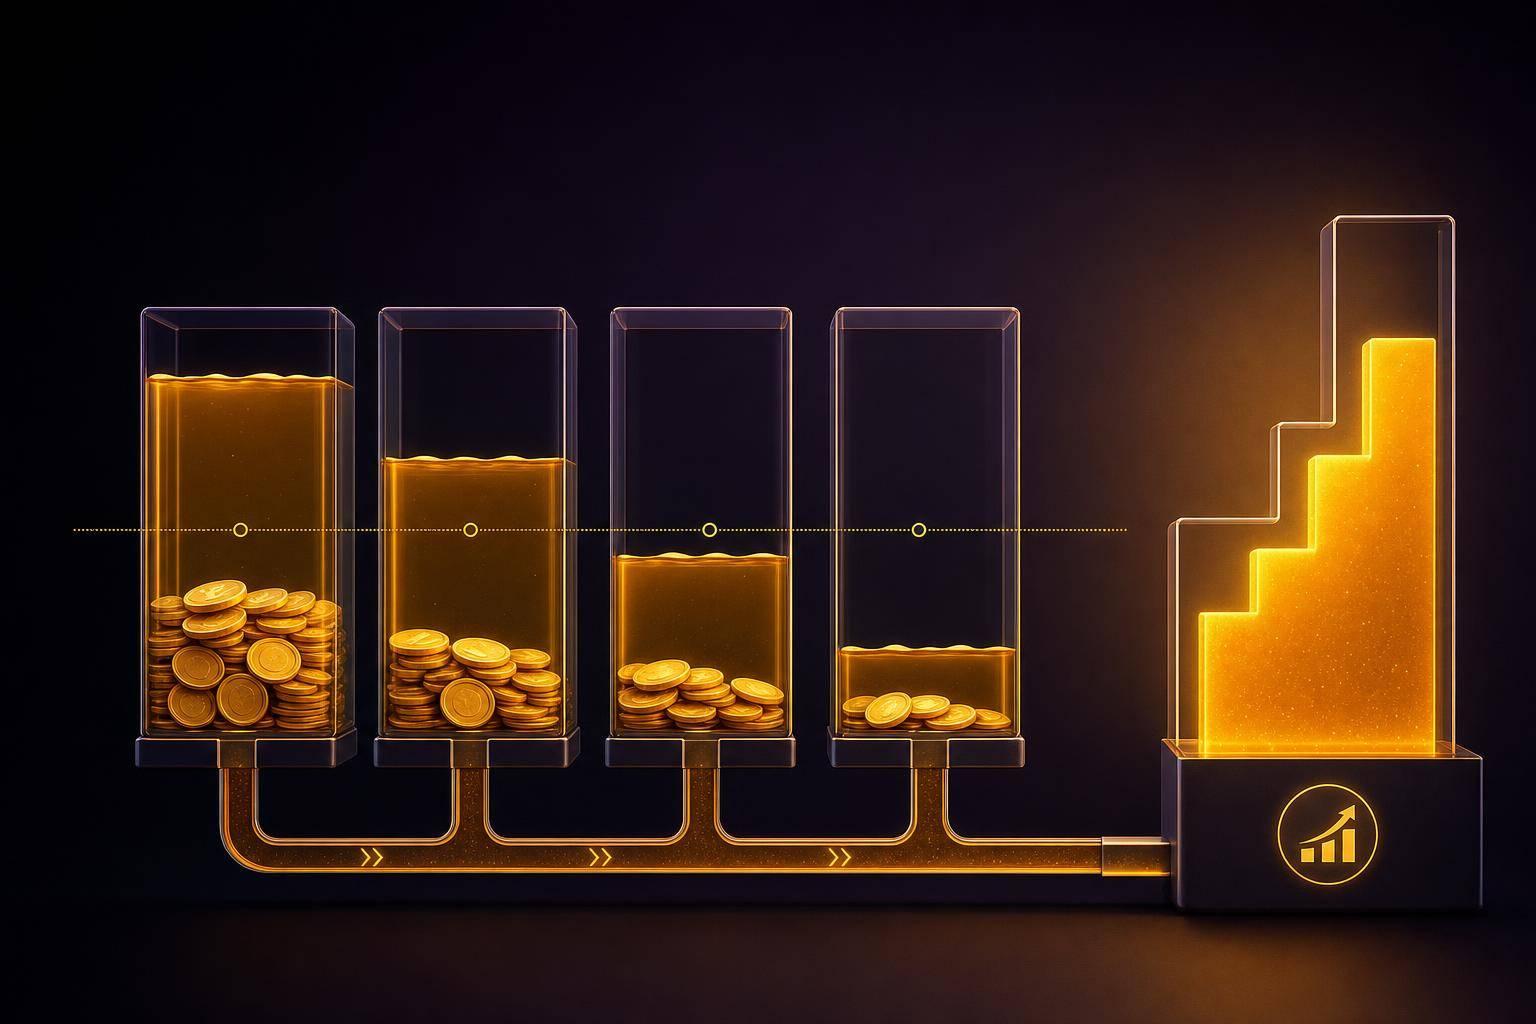
A lot of households may leave more cash idle than they think. That extra money may sit in checking, savings, brokerage sweep accounts, and retirement plan cash options - and over time, the gap between cash yields and investment returns may add up.
Here’s the short version:
Idle cash may mean money above your monthly spending buffer and emergency fund
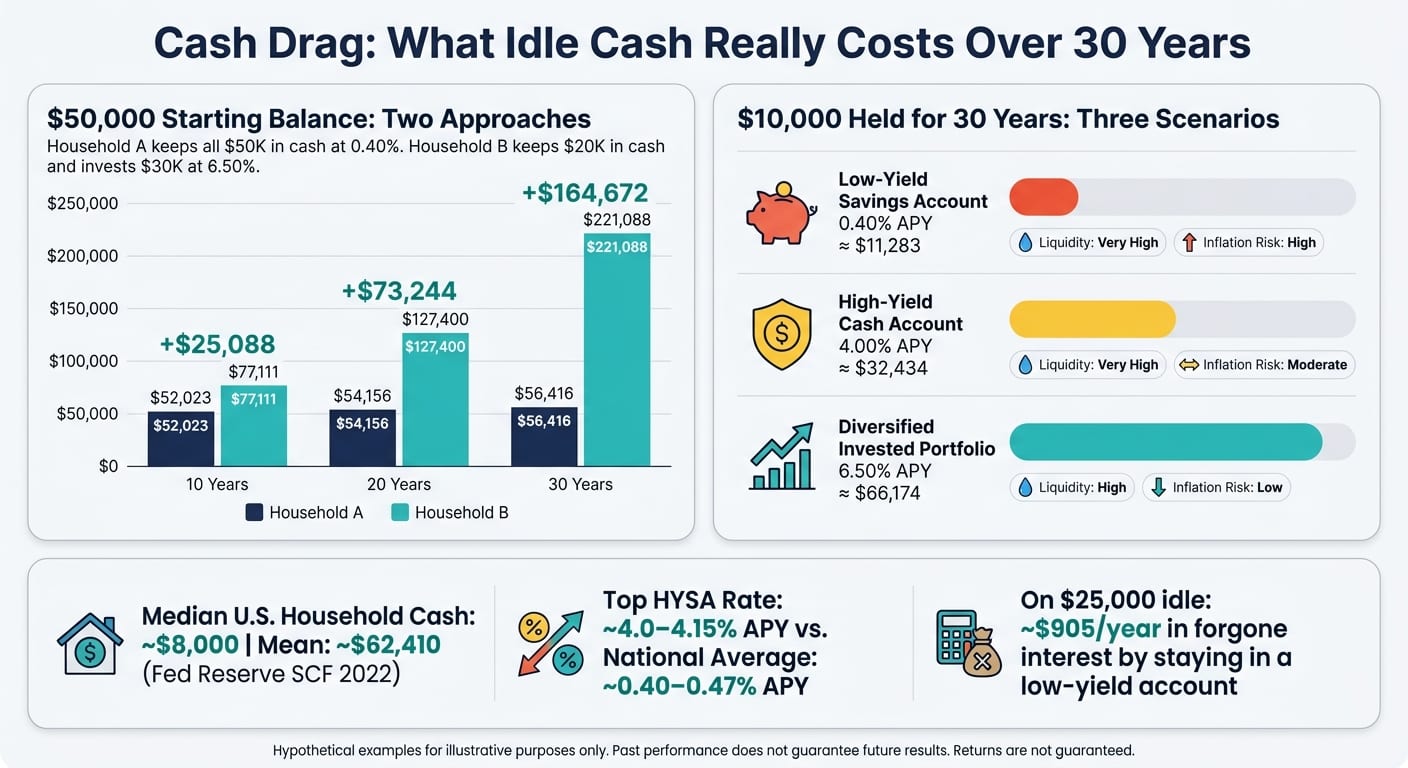
The median U.S. household may hold about $8,000 in checking and savings, while the mean is far higher at about $62,410
A return gap of just a few percentage points on $25,000 to $50,000 may add up over 10, 20, or 30 years
Hidden cash may sit in:
brokerage settlement funds
401(k) money market or stable value options
extra savings balances across old or linked accounts
Some people sort cash into three buckets: spending, emergency, and investable
For cash they plan to keep liquid, some move it from low-rate accounts to higher-yield cash accounts or short-term Treasury bills
A simple way to think about it: if cash has no near-term job, it may be costing more than it looks.
Quick Comparison
| Cash Location | What It May Be For | May Count as Idle? | What Some People Check |
|---|---|---|---|
| Checking | Bills and monthly spending | Yes, above buffer | Balance vs. 30–60 days of spending |
| Savings | Emergency reserve | Yes, above reserve target | Balance vs. 3–6 months of core expenses |
| Brokerage cash | Waiting to be invested | Often yes | Sweep fund, core position, cash to trade |
| Retirement cash | Default or low-risk holding | Often yes | Money market, stable value, capital preservation |
I’m looking at one main idea in this piece: how to spot extra cash, estimate what it may cost, and think about where that money may fit instead.
Do YOU Have Too Much Cash? | The Hidden Cost of Cash Drag
How Much Cash the Average U.S. Household Leaves Uninvested
To measure cash drag, add up every idle balance across your bank, brokerage, and retirement accounts. For many households, that total may be larger than it first seems.
Bank Cash: Checking and Savings Balances
Based on analyses of the Federal Reserve's 2022 Survey of Consumer Finances, the median U.S. household holds about $8,000 in transaction accounts like checking and savings, while the mean comes in around $62,410.[2][3][1][5][6][7] For most households, the median may be the better yardstick. The mean gets pulled up by a small group with very large cash balances.
That gap matters. For illustration, a household may look at $3,000 in checking and $2,000 in savings and think, "We have $5,000 in cash." But a more complete look may turn up an old savings account, a joint online savings account, brokerage sweep cash, and a 401(k) stable value fund. Suddenly, the total may be $13,000.[3][4][5][8][1][7]
So the job isn't just counting the cash you remember. It's finding the cash that's easy to forget.
Brokerage and Retirement Cash That Often Gets Overlooked
Cash inside investment accounts may be easy to miss because it often sits in default holding spots. In taxable brokerage accounts, uninvested money usually lands in a settlement fund or sweep account. That's the place where stock-sale proceeds, dividends, and new deposits may sit until a trade gets placed.
Retirement accounts have a similar blind spot. Many 401(k) and IRA plans include money market funds or stable value funds as conservative or default options. They're built for liquidity and stability, but over long periods they may earn much less than a diversified portfolio. Balances may build up through default settings or old rebalancing choices, then sit there unnoticed.
Retirement cash is generally not counted toward an emergency fund, since early access may trigger taxes and penalties.[3][1][7]
These are often the easiest balances to overlook, which is exactly why they belong in the inventory.
A Simple Household Cash Inventory Table
The table below gives a starting framework for finding idle cash across the accounts many U.S. households use.
| Account Type | Where Idle Cash Typically Sits | How to Find It | Count Toward Emergency Reserve? |
|---|---|---|---|
| Primary checking | Operating balance plus accumulated surplus | "Available balance" in online banking | Partial (operating buffer only) |
| Joint or secondary checking | Rarely-used transaction account | Check all linked accounts in your bank portal | Partial (operating buffer only) |
| Traditional or high-yield savings | Emergency fund plus excess above target | Compare balance to your 3–6 month expense goal | Yes |
| Money market deposit account | Accumulated cash above near-term needs | Look for "money market" or cash balance in the account summary | Yes |
| Brokerage – settlement/sweep fund | Uninvested trade proceeds and contributions | Check "Cash", "Sweep", or "Purchasing Power" line on statements | No (investable) |
| 401(k) or 403(b) – stable value/money market | Default or conservative fund allocation | Review "Asset Allocation" or fund details in plan dashboard | No (long-term investment) |
| IRA – money market fund | Uninvested contributions or rollover proceeds | Check "Cash" or "Money Market" line in IRA account | No (long-term investment) |
It may help to label each balance as operating, emergency, or investable. That total may then serve as the base number for the next step: estimating missed returns.
What Idle Cash Really Costs Over 10, 20, and 30 Years
The Basic Cash Drag Formula
Cash drag is the amount of return you may miss when money sits in cash instead of earning a higher rate elsewhere. The rough formula is simple: idle cash × the gap between portfolio return and cash yield.
Here’s a plain hypothetical example. If $25,000 sits in a savings account earning 0.40%, while a portfolio earns 6.50%, the gap is 6.10%. That works out to about $1,525 in missed return in year one.[17] And that gap may build on itself over time, which is why the next example stands out.
Hypothetical Example: Cash-Heavy Household vs. Household With a Set Reserve
Two households each start with $50,000. Household A keeps the full amount in cash at 0.40%. Household B keeps $20,000 in cash as a reserve and invests the other $30,000 at 6.50%.[9][11][12][14][15][16]
| Time Horizon | Household A (all $50K in cash at 0.40%) | Household B ($20K cash + $30K invested at 6.50%) | Difference |
|---|---|---|---|
| 10 years | ≈ $52,023 | ≈ $77,111 | ≈ $25,088 |
| 20 years | ≈ $54,156 | ≈ $127,400 | ≈ $73,244 |
| 30 years | ≈ $56,416 | ≈ $221,088 | ≈ $164,672 |
Over 30 years in this hypothetical, the household that invested the extra amount would end up with about $164,000 more.[9][11][12][15][16] That doesn’t mean the same result would apply in every case. It does show how a large cash balance may come with a long-term tradeoff.
Comparison Table: Low-Yield Cash, Higher-Yield Cash Account, and an Invested Portfolio
The gap may look even bigger when you compare three common places to keep $10,000 over 30 years.[9][10][11][12][13][15][16]
| Option | Illustrative Annual Return | 30-Year Value of $10,000 | Inflation Sensitivity | Liquidity |
|---|---|---|---|---|
| Low-yield savings account | 0.40% | ≈ $11,283 | High - real purchasing power often declines | Very high (FDIC insured) |
| Higher-yield cash account | 4.0% | ≈ $32,434 | Moderate - may keep closer to inflation | Very high (FDIC or similar) |
| Diversified invested portfolio | 6.50% | ≈ $66,174 | Low - may have better odds of outpacing inflation long term | High, with market volatility |
Put side by side, the pattern is hard to miss. Low-yield cash may grow, but very slowly, and purchasing power may shrink over time if inflation runs ahead of the yield. Once that cost is visible, the next step may be to look across all accounts and see where idle cash may be sitting.
How to Find Excess Cash Across All Your Accounts
Once you know the cost of holding extra cash, the next step may be figuring out how much of it is actually extra. That usually comes down to two things: setting a reserve target and getting a full view of where your cash sits today.
Set a Real Emergency Reserve Before Labeling Cash as Excess
Start with your essential monthly expenses: housing, utilities, food, transportation, insurance, and minimum debt payments. Not your total spending. Just the bills and costs you may need to cover no matter what.
For many households, a common benchmark may be 3–6 months of essential expenses as an emergency reserve target.[18][19][20][21][22]
If a household spends $3,500 per month on essentials, that may work out to about:
$10,500 on the low end
$21,000 on the high end
If income changes from month to month, there’s one earner, or someone is self-employed, some people lean toward the upper end of that range - or more. Vanguard draws a line between an unexpected expense and a drop in income, with a larger buffer potentially fitting better when income may be at risk.[22]
Many people set that reserve first. Only the amount above it may count as excess cash.
Where to Look for Hidden Cash in Sweep Funds and Retirement Plans
Idle cash often sits in places people don’t check closely, especially brokerage settlement funds and default retirement holdings.
In brokerage accounts, look for the core position, settlement fund, or anything labeled "cash available to trade." Those balances may build up from dividends, trade settlements, or new deposits, and they may stay there unless they’re reinvested.[27][28][29][31]
In 401(k) and 403(b) accounts, check whether part of the balance sits in a stable value fund, capital preservation fund, or money market option. These are often default spots where new contributions or old rollover money may sit.[30]
With a reserve target in hand, the next step may be checking every account where cash can sit.
| Account Type | Where to Look for Idle Cash |
|---|---|
| Checking | Day-to-day spending buffer; may be larger than needed if left unreviewed |
| Savings | Emergency reserve above your 3–6 month essential-expense target |
| Brokerage | Core position, settlement fund, "cash available to trade" |
| Retirement (401(k)/403(b)) | Stable value, capital preservation, or money market allocations |
See All Your Cash in One Place Instead of Guessing Account by Account
Fragmented accounts may make cash drag easy to miss. Small balances across multiple accounts may add up to more than a reasonable reserve.[23][24][25][26]
A consolidated view may turn scattered balances into one number. Mezzi's read-only account aggregation connects bank, brokerage, and retirement accounts in one place. That may give you a single total for idle cash instead of a guess.
How to Cut Cash Drag Without Giving Up Flexibility
Once you know where idle cash sits, the next step may be deciding how much should stay liquid.
Separate Operating Cash, Emergency Cash, and Investable Cash
One approach is to give each dollar a job: instead of letting money stack up in checking by default, some people split cash into three buckets.
Operating cash covers the next 30 to 60 days of spending - bills, groceries, rent or mortgage, and day-to-day purchases. Some households keep about one to two months of living expenses in checking to reduce the chance of overdrafts.[33][34]
Emergency cash covers a job loss or income drop. Many people keep this money separate from checking so it stays easy to reach, but not quite as easy to spend.[35][36][37]
Investable cash is whatever remains above those two targets. That may be the money available to put to work - and often the main source of cash drag when it sits idle.
Cash drag may drop once only true reserve cash stays idle. After that, the cash you still need to hold may earn more in a better-paying account.
Earn More on Cash You Plan to Keep
Traditional savings rates sit far below top cash yields. FDIC data shows the national average savings rate at around 0.40% to 0.47% APY, while top high-yield savings accounts pay around 4.0% to 4.15% APY - more than ten times the rate on many standard accounts.[32][40][41]
On a $25,000 emergency reserve, that gap comes to roughly $905 per year in forgone interest.[39] On $50,000, it comes to about $1,810 annually.[39] That's money that may go unearned without taking on added risk.
For many households, a high-yield savings account (HYSA) may be the practical starting point for emergency reserves. It offers federal insurance, easy access, and a much higher yield than a standard savings account. For larger reserves, short-term U.S. Treasury bills, usually 4 to 26 weeks, may offer a higher yield with set maturity dates.[32][38]
Cutting cash drag usually comes down to two moves:
Putting true surplus cash to work
Earning a competitive yield on the cash you still need to keep
Conclusion: Measuring Idle Cash, Setting the Reserve, and Putting the Rest to Work
After those buckets are set, the last step may be moving surplus cash out of low-yield accounts.
Cash drag is measurable, and for many households, idle cash spread across checking accounts, savings accounts, brokerage settlement funds, and retirement plan defaults may be larger than it looks from any one account view. The long-term cost may compound quietly over 10, 20, or 30 years.
A common approach has three steps: audit all your cash across every account, set a specific reserve target based on actual essential expenses and income stability, and put true surplus to work in a way that fits your time horizon and risk tolerance. For cash you still need to hold, some people move it to an account that pays a competitive yield instead of leaving it in low-rate checking by default.
Measuring idle cash, setting a reserve, and deciding how to use any surplus may help reduce cash drag.
FAQs
How much cash is too much to keep uninvested?
A common rule of thumb may be to keep cash only for liquidity needs:
about 3–6 months of core expenses for an emergency fund
roughly 1–2 years of reserves for near-term goals
For day-to-day spending, some people keep about 25–50% of one month’s living expenses in checking. Amounts above that may be more than needed and may lead to cash drag.
Should brokerage and 401(k) cash count toward my emergency fund?
Cash in your brokerage and 401(k) accounts is generally not considered part of your emergency fund, since accessing retirement accounts early may trigger taxes and penalties. Brokerage cash may be accessible, but retirement account cash is typically less liquid.
Mezzi includes cash positions in brokerage accounts, along with money market funds and other cash-like holdings. It also suggests comparing your emergency fund target against idle cash across checking, savings, and those account balances.
What should I do first if I find idle cash across multiple accounts?
First, add up the idle cash across all accounts and compare each balance with your target cash reserves. That may include checking, savings, CDs or money market accounts, uninvested brokerage cash, and any old retirement or business accounts.
Then look for any surplus beyond your emergency and liquidity needs. Review balances on a regular basis so excess cash may be less likely to build up again. Mezzi’s X-Ray may help scan linked accounts and pinpoint surplus cash.
Disclosures:
This content is for informational purposes only and does not constitute investment advice or a recommendation to buy or sell any security.
Past performance is not indicative of future results. No guarantee of future performance or outcomes is implied.
Savings and performance examples are hypothetical and for illustrative purposes only. Actual results will vary based on individual circumstances, portfolio composition, market conditions, and fees.