
If I had to sum it up in one line: ETFs may fit many taxable investors on cost and simplicity, while direct indexing may make more sense when taxes, account size, and stock-level control line up.
Here’s the short version:
ETFs may offer:
very low fees, often around 0.03% to 0.05%
tight index tracking
simple tax reporting
Direct indexing may offer:
more tax-loss harvesting at the stock level
more room to exclude stocks or offset a concentrated position
more moving parts, more trades, and higher fees
A few numbers frame the tradeoff:
One cited study linked direct indexing to $18,281 in harvested losses per account versus $4,808 for ETF-only accounts
That gap was associated with about $6,700 in annual tax savings for households in the top federal bracket
But direct indexing fees may run about 0.09% to 0.70%, versus about 0.03% for a low-cost ETF
Tracking error for direct indexing may land around 20 to 100 basis points, and may go higher with custom screens
What changes the answer? Mostly three things:
Tax rate
Taxable account size
Need for customization
If your taxable balance may be under $500,000, and you mainly want low cost and close benchmark tracking, an ETF may look cleaner. If your taxable assets may be $500,000+, your tax rate may be high, and you want stock-level tax management or exclusions, direct indexing may be worth a closer look.
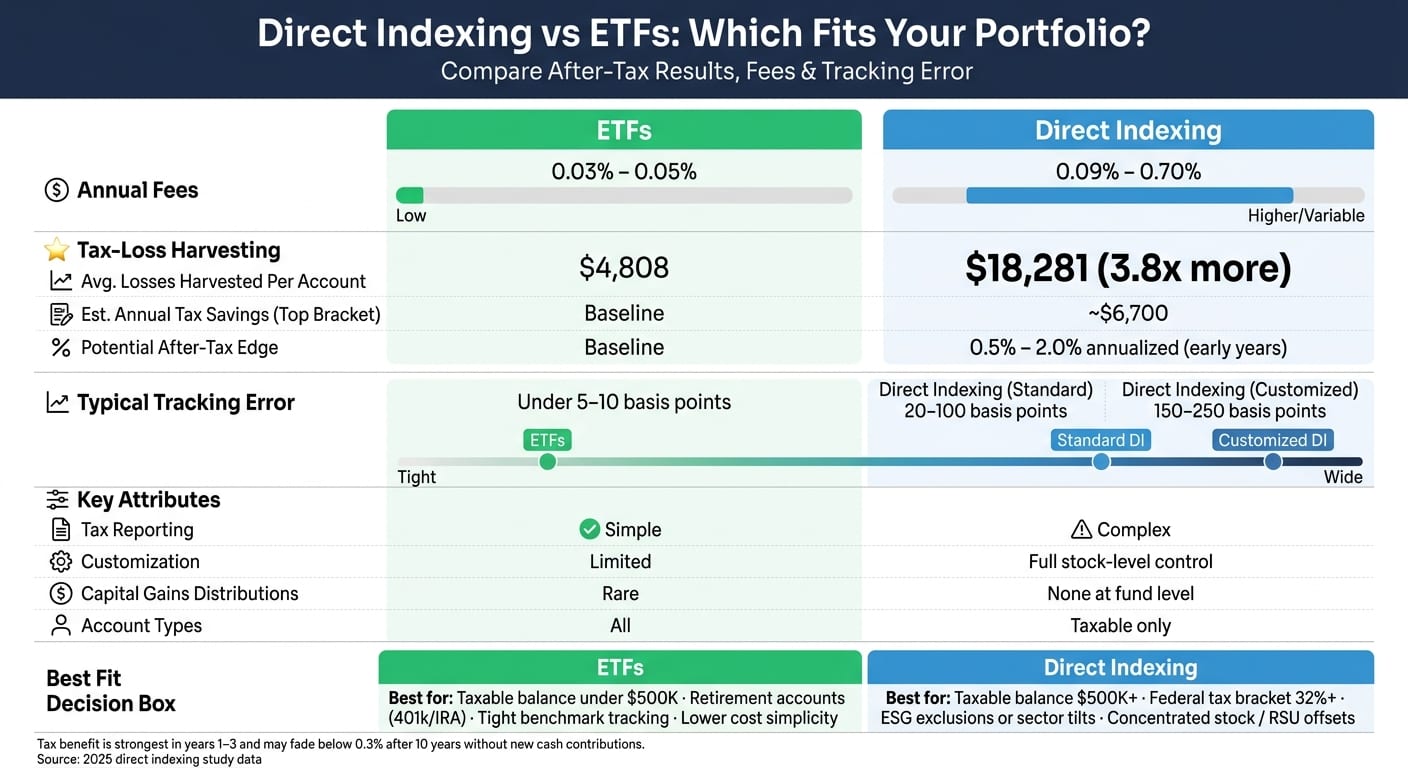
The Merits of Direct Indexing Versus ETF Investing
Quick Comparison
| Area | ETFs | Direct Indexing |
|---|---|---|
| After-tax result | Tax-efficient structure, but no stock-level loss use | May harvest losses security by security |
| Fees | Usually lower | Usually higher |
| Tracking error | Usually very low | Usually higher |
| Tax reporting | Simpler | Longer and more complex |
| Customization | Limited | More stock-level control |
| Best fit | Lower-cost, simple index exposure | Larger taxable accounts with tax or customization needs |
I’d read the rest of the article as a breakeven question: may the tax edge be large enough to offset higher fees, more drift from the index, and added tax complexity?
After-tax results: Where direct indexing can outperform ETFs
ETF tax efficiency vs. stock-level tax-loss harvesting
ETFs may avoid passing out embedded gains, but they do not pass through losses from individual stocks to shareholders. Direct indexing may do something different: it may harvest losses one stock at a time and use them to offset gains elsewhere. That difference may matter most in taxable accounts, where realized losses may offset other gains.
A hypothetical side-by-side example of after-tax outcomes
A 2025 study found that client direct-indexed portfolios with an average balance of $413,759 harvested $18,281 in losses per account, versus $4,808 for ETF-only accounts - about 3.8x more loss capture [1]. For households in the top federal bracket, that gap was associated with about $6,700 in annual tax savings [1].
| Feature | ETF | Direct Indexing |
|---|---|---|
| Tax-loss harvesting scope | Fund level only; losses stay at the fund level | Individual stock level; per-security loss capture |
| Capital gains distributions | Rare, due to in-kind redemptions | No fund-level capital gains distributions; gains and losses occur when stocks are sold |
| Tax bracket sensitivity | Moderate | High; benefits scale with marginal rate |
| Wash sale complexity | Low; one ticker to track | High; requires tracking across all taxable accounts to avoid wash sales |
| Potential after-tax edge | Baseline | 0.5% to 2.0% annualized in early years [1] |
When direct indexing's after-tax edge shrinks
That tax edge may be strongest in the first one to three years, when fresh tax lots may create more losses to harvest. Over time, it often fades, and it may fall below 0.3% after 10 years unless new cash keeps adding fresh lots [1].
The gap also tends to look stronger for households in the 32% federal marginal bracket or higher, especially in high-tax states like California or New York [1]. In a long bull market, though, fewer stocks may trade below their purchase price, so there may be less to harvest in a given year. And if you may not have capital gains elsewhere, the tax value may be limited to offsetting up to $3,000 of ordinary income per year, with the rest carrying forward indefinitely [1].
Tax savings are only one side of the comparison; the next question is whether they may outweigh the higher all-in cost.
Fees and total cost: Expense ratios, platform fees, and bid-ask spreads and rebalancing trades
Tax savings matter only if they exceed the extra cost.
What ETF investors typically pay
Funds tracking the S&P 500 or the total U.S. stock market typically charge 0.03% to 0.05% per year in expense ratios. On a $500,000 portfolio, that comes out to about $150 to $250 per year. The bid-ask spread on a liquid ETF like SPY is roughly $0.01 to $0.02 per share, and commissions are often $0 at many U.S. brokers. Put simply, the ongoing cost drag may stay fairly low.
What direct indexing investors typically pay
Direct indexing usually adds a platform fee of about 0.09% to 0.70%, plus bid-ask spreads and rebalancing trades. That changes the math pretty fast.
| Cost component | ETF | Direct indexing |
|---|---|---|
| Annual fee | 0.03%–0.05% | 0.09%–0.70% |
| Trading costs | Minimal; tight spreads on liquid funds | Higher; spreads and rebalancing across 150–500 stocks |
| Tax reporting complexity | Low; typically one or a few line items | High; can make tax reporting much longer on Form 1099-B and Form 8949 |
A direct indexing account may hold 150 to 500 individual stocks and may generate hundreds or thousands of lot-level trades each year. That may turn tax reporting into a much longer Form 1099-B and Form 8949 [1]. By comparison, ETF investors usually have far simpler reporting.
The breakeven question: When higher fees may still make sense
The breakeven test is simple: if the tax benefit may exceed the fee premium, direct indexing may come out ahead. That may be more likely in larger taxable accounts - especially those at $500,000 and above - with marginal tax rates in the 32% federal bracket or higher [1].
For smaller accounts, the fee premium over a 3-basis-point ETF may outweigh the dollar value of any tax savings [1]. That’s why some people look at the fee premium, not the headline tax-savings number, as the hurdle.
Cost is only one side of the tradeoff; the next question is how closely each approach tracks the index.
Tracking error: How closely each approach follows the index
Lower fees may matter less if the portfolio drifts too far from the index. After taxes and fees, tracking error may be the third test.
Tracking difference is the return gap versus the benchmark over a set period. Tracking error is how much that gap may vary over time.
Why ETFs usually track more tightly
Large index ETFs usually use full replication and scale. That setup may keep tracking error very low, often under 5 to 10 basis points annualized [1].
Most small gaps may come from a few plain things:
The expense ratio
Cash drag between dividend receipt and reinvestment
Why direct indexing often accepts more drift
Direct indexing managers usually do not buy every stock. Instead, they often hold 150 to 250 stocks selected to keep expected tracking error low while still maintaining sector and factor constraints [1].
That sampling approach may be where drift starts. Then tax-loss harvesting may add another layer. When a manager sells a security at a loss and buys a correlated replacement, the portfolio may deviate from the benchmark on purpose for at least 31 days to avoid wash sale rules [1].
Standard direct indexing tracking error typically runs 20 to 100 basis points annualized [1]. Add ESG exclusions, sector tilts, or offsets for concentrated stock positions, and tracking error may rise to 150 to 250 basis points [1].
| Feature | Index ETFs | Direct Indexing (Standard) | Direct Indexing (Customized) |
|---|---|---|---|
| Typical tracking error | Very low | Higher | Highest |
| Primary source of deviation | Expense ratio, cash drag | Sampling and tax-loss harvesting trades | ESG exclusions, sector tilts, concentrated stock offsets |
| Benchmark fidelity | Extremely high | High | Moderate to low |
When tracking error is a feature, not a flaw
Higher tracking error is not automatically a problem. If the tax benefit may exceed the pre-tax deviation and the fee premium, the strategy may be doing what it was designed to do.
Direct indexing may produce an estimated tax benefit of 0.5% to 2.0% annualized in the early years [1]. For some investors, that may more than offset moderate tracking error.
The clearest case for accepting drift may be a concentrated low-basis position, such as founder stock, RSU vests, or executive company stock. In that case, the portfolio may be built to offset what the investor already owns, so some benchmark drift may be part of the goal. That tradeoff becomes the next part of the decision.
Decision framework: Which structure fits your portfolio
Use this checklist to line up the structure with your account type, tax situation, and need for customization.
A checklist for choosing between direct indexing and ETFs
Is the account taxable? Direct indexing may fit taxable accounts only.
How large is the taxable balance? Direct indexing typically may make the most sense at $500,000 or more. Below that level, the fee premium versus a low-cost ETF may outweigh the tax benefits [1].
What is your combined federal and state marginal tax rate? A 32% federal bracket or higher may make direct indexing more appealing, especially in high-tax states.
Do you need stock-level customization? ESG exclusions, sector tilts, or offsets for RSU vests or founder stock are only possible with direct indexing.
How much tracking error can you tolerate? If very tight benchmark tracking matters most, ETFs may be the cleaner fit.
When the choice still feels fuzzy, this table may help translate those filters into a starting point.
| Situation | May fit better |
|---|---|
| Taxable balance under $500,000 | ETFs |
| High tax rate (32%+ federal) with $500,000+ taxable | Direct indexing |
| Need for ESG exclusions or concentrated stock offsets | Direct indexing |
| Retirement account (401(k), IRA) | ETFs |
| Tight benchmark tracking required | ETFs |
Direct indexing’s tax benefit may be strongest early and may fade over time.
Wash-sale risk may be tougher to spot when holdings sit across more than one account. Consolidated account data may help surface overlapping holdings and wash-sale risk across taxable and retirement accounts. For example, a loss may be disallowed under wash-sale rules if a stock is sold at a loss in a taxable account and then bought back in an IRA within 30 days [1].
Key takeaways
ETFs may be the default fit for many U.S. investors: lower total cost, simpler tax reporting, and tighter benchmark tracking with little maintenance. Direct indexing may earn its higher fees when taxable assets are large, tax rates are high, and loss harvesting or customization openings are meaningful.
FAQs
How long do direct indexing tax benefits usually last?
Direct indexing tax benefits may be strongest early on.
In many cases, the most tax alpha may show up in the first 1 to 3 years, when fresh cost bases may create more room to harvest losses.
After that, the window may narrow. By years 3 to 5, harvesting opportunities may become less frequent. And by year 10, many accounts may have already realized most of their lifetime tax alpha.
That said, the pattern may not look the same for everyone. Benefits may last longer if an account receives new cash, goes through market corrections, or uses tax-aware extensions.
Can direct indexing make sense below $500,000?
Yes - but it may be more effective for larger portfolios.
Minimums have fallen as low as $5,000. Even so, in smaller accounts, the higher fees compared with a low-cost ETF may outweigh any tax benefits.
Smaller portfolios may also see limited tax savings while adding more complexity, including extra Form 8949 entries.
How much tracking error should I expect with custom screens?
With direct indexing, tracking error may often fall in the 20 to 100 basis point annualized range. In plain English, returns may stay within about 1 percentage point of the index.
Once you add custom screens - like ESG exclusions, sector tilts, or concentrated-stock offsets - tracking error may move up to 150 to 250 basis points. Because of that, some investors keep portfolios fairly close to neutral if their goal is to stay more aligned with the index.
Disclosures:
This content is for informational purposes only and does not constitute investment advice or a recommendation to buy or sell any security.
Past performance is not indicative of future results. No guarantee of future performance or outcomes is implied.
Savings and performance examples are hypothetical and for illustrative purposes only. Actual results will vary based on individual circumstances, portfolio composition, market conditions, and fees.