If I want the short answer, I’d use weighted overlap first. A stock count may show how many names two ETFs share. But weighted overlap may show how much of my money may sit in the same holdings.
Here’s the simple version:
Count overlap = shared stocks by number
Weighted overlap = shared exposure by portfolio weight
Count may look low even when the biggest holdings are the same
Weighted overlap may give a better read on duplicate exposure
A few examples from the article make the gap clear:
VTI vs. VOO: about 500 shared holdings and roughly 85% weighted overlap
SCHD vs. VYM: same broad income-focused space, but only about 19% weighted overlap
VOO vs. SPY: weighted overlap may be close to 100%, even if the holding lists are not perfectly identical
That’s the core idea: shared names and shared dollars are not the same thing.
The ETF Overlap Nobody's Talking About
Quick Comparison
| Method | What I’m measuring | What the number may tell me | Where it may mislead |
|---|---|---|---|
| Count overlap | How many holdings appear in both ETFs | Fund structure and breadth | It may understate duplicate exposure |
| Weighted overlap | How much portfolio weight is shared | Concentration and overlap risk | It may look high even when funds use different rules |
If I’m reviewing diversification across a brokerage account, IRA, and 401(k), weighted overlap may be the more useful starting point. Count still has a place - but more as a structure check than an exposure check.
Why counting shared stocks can give the wrong answer
Counting shared stocks may give a skewed view of ETF overlap because it leaves out position size. A simple count shows how many holdings appear in both funds. It does not show how much of each fund may be tied to those stocks.
That gap matters most when the shared names sit in tiny positions.
Two broad ETFs may share a long list of holdings without that overlap saying much about portfolio risk. A lot of shared names may still mean little duplicated exposure if those holdings make up only a small slice of each fund. The bigger issue may show up when the overlap sits in the top holdings.
Take Apple and Microsoft. In VOO, Apple makes up about 7.1% of the portfolio and Microsoft about 6.9%. In VGT, Apple’s weight is about 18.4% [2]. When the same mega-cap stocks show up across two ETFs, diversification may be lower than the fund names suggest.
That’s why overlap may be more useful when measured by weight, not just by count.
How weighted overlap works and why it is the better default for risk reviews
The smaller-weight method, step by step
For each shared holding, add the smaller weight from the two funds. That sum may be the weighted overlap percentage.
Here’s the key idea: a shared holding only counts up to the smaller position in the pair of funds.
Why weighted overlap fits a portfolio risk review
When overlap is about exposure, not just shared names, the smaller-weight method may be the right test.
The weighted method shows something a simple count may miss: concentration risk. The "Magnificent Seven" stocks represented approximately 32.5% of the S&P 500's weight as of Q1 2026 [1]. If two of your funds both hold those names at high weights, your portfolio may be less diversified than the number of funds suggests.
That’s the big difference. A stock-count approach may say two funds look fairly different because they don’t share many names. But if the names they do share make up a large slice of both funds, your exposure may still stack up in a narrow part of the market.
Use weighted overlap when you want to judge duplicate exposure or concentration risk. The next examples show how stock count and weighted overlap may produce very different answers.
Same funds, two very different overlap answers: side-by-side examples
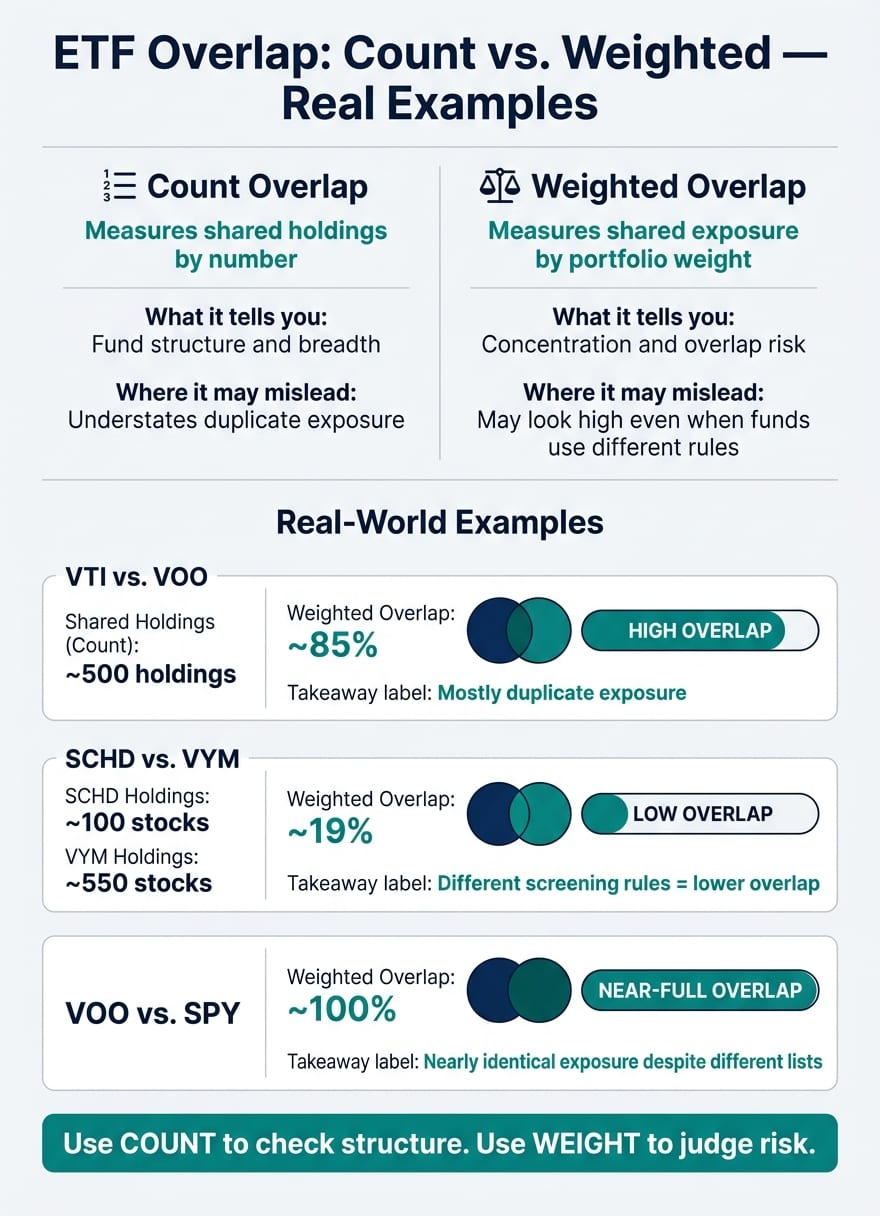
The method changes the answer. Count may describe structure, but weight may describe exposure. You see the gap most clearly when the same idea is viewed side by side.
Example 1: high shared count, high weighted overlap
VTI and VOO share about 500 holdings, and their weighted overlap is roughly 85% [2].
| Metric | Result |
|---|---|
| Shared holdings (count) | ~500 holdings [2] |
| Weighted overlap | ~85% [2] |
| Investor takeaway | Mostly duplicate exposure. |
If you look only at count, the overlap may seem modest. If you look at weight, the overlap appears much larger. VTI already holds most of VOO, so pairing the two may add little new exposure.
A high shared count may not always point to high portfolio risk. And the reverse may also happen.
Example 2: same category, lower weighted overlap
SCHD and VYM show the other side of the issue. SCHD focuses on about 100 stocks using quality and growth metrics, while VYM holds about 550 stocks based on current yield [2]. Their weighted overlap is only about 19% [2].
| Metric | Result |
|---|---|
| SCHD holdings | ~100 stocks [2] |
| VYM holdings | ~550 stocks [2] |
| Weighted overlap | ~19% [2] |
| Investor takeaway | Lower overlap; screening rules create different exposures. |
So even when two funds sit in the same category, they may look very different once weights enter the picture.
Decision rule: use count for structure, weight for risk
Count overlap may be useful for a quick structural check. But if the question is whether two ETFs may expose a portfolio to much of the same risk, weighted overlap may be the better default.
Use count to check structure. Use weight to judge risk.
These examples show why the overlap method matters; the next step is using that number in a full portfolio review.
How to use overlap percentage in a real portfolio review
Once you know how overlap is measured, the next step is applying it to your full portfolio.
What overlap alone does not tell you
Overlap is only a starting point. Two ETFs may look different by count and still duplicate a lot of exposure if both hold the same largest stocks. VTI, SPY, and QQQ may still leave nearly 40% of a portfolio in just ten stocks [2]. That’s why a portfolio review may work better when it pulls in all accounts instead of looking at each one on its own.
A practical checklist for U.S. investors reviewing multiple accounts
Don’t review accounts one by one. What may matter more is overlap across your full portfolio.
A simple way to handle it:
Review your taxable brokerage, Roth IRA, Traditional IRA, and 401(k) together.
Check weighted overlap first.
If two funds show high weighted overlap, ask whether both funds may still add new exposure.
Look at the largest shared positions, since they may drive most of the duplication.
Then decide whether each fund may still serve a separate role. If not, some investors choose to simplify their portfolio.
Conclusion: the right overlap method depends on the question you are asking
Weighted overlap may be the better default for many portfolio reviews because it measures duplicated exposure, not just duplicated names. Count overlap may work as a screening tool. Weighted overlap may be more useful as a diversification check.
Don’t assume two ETFs may be diversified just because they share few holdings by count. As the VOO vs. SPY example shows, funds may have ~100% weighted overlap while still holding slightly different lists [2]. Use count to understand structure. Use weight to judge duplicate exposure.
FAQs
What is considered high ETF overlap?
An ETF overlap percentage above 70% is often seen as high. That level may point to a lot of redundancy in a portfolio, which may weaken diversification and may increase exposure to the same stocks or sectors. It may also mean you’re paying management fees twice for holdings that look very similar.
An overlap of 40% to 70% may be more moderate and manageable, but it’s still worth watching. Below 40% is often viewed as lower overlap and may be more supportive of diversification.
Can two ETFs have low count overlap but high weighted overlap?
Yes. Two ETFs may share only a small number of holdings but still show high weighted overlap if those same stocks make up a large part of both portfolios.
That may happen when the biggest companies carry the heaviest weights. So even if count overlap looks low, your actual exposure may still be meaningful. That’s why weighted overlap may be useful for spotting hidden concentration.
Should I sell one fund if overlap is high?
Not always. Overlap above 70% may point to redundancy that weakens diversification and may add extra fee and tax costs, but selling may be just one path.
Start by figuring out whether the overlap was intentional or accidental.
If it wasn't intentional, some investors stop adding new money to those holdings and send future contributions elsewhere. Others review potential capital gains taxes and wash sale risk before deciding whether to sell.
Disclosures:
This content is for informational purposes only and does not constitute investment advice or a recommendation to buy or sell any security.
Past performance is not indicative of future results. No guarantee of future performance or outcomes is implied.
Savings and performance examples are hypothetical and for illustrative purposes only. Actual results will vary based on individual circumstances, portfolio composition, market conditions, and fees.