
Two ETFs may look different and still act like the same investment. If two funds share many of the same stocks, or if their returns move together with a correlation near 0.90+, your portfolio may have less diversification than the fund names suggest.
Here’s the short version:
Overlap looks at what two ETFs own
Correlation looks at how two ETFs move
High overlap may point to duplicated holdings
High correlation may point to similar risk, even with different holdings
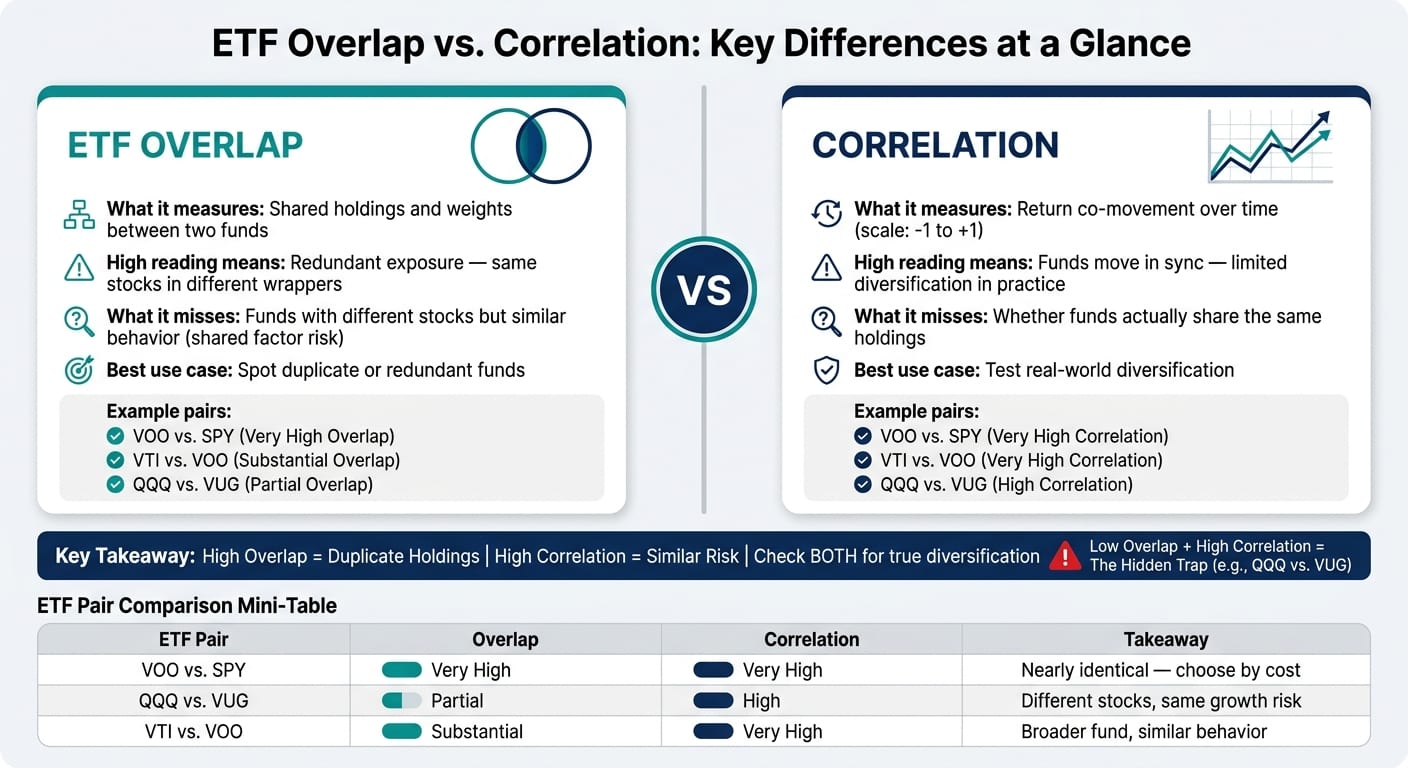
Common examples include VOO vs. SPY, QQQ vs. VUG, and VTI vs. VOO
A simple rule of thumb: if two equity ETFs share many of their top 10 holdings and those stocks make up a large share of each fund, they may be close to the same bet.
How to Optimize your ETFs Portfolio: Evaluating Correlation while minimizing redundancy|Google Colab
Quick Comparison
| Metric | What I’m looking at | High reading may mean | What it may miss |
|---|---|---|---|
| Overlap | Shared holdings and weights | Duplicate exposure | Funds with different stocks but similar behavior |
| Correlation | Return movement over time | Similar performance patterns | Whether the funds own the same stocks |
That’s the core idea: overlap may show duplication, while correlation may show whether diversification is limited in practice.
ETF overlap vs. correlation: a side-by-side comparison
After you spot possible duplication, the next step may be separating shared holdings from shared behavior. These two metrics may look similar at first glance, but they are not interchangeable.
ETF overlap measures duplicated exposure
Overlap measures how much of two ETFs' weight sits in the same stocks at similar weights. Put simply, it shows where two ETFs may amount to the same bet in different wrappers.
In day-to-day use, overlap may help show where exposure is duplicated. But it may miss shared factor risk. Two funds may hold different stocks and still react in similar ways if both are tied to the same sector, style, or market-cap shocks.
Correlation measures return behavior, not shared holdings
Correlation measures how closely two funds' returns have moved over time, on a scale from -1 to +1. In other words, correlation may show whether two ETFs actually add diversification.
High correlation does not require shared holdings. Two funds may own different stocks and still move together if they share sector, market-cap, or factor exposure. The reading may also change based on the lookback window and the market regime.
Why neither metric is enough on its own
Overlap tells you where your holdings are duplicated; correlation tells you where return behavior is similar. One may help you find duplicate holdings. The other may help you spot shared risk.
A pair of ETFs may show modest overlap and still move almost in lockstep because both funds are heavily concentrated in the same sector, market-cap band, or factor exposure [1]. That's the low-overlap, high-correlation trap. And it may be easy to miss if you're checking only one metric.
| Metric | What it measures | What high values mean | What it misses | Best use case |
|---|---|---|---|---|
| ETF Overlap | Duplicated holdings | Redundant exposure | Shared factor risk | Spot redundant funds |
| Correlation | Return co-movement | Moves in sync | Shared holdings not required | Test diversification |
The examples below show where overlap and correlation line up - and where they don't.
3 ETF matchups that show the difference
These three pairs show how overlap and correlation may point to very different portfolio exposures. Put simply, different labels may still hide the same risk.
| ETF Pair | Index | Top Holdings | Overlap | Return Correlation | Takeaway |
|---|---|---|---|---|---|
| VOO vs. SPY | Both track the S&P 500 | Broadly the same large-cap names | Very high | Very high | Holding both may not add much diversification; the choice may come down to cost and trading preferences |
| QQQ vs. VUG | Different growth-oriented U.S. large-cap indexes | Several of the same mega-cap growth names | Partial | High | The funds are not identical, but shared growth exposure may make them move in similar ways |
| VTI vs. VOO | Total market vs. large-cap U.S. stocks | Large-cap holdings dominate both | Substantial | Very high | VTI is broader, but the extra mid- and small-cap exposure may change returns less than many people expect |
VOO vs. SPY: different wrappers, same S&P 500 exposure
Start with the clearest case: two funds that are almost the same bet.
VOO and SPY both track the S&P 500, so owning both may add little to no diversification. For long-term investors, cost may matter more than anything else here. If you hold both, you may still have exposure to the same underlying market.
The next pair is less obvious. The overlap is lower, but the shared behavior may still be strong.
QQQ vs. VUG: different indexes, still tied to mega-cap growth
QQQ and VUG hold different stocks, but both lean heavily on mega-cap growth. Their overlap is only partial, yet their returns may still stay highly correlated.
Why may that happen? Because both funds are shaped by many of the same mega-cap growth names and similar sector weights. When mega-cap growth leads, both funds may move up. When that part of the market struggles, both may move down together. This is a classic example of low overlap and high correlation: different products, similar risk.
A similar pattern may show up when one fund looks broader on paper but still leans on the same large-cap names.
VTI vs. VOO: broader holdings list, similar large-cap behavior
VTI is broader than VOO because it includes U.S. stocks across the market-cap spectrum, while VOO focuses on large-cap companies. Even so, large caps may still drive most U.S. market returns.
VTI may diverge more from VOO during periods when smaller companies outperform. But across much of a normal market cycle, the two funds may still move in nearly the same direction.
Why funds with different labels still move together
Different ETF labels may hide the same underlying risk: shared holdings, sector exposure, and factor tilts. In many cases, the label itself matters less than the exposures sitting underneath it.
Shared sectors and mega-cap concentration
The biggest source of similarity may be shared ownership of mega-cap stocks. Apple, Microsoft, and Nvidia show up across many broad ETFs, so a portfolio may look diversified while still placing a large share of its assets in the same stocks [2].
Market-cap and factor tilts can override fund labels
Market-cap and factor labels describe how a fund selects stocks, not necessarily how it may behave. If two funds tilt toward the same large-growth names, they may still move in similar ways.
A "total market" fund and a "large-cap" fund may end up behaving very similarly when large caps dominate both. And a "growth" label versus a "core" label may matter less if both funds remain anchored to the same mega-cap names.
Put simply, the label shows how the fund is built, not the risk it may create.
That’s why the next step may be checking your actual holdings, not just the fund names.
How to check overlap and build a more deliberate portfolio
A simple process for spotting duplicate exposure
Once you know overlap and correlation are different, the next step may be to check your actual holdings.
Start by pulling every ETF, mutual fund, and stock you own into one list. That includes taxable accounts, IRAs, Roth IRAs, 401(k)s, and old employer accounts.
Then group each holding by its job in the portfolio: U.S. core, international, sector or thematic, and fixed income. From there, compare each fund’s top 10 to 20 holdings and look for the same names showing up again and again.
Next, calculate weighted overlap, meaning the shared weight in overlapping holdings. Then review 3- to 5-year correlation over that same period. Looking at both may help separate harmless overlap from actual redundancy.
| Signal | What to Check | Why It Matters | Options Some Investors Consider |
|---|---|---|---|
| More than one S&P 500 fund across accounts | Tickers, benchmarks, top 10 holdings | You may pay multiple expense ratios for nearly identical exposure | Consolidating into one core fund, after factoring in taxes and plan options |
| Same top holdings appearing in many ETFs | Total portfolio exposure to top stocks | Concentration risk and the appearance of diversification | Reducing overlapping funds; some investors add diversifiers such as international or small-cap exposure |
| Two funds with correlation above 0.90 | 3- to 5-year correlation | Behavior may be nearly identical despite different labels | Treating them as duplicates when reviewing whether to simplify the portfolio |
| Sector or thematic fund mirroring your core index | Sector weights vs. your core ETF | May overweight a sector you already own heavily | Re-sizing or trimming the sector fund to better match risk tolerance |
| Overlap above 70% between two funds | Weighted holdings overlap | High redundancy; you may be paying for much of the same exposure twice | Consolidating into the lower-cost fund over time |
For each ETF, ask a simple question: does it add exposure you do not already own? If the answer may be no, consolidation may make sense, often starting in tax-advantaged accounts.
Manual checks may work when you own only a few funds. Across many accounts, though, the process may get messy fast.
Using Mezzi to see your real exposure across all accounts
Mezzi connects to your accounts and breaks funds into their underlying holdings, so you can see total portfolio exposure in one view.
That may make it easier to see your combined S&P 500 exposure, spot unintended tech concentration, and identify gaps.
Mezzi shows the overlap; you decide what to change. That portfolio-wide view may be what turns overlap and correlation from abstract ideas into something you can actually use.
Conclusion: use overlap to find duplicate holdings and correlation to test diversification
Overlap shows duplicated holdings. Correlation shows similar behavior. Looking at both may help you cut redundant funds and test whether your portfolio may be more diversified than it first appears.
FAQs
What is a good ETF overlap percentage?
A good ETF overlap percentage may generally be below 40%. That may suggest your ETFs complement each other instead of holding many of the same stocks.
An overlap of 40% to 70% may be more moderate and still manageable for some investors, though some people may want to keep an eye on it to see whether the funds continue to serve different roles.
Once overlap goes above 70%, it may point to a lot of redundancy and less diversification across the portfolio.
Can two ETFs have low overlap but still move the same?
Yes. Two ETFs may have low holdings overlap but still move in similar ways if they share the same return drivers, like similar sector exposure, market-cap tilts, or sensitivity to broad market forces.
So a fund may look different on paper but act alike in practice. That's why some investors look at both overlap and correlation together.
Should I sell one of two highly correlated ETFs?
Not always. High overlap - often above 70% - may point to redundancy, concentration risk, and duplicate fees, but selling may not always make sense. The better move may depend on your goals, risk tolerance, and tax situation.
Before making changes, some investors use a portfolio analysis tool to check their actual exposure. If you rebalance, you may look at higher-fee or weaker-performing positions first. It may also make sense to watch for tax-loss harvesting and wash sale rules.
Disclosures:
This content is for informational purposes only and does not constitute investment advice or a recommendation to buy or sell any security.
Past performance is not indicative of future results. No guarantee of future performance or outcomes is implied.
Savings and performance examples are hypothetical and for illustrative purposes only. Actual results will vary based on individual circumstances, portfolio composition, market conditions, and fees.