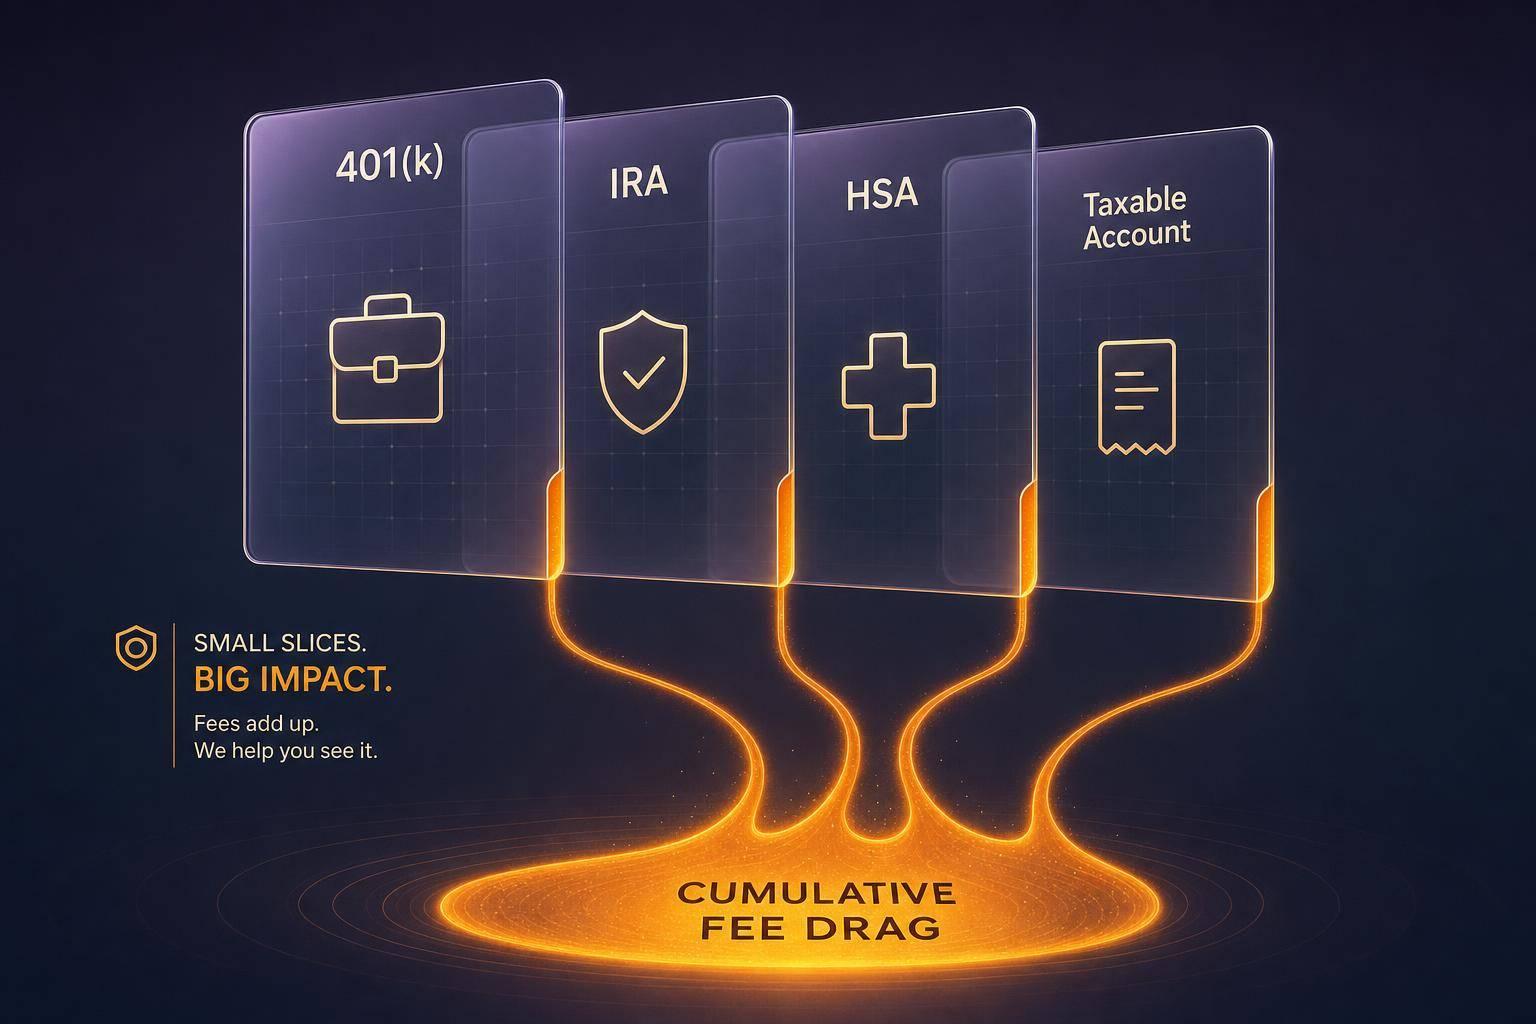
Small annual fees may add up to a much larger long-term gap than many people expect. In a household portfolio split across a 401(k), IRA, taxable account, HSA, and cash accounts, total fee drag may come from more than one line item. It may include advisory fees, fund expense ratios, plan fees, trading costs, tax friction, cash drag, and overlapping funds.
Here’s the short version:
A 1.0% annual drag on $500,000 may equal about $5,000 per year
On $1,000,000, that same drag may equal about $10,000 per year
Over 30 years, the gap between a 0.25% fee level and a 2.00% fee level on $500,000 at a 7.00% gross return may exceed $1,000,000
What looks “low-cost” in one account may still add up to a much higher household-level cost
What I take from this article is simple: the problem may not be one expensive account. It may be a stack of smaller costs spread across many accounts, many providers, and many statements.
The main fee sources covered here are:
Advisory or AUM fees
Mutual fund and ETF expense ratios
401(k) plan and admin fees
Trading spreads and turnover costs
Tax drag in taxable accounts
Idle cash earning too little
Duplicate holdings across accounts
If I wanted one takeaway, it would be this: the first step may be to view every account as one portfolio, then estimate one all-in annual cost for the whole household.
| Cost area | What it may look like |
|---|---|
| Advisory fee | 0.50%–1.25% a year |
| Index fund costs | Around 0.05%–0.16% |
| Active fund costs | Around 0.59%–0.78% |
| 401(k) fees | Flat fees plus asset-based charges |
| Cash drag | Lower yield on idle balances |
| Overlap | Paying more than once for similar exposure |
The article then walks through where those costs may hide, how compounding may magnify them over time, and how some investors may review accounts, trim overlap, reduce idle cash, and compare lower-cost fund options.
Where fee drag hides in the average U.S. portfolio
Advisory fees, fund expenses, and trading costs
The advisory fee may be only the first layer. A managed advisory account fee may sit on top of fund expense ratios, which may push total annual cost near 1.00% before trading costs are even counted. That stacking effect may become more pronounced when active funds are part of the mix.
Recent ICI data puts asset-weighted average expense ratios for actively managed equity mutual funds at around 0.59% to 0.64%, compared with about 0.05% for index equity mutual funds and roughly 0.11% for passive/index funds overall.[2][3][5] So an advisor charging 1.00% who uses higher-cost active funds may bring total annual cost into the 1.50% to 2.00% range once fund expenses and platform fees are added.[4][14]
Then there's another layer that many people may not notice at first: trading costs. Spreads, market impact, and turnover may add costs in the background, and those costs may be similar to, or even higher than, management fees.[6]
401(k) plan fees and cash drag
The same kind of layering may show up inside retirement plans. In many 401(k)s, fees are bundled together, which may make them easy to overlook. Smaller 401(k) plans often carry higher percentage-based recordkeeping and administration costs, along with fund fees built into the plan itself.[7][8][9][11] Those costs may sit alongside taxable account and brokerage account expenses as one more part of a household's total annual cost.
Cash drag may build quietly too. Idle cash in brokerage sweep accounts, uninvested retirement contributions, HSA cash reserves, and leftover balances after rebalancing may all earn less than the portfolio's target return. Usually, the issue may not be one big cash pile. It may be lots of small balances spread across several accounts.[10][12][13]
Overlapping holdings and duplicated fees
Fee drag may climb again when the same market exposure shows up in more than one account. A common setup might look like this: an S&P 500 ETF in taxable, a total market index fund in a Roth IRA, and a large-cap growth option inside a 401(k). All three may hold many of the same companies, so investors may end up paying multiple expense ratios for exposure that looks very similar.
The cost gap may be larger than it first appears. A low-cost ETF like VOO costs about $30 per year per $100,000 invested, while an actively managed large-cap fund at 0.75% costs $750 per year on the same balance - 25 times more.[1][2] Spread across several overlapping positions, those duplicated fees may become a drag on a household's total return.
These are the main categories that usually make up a household's total annual cost:
| Fee Category | Typical Range |
|---|---|
| Advisory (AUM) fees | 0.50%–1.25% annually |
| Fund expense ratios (index) | 0.05%–0.16% |
| Fund expense ratios (active) | 0.59%–0.78% |
| 401(k) plan/admin fees | $45–$80 per participant + % of assets |
| Trading costs (spreads/turnover) | Variable |
| Cash drag | Opportunity cost on idle balances |
Video: Why One Advisor Charges NY Cops Half the Standard Fee
How small annual fees turn into large long-term losses
The math behind compounding fee drag
Once fee drag comes into view, the next question may be simple: how much does it add up to over time?
In a multi-account portfolio, even small fees across taxable, retirement, and brokerage accounts may add up to a large household-level loss. Fees may reduce annual returns and may leave less capital in place to compound. The bigger issue may be the compounding you no longer get: every dollar paid in fees may stop earning future returns. Over time, that effect may stack up year after year and may remove a large share of ending wealth.[19]
The U.S. Department of Labor shows that an extra 1.00% in annual 401(k) fees may cut retirement savings by about 28% over 35 years, even if contributions do not change.[15] That may mean more than a quarter of a retirement balance disappears due to fees rather than market performance.
Typical all-in cost ranges for multi-account investors
A low-cost portfolio built with low-cost index funds and no advisory layer may run about 0.20% to 0.50% per year all-in. A more common setup - money spread across a 401(k) with plan fees, an IRA with higher-cost funds, and a taxable account with an advisory fee - may reach 1.00% to 2.00% annually once advisory fees, fund expense ratios, plan fees, trading costs, and cash drag are included.[16][18]
What tends to matter is the household-wide weighted average. A low-cost Roth IRA may not offset a high-fee 401(k) or an advisory account charging 1.00% plus fund expenses. Over decades, that gap may become hard to ignore.
Table: 30-year impact of 0.25%, 1.50%, and 2.00% total fees
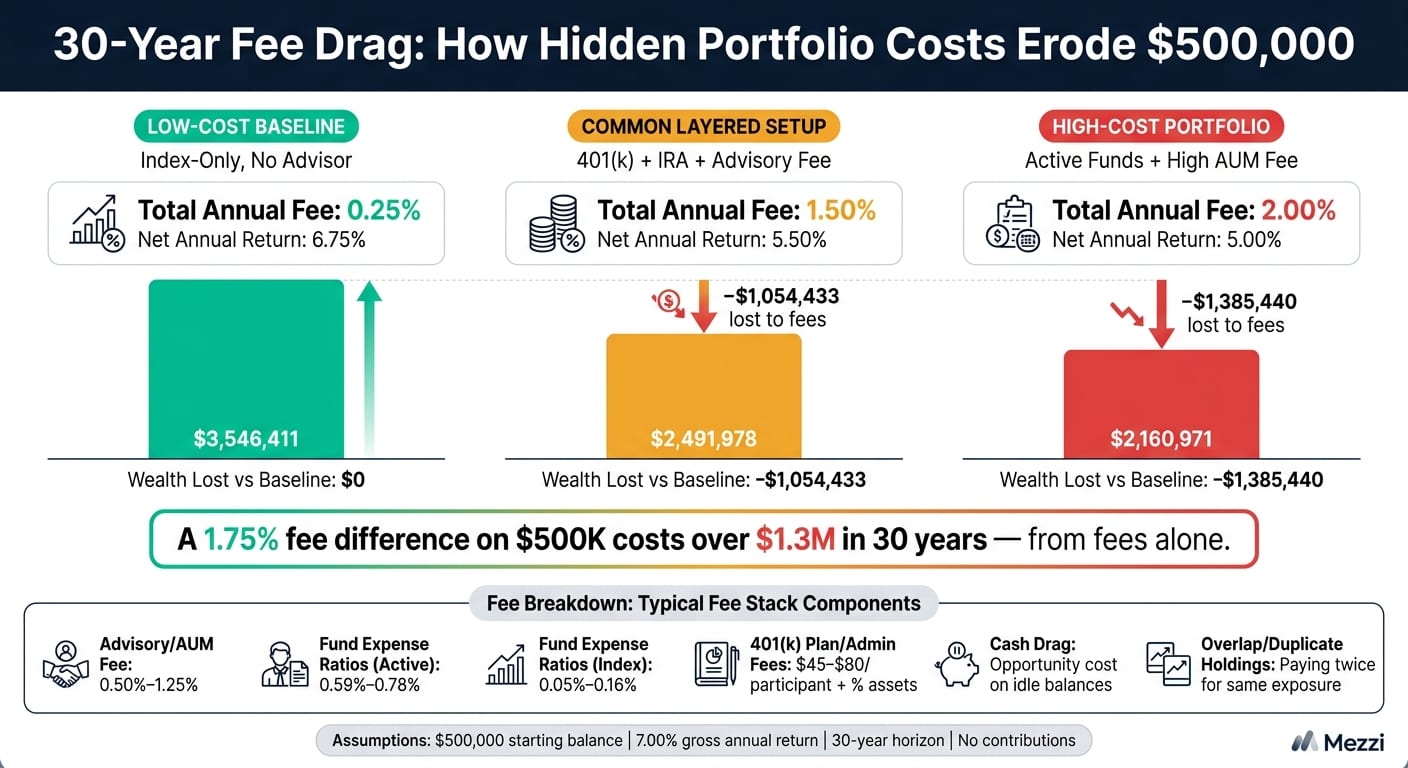
The same fee stack that looks small in one account may look very different when applied across the whole portfolio. The table below assumes a $500,000 starting balance and a 7.00% gross annual return. Only total fees change. The last column shows the wealth gap versus the low-cost baseline.
| Scenario | Gross Annual Return | Total Annual Fee | Net Annual Return | Value After 30 Years | Wealth Lost vs. 0.25% |
|---|---|---|---|---|---|
| Low-Cost Baseline | 7.00% | 0.25% | 6.75% | $3,546,411 | $0 |
| Common Layered Setup | 7.00% | 1.50% | 5.50% | $2,491,978 | −$1,054,433 |
| High-Cost Portfolio | 7.00% | 2.00% | 5.00% | $2,160,971 | −$1,385,440 |
The gap between the low-cost and common layered scenarios may exceed $1 million on the same starting balance with the same market return. In this example, that difference comes from fees alone. The next step may be to identify which fees are driving that loss across each account.
How to audit and reduce fee drag across all accounts
Run a full fee audit across taxable, retirement, and brokerage accounts
Start by turning all those scattered account costs into one household-wide number: your weighted average annual cost.
Put every taxable, retirement, brokerage, and employer plan account into one sheet. Include the provider, account type, and current balance. The goal is simple: see fee drag across the whole household, not account by account.
Then pull the documents that show what each account may actually cost. For managed accounts, that usually means the Form ADV Part 2A and the advisory agreement so you can log AUM fees, wrap fees, and platform fees. For workplace plans, pull the 404(a)(5) notice and any 408(b)(2) disclosure so you can log fund expense ratios, plan fees, and managed-account fees.
Once you have the paperwork, record the expense ratio for every fund and ETF you hold. Broad equity and core bond funds above 0.50%–0.75% may be the first places to look for lower-cost replacements. Add those costs into a per-account total, then weight each account by its share of household assets. That may give you your all-in fee rate.
It also helps to split costs into two buckets:
Less avoidable costs, like some plan-level fees
More avoidable costs, like high fund expense ratios or advisory layers
That split may show where the biggest fee pressure sits.
Once the full cost picture is on the page, many people focus first on the highest-fee accounts and holdings.
Consolidate accounts where it reduces fees and complexity
Consolidation may make sense when the fee savings outweigh the benefits you may give up.
For example, a 401(k) with 0.85% fund costs plus a 0.25% admin fee may be worth comparing against a rollover option if another account offers 0.05% index funds and no explicit admin fee.
At the same time, some employer-plan features may still be worth keeping. That may include institutional share classes with lower expense ratios than retail IRAs, ongoing employer matching, access to stable value funds, and ERISA creditor protections that may matter for high-litigation-risk professionals such as physicians or business owners.[20][22]
So before moving assets, compare the full tradeoff: all-in fees, number of accounts, and any benefits that may be lost.
Replace expensive funds, reduce idle cash, and clean up overlap
After consolidation, the next step is to look inside each account for remaining drag.
Fund swaps may offer one of the biggest cuts in cost with limited disruption. Map each holding to its asset class, flag funds that sit far above low-cost benchmarks, and compare them with a lower-cost share class or fund in the same category. Replacing a 0.90% actively managed large-cap fund with a 0.05% broad U.S. index ETF may reduce annual drag by 0.85 percentage points without changing the equity allocation itself. Large positions often matter most. A $50,000 holding in a 0.90% fund may cost about $425 per year more than the same position in a 0.05% fund, year after year.[23][25]
Idle cash deserves the same scrutiny. Cash above 5%–10% of the portfolio may weigh on returns because it may earn less than invested assets.[21][24][17] Some investors move excess cash into short-term bond funds or a high-yield cash management option when that fits their setup and risk tolerance. After that, a look-through review across the household portfolio may help spot overlapping holdings and duplicate expense ratios.
Using Mezzi to see the full picture and act with confidence

Why full-account visibility matters for fee analysis
If manual fee audits feel slow, Mezzi puts the same account data in one place. It connects to 401(k)s, IRAs, taxable brokerage accounts, and other investment accounts through read-only access. Once you link accounts, Mezzi may calculate your portfolio-wide fee drag across the full mix, not just one account at a time. And that matters, because an account that looks low-cost on its own may turn out to carry a much higher all-in fee rate when viewed alongside everything else.
How Mezzi surfaces overlap, cash drag, and tax-related friction
Mezzi’s X-Ray analysis looks across connected accounts and groups holdings by underlying exposure - large-cap U.S. equity, international equity, core bonds - instead of just listing them by account. From there, it flags positions that may deliver the same exposure at different costs. For example, if you hold three actively managed U.S. equity funds across a 401(k) and IRA with a blended cost near 0.90%, Mezzi may show that a single low-cost index fund might cover similar exposure for 0.05%–0.10%.
After overlap, idle cash may be the next easiest leak to spot. Mezzi aggregates cash and sweep balances across accounts and estimates the opportunity cost against a cash benchmark. If $40,000 sits in cash earning 0.25% instead of 4.0%, the annual drag may be about $1,500.
Mezzi also flags tax drag, including tax-inefficient fund placement, such as high-turnover active funds held in taxable accounts. It may also flag potential wash sale risk when a security is sold at a loss in one account but repurchased in another within the 30-day window. Some investors may use those flags to rebalance, sell, or move assets within the accounts they already have.
Conclusion: What investors can recover by cutting hidden fees
Once fee drag is visible across every account, the next step for some investors may be to cut the biggest leaks first. In a multi-account portfolio, total fee drag may be larger than it appears from any one account alone. The biggest sources may include advisory fees, fund expenses, plan fees, cash drag, and duplicate exposure.
The math may add up faster than many people expect. In a hypothetical $100,000 portfolio earning 7% gross, paying 0.25% instead of 2.00% in annual fees may leave about $710,000 versus $432,000 after 30 years - a gap of nearly $277,000 tied to fees alone.
A practical starting point may be measurement. Get the full portfolio cost across every account first. Then, with Mezzi’s diagnostics, some investors may work through the layers that may not be earning their keep, starting with the largest and most avoidable costs, while keeping full control over their accounts and how any changes are made.
FAQs
What is fee drag?
Fee drag refers to the drop in investment returns tied to costs like advisory fees, fund expense ratios, transaction costs, and tax inefficiencies.
These charges may be easy to miss because they're often taken from account assets or folded into fund performance. Over time, even small percentage-based fees may reduce both your principal and the future growth that money may have generated.
How do I calculate my all-in portfolio fee?
Add up the direct and indirect costs across every account you hold, including 401(k)s, IRAs, and taxable brokerage accounts. Focus on three areas: fund expense ratios, advisory fees, and other charges like trading commissions or account maintenance fees.
To estimate annual cost, multiply each account or fund balance by its fee percentage, then total the results. For example, a $75,000 portfolio with a 1.2% all-in fee may cost about $900 per year.
Which hidden costs should I check first?
Start with expense ratios, then review any 401(k) or IRA advisory or administrative fees. After that, check for overlapping holdings across accounts. When the same or similar funds show up in more than one place, duplicate fund fees may add up.
Then look at cash drag, trading costs, and tax costs in taxable accounts tied to high turnover or capital-gains distributions. Recent statements and fund prospectuses may show where fees are concentrated before any changes are made.
Disclosures:
This content is for informational purposes only and does not constitute investment advice or a recommendation to buy or sell any security.
Past performance is not indicative of future results. No guarantee of future performance or outcomes is implied.
Savings and performance examples are hypothetical and for illustrative purposes only. Actual results will vary based on individual circumstances, portfolio composition, market conditions, and fees.