
$2 million may be enough for retirement - or it may fall short. The answer usually comes down to how much you spend, how long retirement lasts, how much you withdraw, how your money is invested, how much goes to taxes, and what healthcare may cost.
Here’s the short version:
If you spend $60,000 a year and Social Security covers a large share, $2,000,000 may go a long way
If you spend $120,000 a year in a high-cost area, the same balance may face more pressure
A 3% withdrawal rate means $60,000 from the portfolio in year one, while 5% means $100,000
Retiring at 55 may mean funding 35 to 40 years; retiring at 65 may mean 25 to 30 years
Taxes, Medicare surcharges, and healthcare costs may cut into what looks like a solid income plan
A couple may also need to account for late-life care, which may add $200,000+ in some cases
The big idea is simple: retirement is not just about hitting $2 million. It’s about turning that balance into income that may last.
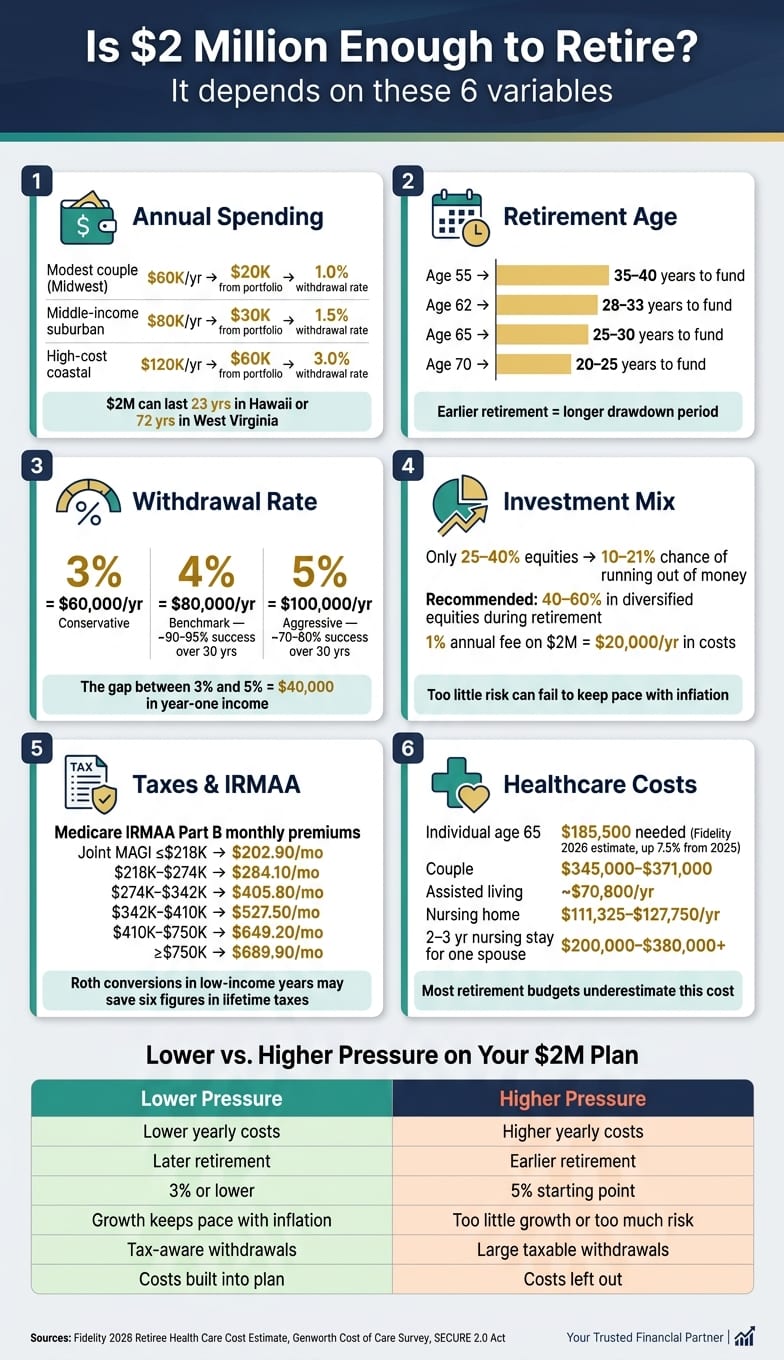
Is $2 Million Enough to Retire? What about $3 Million?
Quick comparison
| Variable | Lower pressure on plan | Higher pressure on plan |
|---|---|---|
| Spending | Lower yearly costs | Higher yearly costs |
| Retirement age | Later retirement | Earlier retirement |
| Withdrawal rate | 3% or lower starting point | 5% starting point |
| Investment mix | Enough growth to keep pace with inflation | Too little growth or too much risk |
| Taxes | More tax-aware withdrawals | Large taxable withdrawals |
| Healthcare | Costs built into the plan | Costs left out |
If I were sizing up a $2 million retirement plan, I’d start with those six inputs before making any yes-or-no call.
The Six Variables That Decide Whether $2,000,000 Is Enough
1. Annual spending: the number that drives everything else
Spending sits at the center of retirement math. It shapes how much you may need to pull from the portfolio and what withdrawal rate may fit.
A simple way to think about it is to split expenses into two buckets:
Essential expenses: housing, groceries, utilities, basic transportation, Medicare premiums and supplements, insurance, and property taxes
Discretionary expenses: travel, dining out, hobbies, gifts, help for adult children, and home upgrades
That split matters. In a rough year, discretionary spending may be easier to trim. Essential spending usually may not be.
Here’s how the math may look for three hypothetical U.S. households, each with $2,000,000 saved:
| Household Profile | Annual Spending | Social Security Income | Portfolio Withdrawal | Withdrawal Rate |
|---|---|---|---|---|
| Modest-spending couple, low-cost Midwest or Southern state | $60,000 | $40,000 | $20,000 | 1.0% |
| Middle-income suburban couple | $80,000 | $50,000 | $30,000 | 1.5% |
| Higher-spending couple, high-cost coastal city | $120,000 | $60,000 | $60,000 | 3.0% |
At 3%, the plan may still work, but the margin for error may be thin. A health shock or a weak market stretch may put more pressure on it. Cost of living changes the math fast: one analysis found that $2,000,000 plus Social Security may last 23 years in Hawaii and 72 years in West Virginia.[2]
Once spending is clear, the next issue is time. How many years may those expenses need to cover?
2. Retirement age and time horizon: retiring at 55 is not the same as retiring at 65
Retiring earlier may stretch the drawdown period and shorten the years available for compounding before retirement. Retiring at 55 may mean funding 35 to 40 years of expenses. Retiring at 65 more often means 25 to 30 years. That gap may change almost every input in the plan.
Some people plan to 90 or 95 to account for longevity and a surviving spouse.
Social Security adds another moving part. A worker with a full retirement age benefit of $2,500 per month might receive only about $1,750 per month, or roughly $21,000 per year, by claiming at 62. Waiting until 70 could increase that to about $3,100 to $3,300 per month, or roughly $37,000 to $40,000 per year. Retiring at 62 while delaying Social Security may put more pressure on the portfolio in the early years, but it may also mean more guaranteed income later.
| Retirement Age | Years to Age 90/95 | Planning Implication |
|---|---|---|
| 55 | 35–40 years | May call for a lower starting withdrawal rate and more growth-oriented investing |
| 62 | 28–33 years | Still a long horizon, so flexibility matters |
| 65 | 25–30 years | Around 4% is often the benchmark starting point |
| 70 | 20–25 years | May be somewhat more flexible if guaranteed income is already in place |
3. Withdrawal rate: 3%, 4%, or 5% changes the answer
The withdrawal rate may matter almost as much as the portfolio size itself. On $2,000,000, the gap between 3% and 5% is $40,000 in first-year income. That’s not a small difference. It may also separate a more cautious plan from one that carries a higher chance of running short over time.
A 3% withdrawal produces $60,000, a 4% withdrawal produces $80,000, and a 5% withdrawal produces $100,000 in year one. If a couple also receives $50,000 from Social Security, total gross income may range from $110,000 to $150,000, depending on the rate used. Historical research suggests a 4% starting withdrawal may succeed roughly 90% to 95% of the time over 30 years, while 5% drops to about 70% to 80%. That lower success rate may be acceptable only for people willing to cut spending when markets turn.[3][4][5]
Early market returns may matter a lot. Poor returns in the first few years may hurt a retirement portfolio more than later declines, because withdrawals may lock in losses. Some retirees keep a one- to two-year cash or bond buffer with the goal of reducing the need to sell stocks at the wrong time.
Next, the portfolio mix, tax location, and healthcare costs shape how much of that income you may actually keep.
What Most Retirement Plans Get Wrong: Returns, Taxes, and Healthcare
4. Investment mix and expected returns: too little risk can fail to keep pace with inflation
Too little risk may be just as much of a problem as too much. Even what looks like a safe withdrawal rate may fall short if the portfolio mix, tax picture, and healthcare costs don't line up well. Research suggests that portfolios with only 25%–40% in equities may face a 10%–21% chance of running out of money over a long retirement, partly because returns may not keep pace with inflation and rising expenses.[7]
Inflation slowly chips away at buying power. That's one reason many retirement plans keep 40%–60% in diversified equities, even during retirement, with the goal of generating enough growth to support withdrawals over time.[8][9] The balance is tricky: retirees may need enough growth to stay ahead of inflation, but not so much risk that early losses lead to poorly timed sales.
Fees and duplicate holdings may weigh on returns too. A common example: someone owns a total U.S. stock fund, a large-cap fund, and an S&P 500 fund at the same time. On paper, that may look diversified. In practice, it may just be overlap.
And fees add up fast. A 1% annual fee on a $2,000,000 portfolio comes to $20,000 per year. Asset location may matter as well. Holding tax-inefficient assets like REITs or high-yield bonds inside tax-advantaged accounts, while keeping tax-efficient index funds in taxable accounts, may improve after-tax returns without adding market risk.
Even a decent allocation may fall short if taxes and healthcare costs are left out of the picture.
5. Taxes: two $2 million portfolios can produce very different after-tax income
Two portfolios with the same balance may produce very different spendable income after taxes. A portfolio with more money in traditional IRA assets may leave less after-tax income than one with more Roth assets. In other words, where assets sit may matter just as much as what they earn.
Retirement may also create a low-income window for Roth conversions before Social Security and RMDs increase taxable income. RMDs now generally begin at age 73 under SECURE 2.0, rising to 75 for younger cohorts.[14][15][16] Some households convert traditional IRA funds into Roth accounts during lower-income years while intentionally filling the 12% or 22% federal tax brackets, and that approach may reduce lifetime taxes by six figures in some cases.[18]
Then there's Medicare IRMAA. These income-based surcharges on Part B and Part D premiums begin at set income thresholds and may lift healthcare costs if a large IRA withdrawal or Roth conversion pushes income into a higher tier.[17]
| Single Filers MAGI | Joint Filers MAGI | Total Part B Premium |
|---|---|---|
| ≤ $109,000 | ≤ $218,000 | $202.90/month |
| $109,001 – $137,000 | $218,001 – $274,000 | $284.10/month |
| $137,001 – $171,000 | $274,001 – $342,000 | $405.80/month |
| $171,001 – $205,000 | $342,001 – $410,000 | $527.50/month |
| $205,001 – $499,999 | $410,001 – $749,999 | $649.20/month |
| ≥ $500,000 | ≥ $750,000 | $689.90/month |
A couple moving from the base tier into Tier 2 would pay an extra $81.20 per person per month, or about $974 per year per person, on Part B alone.[17] That kind of jump is why some retirees coordinate withdrawals, Roth conversions, and asset sales so income may stay just below those thresholds.
6. Healthcare and long-term care: the expense most plans underestimate
Many retirement budgets roll healthcare into general living expenses. That may understate the issue. Healthcare and long-term care may create large late-life costs that basic spending estimates miss.
Fidelity's 2026 Retiree Health Care Cost Estimate places the average healthcare need for a 65-year-old individual retiring in 2026 at $185,500 in after-tax savings - up from $172,500 in 2025, a 7.5% jump in a single year.[10][12][13] For a couple, the estimate rises to roughly $345,000–$371,000, and that figure does not include long-term care.[11] These estimates assume enrollment in original Medicare Parts A and B, with no employer retiree coverage.[1]
Long-term care sits in its own category. According to Genworth's Cost of Care Survey, the national median annual cost is around $70,800 for assisted living and $111,325–$127,750 for nursing home care.[6] A two- to three-year nursing home stay for one spouse may cost $200,000–$380,000 or more, which may put pressure on the surviving spouse's plan.[6]
Some people look at a few ways to prepare for that risk:
long-term care insurance
hybrid life/LTC policies
a dedicated healthcare reserve
Once those costs are added in, the retirement plan may need stress-testing across a range of scenarios.
How to Test Your Plan and Improve the Odds
Run multiple scenarios, not a single forecast
Once you have the six variables, the next step is to test how they may play out together in real life. A single projection with fixed spending and steady returns may tell you very little. Markets rarely move in straight lines, and life doesn't tend to follow a neat script.
Start with a baseline. For example: retire at 65, spend $100,000 per year adjusted for inflation, use a 60/40 stock-bond mix, and claim Social Security at 67. From there, change one variable at a time and see what puts pressure on the plan. Monte Carlo calculators run hundreds or thousands of trials using randomized returns and inflation. Instead of one neat forecast, they turn those inputs into a probability of success.[19][20][21]
Results may shift fast. If a set of scenarios shows the plan falling short, the strongest lever may be spending, not asset allocation. Working a few more years may help in two ways: it shortens the withdrawal period, and it may increase Social Security benefits. The point is to find a mix of spending, age, and risk that you may be able to live with over time.
After you land on a spending range that looks workable, check the tax side. Portfolio value on paper and money you may actually spend are not the same thing.
Plan withdrawals and account location with taxes in mind
Taxes may change the gap between gross portfolio value and spendable income. And a poor withdrawal sequence may cost more than a rough market year. Some investors use taxable accounts first, then draw from tax-deferred accounts up to a chosen tax bracket, while saving Roth assets for later-life spending or heirs.
Early retirement, before Social Security and RMDs begin, may create a window for partial Roth conversions at lower tax rates. Asset location matters too. Some investors place tax-inefficient assets, such as high-yield bonds or actively managed funds, inside tax-deferred accounts, while holding broad index ETFs in taxable accounts. That setup may reduce annual tax drag without changing the overall risk profile. Tax rules are complex and subject to change, so it may make sense to confirm any specific move with a qualified tax professional.
Then keep an eye on those assumptions over time. Withdrawals change. Markets change. Account balances change too.
Monitor your full portfolio with Mezzi

Mezzi connects your 401(k), IRA, Roth IRA, taxable brokerage accounts, and HSA to give you a full household view. From that aggregated picture, it surfaces retirement readiness insights based on your actual balances and allocation, flags when your effective withdrawal rate may be drifting into riskier territory, identifies holding overlap across funds with its X-Ray tool, and highlights tax-aware withdrawal sequencing suggestions, including Roth conversion timing and RMD considerations.
It also tracks wash sale risk across connected accounts, which may be useful when tax-loss harvesting in a taxable account. Mezzi flags issues; you make the trades and withdrawals. As an SEC-registered fiduciary, it has a legal duty to act in your interest, with the goal of helping you keep the plan aligned as markets shift, spending changes, and tax laws change.
Conclusion: $2,000,000 Works Only When the Variables Line Up
The answer may not be a simple yes or no. It may depend on how the six variables line up in your plan.
The same $2,000,000 may work for one retiree and may fall short for another. A later start, lower spending, and a lower withdrawal rate may make that balance last longer. Even then, taxes may change how much income you actually keep.
Taxes may cut into spendable income more than many people expect. That’s why account mix and withdrawal order may matter just as much as the headline balance. And even a tax-aware plan may start to strain if healthcare costs are underestimated.
In retirement, spending, timing, portfolio risk, taxes, and healthcare costs may all interact with each other. So a plan that looks solid on paper may depend on all six lining up.
A practical next move may be to test your numbers instead of leaning on a single estimate. Mezzi is designed to let you test your full household plan across accounts, Social Security and other guaranteed income estimates, and different scenarios, including:
a conservative case
a base case
a stress test for early poor returns or higher healthcare costs
That process may show which variable puts the most pressure on your plan, and where a small adjustment may make the biggest difference.
FAQs
How much annual spending can $2 million realistically support?
It depends on your spending needs and withdrawal strategy.
A common starting point may be the 4% rule: an initial $80,000 annual withdrawal, adjusted for inflation, with the goal of lasting about 30 years.
Your spending level may end up higher or lower based on taxes, investment returns, and health care costs. Tax-aware withdrawals across taxable, tax-deferred, and Roth accounts may increase usable income and may help your portfolio last longer.
What withdrawal rate is safest for a long retirement?
The 4% rule is a common retirement guideline. The basic idea: withdraw 4% of your starting portfolio in your first year of retirement, then adjust that dollar amount each year for inflation. It’s meant to help savings last for about 30 years.
That said, it’s not a one-size-fits-all rule. A longer retirement timeline or weak market returns early on may change the picture. In those cases, a withdrawal rate in the 3.5% to 4% range is often viewed as the safer end of the spectrum, while 6% or 7% may come with a higher chance of running out of money sooner.
How should I factor taxes and healthcare into my retirement number?
Treat taxes and healthcare as separate retirement costs. That small shift may change how the math looks.
Healthcare, in particular, may rise faster than inflation. Because of that, some people budget it outside of day-to-day living costs instead of folding it into groceries, housing, and travel. Fidelity's 2026 estimate puts it at about $185,500 in after-tax savings for a single person and roughly $345,000–$371,000 for a couple. HSAs may also play a role for some households.
Taxes deserve their own line item too. One practical way to think about them is to start with your after-tax income goal, not the amount you plan to withdraw. If money comes from Traditional accounts, those withdrawals may be taxed as ordinary income. So to end up with the income you want to spend, you may need to withdraw 20% to 30% more.
Some retirees also use a tax-efficient withdrawal order to manage how different account types are tapped over time.
Disclosures:
This content is for informational purposes only and does not constitute investment advice or a recommendation to buy or sell any security.
Past performance is not indicative of future results. No guarantee of future performance or outcomes is implied.
Savings and performance examples are hypothetical and for illustrative purposes only. Actual results will vary based on individual circumstances, portfolio composition, market conditions, and fees.
Registration does not imply a certain level of skill or that the SEC has approved the company or its services.