
A stock that looks like 4% in one account may end up closer to 9% or 10% once I count the same name inside ETFs and mutual funds across all accounts.
That’s the whole point here: if I want a stock’s true weight, I may need to add direct shares + fund look-through exposure, then divide by my total investable portfolio. For example, $45,000 of Apple exposure in a $450,000 portfolio may put Apple near 10.0% overall.
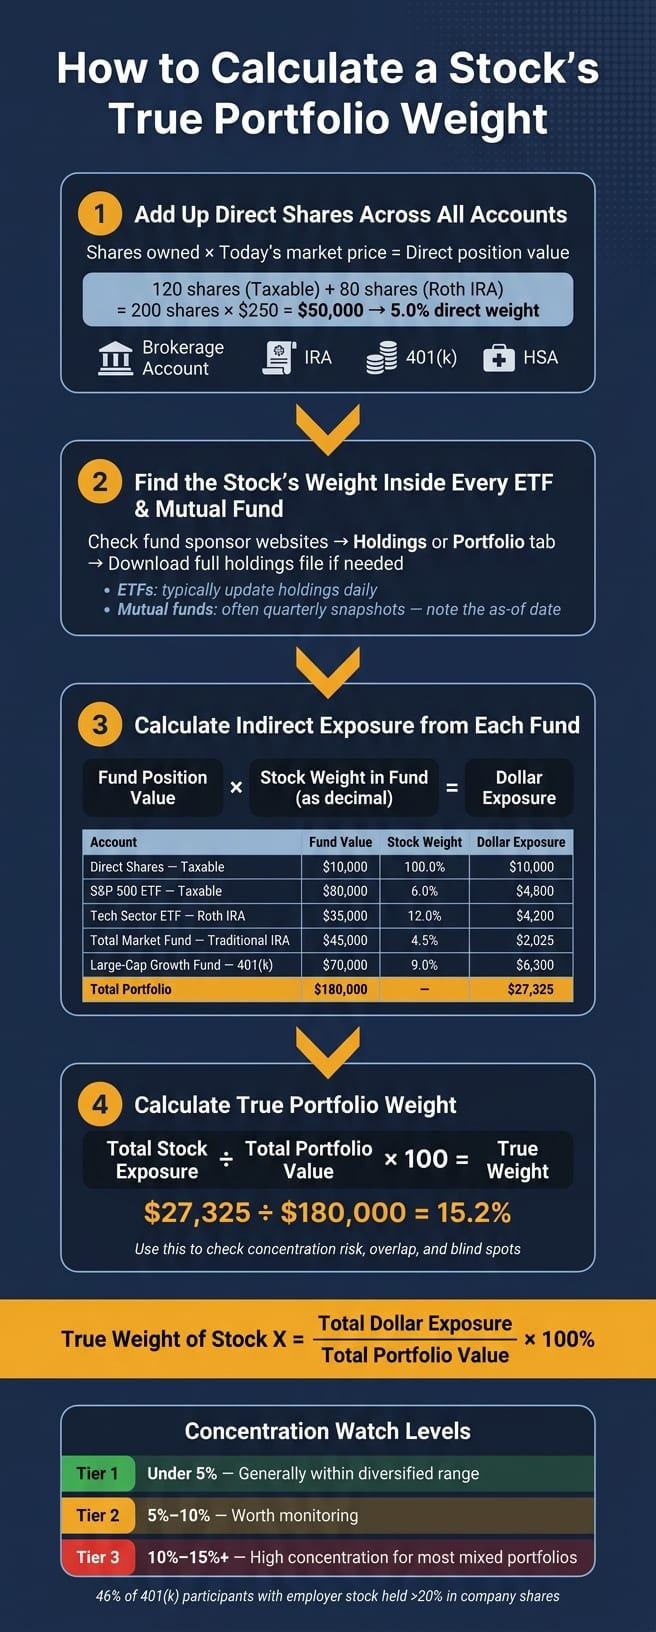
Here’s the short version:
Step 1: Add up the stock I own directly in every investable account
Step 2: Find that stock’s weight inside each ETF and mutual fund I own
Step 3: Multiply each fund position by the stock’s fund weight
Step 4: Add all stock exposure together and divide by total portfolio value
A simple example:
Direct shares: $10,000
ETF and fund look-through exposure: $17,325
Total stock exposure: $27,325
Total portfolio: $180,000
True weight: 15.2%
That number may tell me whether I have a planned overweight or just overlap that built up over time. It may also shape how I think about rebalancing, adding new money, or tax moves.
If I want the clean formula, it’s this:
True weight of Stock X = Total dollar exposure to Stock X across all accounts and funds ÷ Total portfolio value × 100%
A few watchpoints from the article:
5% may be a level some people monitor
10% to 15% may count as high concentration for many mixed portfolios
Mutual fund holdings may be older snapshots
ETF holdings may update more often, but weights may still shift with market moves
This article breaks down the math in plain terms so I may see one stock’s actual footprint across taxable accounts, IRAs, 401(k)s, HSAs, ETFs, and mutual funds.
Step 1: Calculate your direct shares first
Before you look at fund holdings, start with the part you can see clearly: the shares you own outright. That gives you a clean baseline for a single stock across all of your investable accounts.
Calculate the value of shares you own outright
The math is simple:
Direct position value = Shares owned × Today's market price
Then divide that number by your total investable portfolio value to get your direct portfolio weight. Use today's market price, not cost basis.
Add up shares from every account first. For example, you may hold some shares in a taxable brokerage account and more in a Roth IRA. Both count. The same goes for IRA, 401(k), and HSA balances if they hold the stock.
For the denominator, use your total investable portfolio value. Leave out non-investment assets and stick to investable accounts only.
A simple baseline example
Say you own 200 shares of a stock trading at $250.00 per share, split across two accounts: 120 shares in a taxable brokerage and 80 shares in a Roth IRA. Your total portfolio across all investable accounts is $1,000,000.00.
| Shares | Price | Position Value | Direct Weight | |
|---|---|---|---|---|
| Taxable Brokerage | 120 | $250.00 | $30,000.00 | 3.0% |
| Roth IRA | 80 | $250.00 | $20,000.00 | 2.0% |
| Total | 200 | $250.00 | $50,000.00 | 5.0% |
That 5.0% figure may serve as the floor of your exposure. T. Rowe Price flags 5% to 10% as worth watching, and above 10% as more urgent.[2][3]
That number is your starting point before you add fund holdings. Direct shares are only the first layer. Next comes fund exposure.
Step 2: Gather fund holdings data for every ETF and mutual fund you own
Direct shares set the floor. Fund holdings add the hidden layer.
For each ETF or mutual fund you own, record the fund name or share class, position value, stock weight, report date, and shares held if the fund lists them. Also note whether the fund tracks an index or uses an active approach. That detail may affect how fast the weight changes. These inputs feed the look-through formula in the next step.
Find the stock's weight inside each fund
Start with the fund sponsor's website. Most providers have a Holdings or Portfolio tab, plus a fact sheet. For large stocks, the top holdings list may show the weight right away.
If the stock doesn't appear in the top holdings, download the full holdings file and search by ticker or company name. Many ETF sponsors post a downloadable holdings file. Mutual funds often publish full holdings in fund reports or SEC filings. Even small weights may add up when the same stock shows up across several funds.
For example, you may find Microsoft in both VOO and an active large-cap fund, with each fund's weight and report date recorded for Step 3.
Know the limits of published holdings data
ETFs usually disclose holdings daily [4][8]. Mutual funds often disclose quarterly [5][6][7]. So it may make sense to treat mutual fund weights as snapshots and note the as-of date before combining everything in Step 3.
Step 3: Calculate look-through exposure and combine all accounts
Now it's time to turn fund holdings into actual stock exposure.
The idea is simple: figure out how much of a stock you own through each fund, then add that amount to any shares you own directly.
Apply the look-through formula to each fund position
Use this formula:
Indirect exposure from Fund A = Value of your position in Fund A × Stock's weight inside Fund A (as a decimal)
So if a stock makes up 6.0% of a fund, convert that to 0.06 before multiplying.
Here’s a plain example. If you hold $80,000 in an S&P 500 ETF and the stock accounts for 6.0% of that ETF, your indirect exposure would be:
$80,000 × 0.06 = $4,800
Then do the same math for each fund position in the portfolio.
Add up the same stock across multiple funds and accounts
A single stock may show up in several places at once. It may sit inside a total market ETF, an S&P 500 ETF, a large-cap growth fund, and an active mutual fund. And those funds may be spread across a taxable brokerage, Roth IRA, traditional IRA, 401(k), or HSA.
Run the formula for each fund position, then add those amounts to any direct shares you hold.
Build an exposure table, then calculate final weight
If you run the look-through math across four fund positions - a taxable S&P 500 ETF, a Roth IRA tech sector ETF, a traditional IRA total market fund, and a 401(k) large-cap growth fund - the result may be $17,325 of indirect exposure. Add $10,000 in direct shares, and total exposure comes to $27,325 in a $180,000 portfolio.
| Holding / Account | Position Value | Stock Weight in Fund | Dollar Exposure to Stock |
|---|---|---|---|
| Direct shares - Taxable | $10,000 | 100.0% | $10,000 |
| S&P 500 ETF - Taxable | $80,000 | 6.0% | $4,800 |
| Tech sector ETF - Roth IRA | $35,000 | 12.0% | $4,200 |
| Total market fund - Traditional IRA | $45,000 | 4.5% | $2,025 |
| Large-cap growth fund - 401(k) | $70,000 | 9.0% | $6,300 |
| Total Portfolio | $180,000 | - | $27,325 |
That total may be the number you compare against your full portfolio.
True portfolio weight = Total stock exposure ÷ Total portfolio value
In this example:
$27,325 ÷ $180,000 = 15.2%
Use that total in Step 4 to check concentration risk, overlap, and blind spots.
Step 4: Use the result to check concentration risk, overlap, and blind spots
Now use the total exposure from Step 3 to figure out whether the stock reflects a deliberate overweight or hidden overlap.
With that number in hand, test three things: concentration, overlap, and intent. A 5% position may work as a watch level, while 10% to 15% may count as high concentration for many diversified portfolios [3][10][1].
What to do when a position is larger than expected
Start by breaking the exposure into its sources. If most of the weight comes from look-through holdings across several funds, rather than from a direct stock purchase you meant to make, that may point to accidental overlap instead of a conviction bet.
Employer stock needs extra care. If you already have economic exposure to your employer through salary, bonus, or retirement benefits, owning the stock directly on top of a 401(k) allocation may make the true weight look smaller than it actually is. That may push the position well past what you meant to hold. In plans that allow employer stock, 46% of participants held more than 20% of their account in company shares, and one-sixth held more than 80% [9].
Once you know where the concentration comes from, a few paths may be available:
Trimming direct shares, if that's the simplest lever
Swapping an overlapping fund for a broader option
Writing the position down as a deliberate overweight in your plan, so it doesn't read like a blind spot later
Run this check before rebalancing, tax-loss harvesting, or adding new money
That same breakdown may shape what you do next. Before rebalancing, check whether a stock that looks underweight in one account may already have heavy representation in a retirement plan or taxable ETF somewhere else. Buying more to "rebalance" may add concentration instead of reducing it.
New contributions may do the same thing, even if you don't buy more shares directly. If your current true weight in a stock is already high, sending new money into a broad market ETF that also holds that stock may push the number up again.
Tax-loss harvesting is another spot where hidden overlap may quietly weaken the trade. If you sell a fund at a loss but still hold the same stock through other funds and a direct position, your portfolio's actual exposure may barely change. The tax result may still matter, but the diversification result may not. Tax treatment depends on your situation; this is educational, not personal tax advice. A tool like Mezzi's X-Ray feature may surface this kind of overlap across all connected accounts before you act, so the issue may be less likely to show up after the fact.
Once the exposure is visible, the final step is deciding whether to trim, hold, or rebalance.
Conclusion: How to see one stock's real footprint across your portfolio
Put the pieces together, and the math may come down to four steps: calculate direct shares, look through each fund, add all exposure, and divide by total portfolio value.
A clear table may make the calculation easier to check. List the account type, holding, position value, fund weight, and exposure, then total the exposure column.
A simple table may show that a stock takes up more of your portfolio across accounts than it seems to in any single account.
Treat look-through as a snapshot. Mutual fund holdings may lag, and ETF weights may shift with price moves and rebalances.
If you want to avoid doing this by hand across accounts, some people use a tool that shows the full look-through. Mezzi's X-Ray view automates this look-through across connected accounts - taxable, Roth IRA, 401(k), and more - so hidden concentration across overlapping funds and multiple custodians may become visible in one place.
FAQs
How often should I update my stock exposure calculation?
You may not need to update your stock exposure calculation by hand. Mezzi automatically refreshes your data as markets move, funds rebalance, and trades occur, with the goal of giving you a current view of your actual holdings, though accuracy depends on the data your institutions provide.
That said, some people still review their portfolio on a set schedule, such as once or twice a year. A formal check may also make sense after major market moves or meaningful changes to holdings.
Should cash be included in my total portfolio value?
Yes. Include cash in your total portfolio value so Mezzi may see a more complete view of your accounts, assets, and liabilities.
That may help keep your asset allocation, risk exposure, and diversification analysis more accurate and more reflective of your full financial position.
What if a mutual fund’s holdings data is outdated?
Because Mezzi relies on third-party APIs from your financial institutions, some holdings data may be outdated or inaccurate.
The Exposure X-Ray tool updates automatically as funds rebalance and markets shift, but its accuracy depends on the data your institutions provide. If updates are delayed, Mezzi may not reflect the latest changes in your mutual fund holdings.
Disclosures:
This content is for informational purposes only and does not constitute investment advice or a recommendation to buy or sell any security.
Past performance is not indicative of future results. No guarantee of future performance or outcomes is implied.
Savings and performance examples are hypothetical and for illustrative purposes only. Actual results will vary based on individual circumstances, portfolio composition, market conditions, and fees.