
With Mezzi, portfolio management becomes more straightforward. It equips you with the tools to understand your holdings, manage risks, and make informed decisions - all without the1% AUM fees or the need to transfer accounts. You stay in control, while Mezzi ensures you have the transparency and insights needed for true diversification.
Here’s what you need to know:
- Overlap risks: Funds with shared holdings concentrate your portfolio, amplifying losses if those stocks underperform.
- Hidden costs: You’re paying fees for the same exposure across funds.
- Missed opportunities: Overlap limits your ability to invest in underrepresented areas.
To identify and fix this, compare your funds’ holdings and calculate the overlap percentage. Tools like Mezzi’s X-Ray can automate this process, helping you spot redundancies, rebalance your portfolio, and identify potential tax-saving opportunities.
How portfolio overlap can increase your portfolio's risk and what you can do about it
If you prefer a hands-on approach, you can use a portfolio overlap checker to see exactly where your holdings intersect.
The Risks of Overlapping Holdings in Your Portfolio
Overlapping holdings in your portfolio may result in duplicated fees, increased risk, and missed chances for growth.
Less Diversification and Higher Concentration Risk
When multiple funds in your portfolio hold the same stocks, your investments become less diversified across stocks and bonds and more concentrated. For example, large-cap funds may have overlap rates as high as 47% or more, with some reaching 60% overlap. This means owning two large-cap funds may result in a significant portion of your investment being tied up in identical stocks. To make matters worse, the top 100 stocks often make up about 60% of equity assets under management. If these heavily concentrated stocks underperform, the damage ripples through every fund that holds them.
Take the case of HDFC Top 100 Fund and ICICI Prudential Bluechip Fund, which share a 57% overlap. If both funds allocate 5% to the same stock, such as Tata, a drop in that stock's value may lead to amplified losses. This risk became evident during the 2022 market downturn, when portfolios with significant overlap in large-cap funds experienced greater losses than more diversified portfolios during this period.
Hidden Costs: Paying Twice for the Same Exposure
Overlapping funds may increase risk and add unnecessary costs. By holding funds with significant overlap, you may pay duplicate fees for the same exposure, which can reduce your returns. Instead of gaining any additional diversification, you end up with redundant costs that could have been avoided. These hidden expenses reduce the capital available for potentially more rewarding investments.
Missed Opportunities for Better Allocation
Another downside of overlapping holdings is the missed chance to allocate your money more effectively. For instance, if you discover a 57% overlap between two bluechip funds, you could sell one and free up funds to invest in underrepresented areas. Let’s say you sell one redundant holding and unlock $10,000 - this money could be redirected to mid-cap stocks, international markets, or other sectors that genuinely diversify your portfolio. Such reallocations may help spread out your risk and may improve your portfolio’s risk-adjusted returns over time.
How to Identify and Calculate Mutual Fund Overlap
How to Calculate Mutual Fund Overlap in 2 Steps
Spotting overlap in your mutual funds involves a straightforward, two-step process. It requires comparing the holdings of each fund in your portfolio and figuring out how much duplication exists.
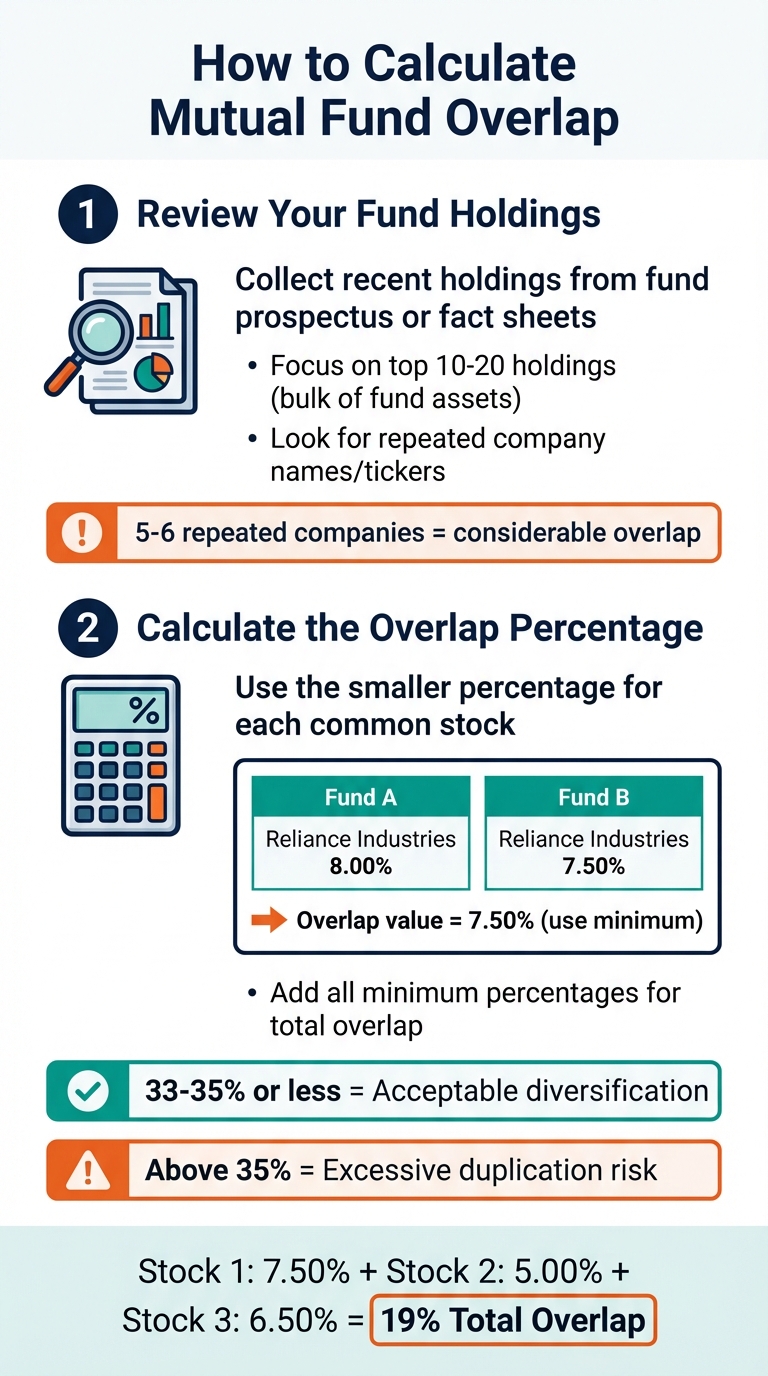
Step 1: Review Your Fund Holdings
Start by collecting the most recent holdings for each mutual fund in your portfolio. This information is usually available in the fund's prospectus, fact sheet, or on the fund provider's website. Pay close attention to the top 10 to 20 holdings, as these stocks often represent the bulk of the fund's assets and have the most influence on performance. Look for repeated names or tickers across your funds. If you notice 5–6 of the same companies appearing repeatedly, it’s a sign of considerable overlap.
Step 2: Calculate the Overlap Percentage
After identifying shared holdings, calculate the overlap percentage by using the smaller percentage holding for each common stock. For instance, if Fund A allocates 8.00% to Reliance Industries and Fund B allocates 7.50%, use 7.50% as the overlap value for that stock. Add these minimum percentages for all overlapping stocks to find the total overlap percentage. Some sources consider an overlap of 33% to 35% or less as reasonable for diversification. Higher overlap may increase exposure to the same market risks and additional management fees. With this data, you can pinpoint funds contributing to excessive duplication and consider adjustments using Mezzi's portfolio tools.
Example: Large-Cap vs. Flexi-Cap Fund Overlap
Take a scenario comparing a large-cap fund and a flexi-cap fund. While flexi-cap funds can invest across all market sizes, they often lean toward the same blue-chip stocks found in large-cap funds. Here’s an example analysis:
| Company | Large-Cap Fund Holding (%) | Flexi-Cap Fund Holding (%) | Overlap (Min Value, %) |
|---|---|---|---|
| Reliance Industries | 8.00 | 7.50 | 7.50 |
| Tata Consultancy Services | 6.00 | 5.00 | 5.00 |
| HDFC Bank | 7.00 | 6.50 | 6.50 |
| Infosys | 5.50 | 4.00 | 4.00 |
| ICICI Bank | 4.00 | 5.50 | 4.00 |
| Hindustan Unilever | 3.00 | 2.50 | 2.50 |
| Bharti Airtel | 2.50 | 3.00 | 2.50 |
| Kotak Mahindra Bank | 2.00 | 2.50 | 2.00 |
| ITC | 1.50 | 1.00 | 1.00 |
| State Bank of India | 2.00 | 1.50 | 1.50 |
| Total Overlap | 36.50% |
In this instance, the total overlap is 36.50%, exceeding the range considered reasonable by some sources. This suggests you’re likely duplicating exposure to the same stocks and paying unnecessary fees for similar holdings. It’s a potential indicator to review your portfolio and consider adjustments for diversification. Keep in mind that fund managers often adjust their holdings, so it’s a good idea to revisit this analysis regularly. Mezzi’s tools can simplify the rebalancing process and help you monitor portfolio diversification.
Using Mezzi's X-Ray Tool to Find and Fix Overlap

Manually comparing fund holdings across multiple accounts can feel like a never-ending task, especially when you're juggling different account types. Mezzi’s X-Ray tool takes the hassle out of the process by scanning all your connected accounts and pinpointing exactly where your mutual funds overlap. This streamlined approach gives you an instant, detailed look at potential redundancies and over-concentration risks in your portfolio.
How Mezzi's X-Ray Tool Works
Mezzi connects to your accounts using secure, read-only access through trusted platforms like Plaid and Finicity. Once connected, it pulls holdings data from every account you’ve linked. The tool then cross-references your portfolios in seconds, identifying shared stocks and calculating overlap percentages based on each fund’s weightings. This gives you a complete picture of your investments, helping you reduce duplication and pursue diversification. Unlike traditional advisors, who can only see assets they manage, Mezzi analyzes your entire portfolio - including 401(k)s, IRAs, and taxable accounts - providing a comprehensive overlap analysis.
See Your Overlap in Real Time
With Mezzi’s dashboard, you can instantly view overlap details. It shows the overlap percentage between fund pairs, lists shared holdings with their specific weightings, and highlights a diversification impact score to flag areas of concern, like sector overexposure. For instance, if you hold both HDFC Top 100 Fund and Axis Bluechip Fund, the dashboard might reveal a 57.00% overlap with shared investments in major holdings. The tool updates automatically as your holdings change, saving you from tedious manual checks. All findings are presented in an easy-to-read format, so you can quickly review and consider the insights.
Example: Overlap Analysis with Mezzi
Here’s an example of what an overlap analysis might look like on Mezzi’s dashboard:
| Fund Pair | Overlap Percentage | Top Common Holdings (Weightage) | Diversification Impact |
|---|---|---|---|
| HDFC Top 100 vs. Axis Bluechip | 57.00% | Reliance Industries (8.00%), HDFC Bank (6.00%) | High concentration risk |
| UTI Large & Mid Cap vs. ICICI Prudential Bluechip | 45.00% | ICICI Bank (5.00%), Infosys (4.00%) | Reduced sector spread |
| Flexi-Cap A vs. Large-Cap B | 25.00% | Tata (5.00%) | Moderate, room for optimization |
In this example, the first pair’s 57.00% overlap indicates a high concentration risk, which may warrant reducing duplicate exposure. Meanwhile, the third pair’s 25.00% overlap indicates a healthier level of diversification, with only minor adjustments needed to fine-tune the portfolio.
How to Reduce Mutual Fund Overlap with Mezzi
Once you've spotted overlap in your portfolio, Mezzi equips you with three practical strategies to tackle it. These steps focus on rebalancing your investments, leveraging tax opportunities, and keeping tabs on portfolio risks.
Rebalance to Broaden Your Portfolio
Mezzi analyzes your portfolio and may suggest reallocating funds from those with high overlap to options that complement your existing investments. For instance, if your portfolio includes multiple large-cap funds with a 47% average overlap, Mezzi might recommend shifting some of that investment into mid-cap or sector-specific funds to diversify your exposure. Say two funds both hold a 5% stake in the same stock - Mezzi may identify opportunities to reduce one position and find a low-overlap alternative.
The tool may identify specific fund swaps based on your portfolio. For example, if HDFC Top 100 and ICICI Prudential Bluechip funds show a 57% overlap, Mezzi may suggest reviewing the fund with higher fees and considering a low-overlap alternative. Similarly, if Axis Bluechip and a flexi-cap fund have over 50% overlap, you could sell 20% of the overlapping large-cap fund and redirect that capital into a mid-cap fund. This adjustment may result in lower overlap and may maintain your growth prospects.
Turn Overlap Into Tax Benefits
Mezzi doesn’t just help with diversification; it also identifies ways to turn overlap into tax savings. By scanning for underperforming stocks across your funds, Mezzi identifies potential opportunities for tax-loss harvesting. For example, if two funds each hold a 5% position in a stock that's currently underperforming, Mezzi may identify the higher-fee fund for potential sale. This allows you to realize losses for tax purposes, potentially offsetting gains at a 15–20% effective rate in the U.S. After the wash-sale rule period, you can reinvest in a non-overlapping fund to maintain diversification.
Here’s a real-world example: Upload your portfolio into Mezzi’s X-Ray feature, and you might uncover a 57% overlap between two bluechip funds holding a stock that’s down 10%. Mezzi could identify a $2,000 loss opportunity, which may offset capital gains and result in tax savings at your applicable rate. You can then reinvest those funds into a low-overlap option, keeping your portfolio balanced and tax-efficient.
Stay on Top of Your Portfolio
Portfolios don’t stay static - fund holdings shift over time, and what looks diversified today could become overly concentrated in a few months. Mezzi provides real-time alerts, weekly reports, and risk scores to help you monitor these changes. This ensures you’re notified when fund managers tweak their strategies, potentially increasing overlap.
Mezzi monitors monthly fact sheets and market trends, alerting you if overlap surpasses a preset threshold (like 30%). For U.S. investors, it syncs with brokerage accounts to provide alerts in USD, helping you avoid excessive exposure to concentrated positions. The dashboard breaks down changes, showing overlap percentages, volatility, and fee comparisons. By staying proactive with Mezzi, you can consistently refine and protect your portfolio.
Mezzi offers insights and suggestions through read-only access, leaving all trade and rebalancing decisions to the user. It does not execute trades or move funds. For tax-loss harvesting or other tax-related decisions, consult a tax professional for personalized advice. This article is for informational purposes only and not a substitute for professional tax guidance.
Conclusion: Take Control of Your Portfolio with Mezzi
Key Takeaways
Mutual fund overlap can quietly weaken your portfolio's diversification by unintentionally concentrating your investments in the same stocks or sectors. When multiple funds hold overlapping positions, you’re not only duplicating your exposure but also paying extra fees without improving your allocation. This is where Mezzi's X-Ray tool steps in, offering real-time insights to help you spot and address these overlaps.
Addressing overlap may improve diversification by spreading your investments across different, uncorrelated securities. This approach may reduce the risk tied to underperforming stocks or sectors. For instance, swapping overlapping large-cap funds for flexi-cap or mid-cap options can help balance your portfolio and cut down on concentration. Mezzi also identifies duplicate holdings, opening the door to tax-efficient strategies like rebalancing. These strategies may allow for tax-loss harvesting and more effective capital gains tax management.
With these insights, you can make timely and informed adjustments to your portfolio.
Get Started with Mezzi Today
Take control of your portfolio now with Mezzi’s tools and insights. By linking your tax planning and investment accounts - whether it’s your 401(k), brokerage, Roth IRA, or taxable accounts - through secure, read-only access, you’ll get a complete picture of your investments. Use Mezzi's X-Ray tool to generate an instant overlap report, uncover areas where you’re doubling up on the same stocks, and receive informational suggestions to support diversification and risk management.
Mezzi’s real-time dashboard keeps you informed, tracking changes in overlap percentages and sector exposures. If your overlap exceeds 30% due to shifts in fund strategies, you’ll receive alerts, helping you stay ahead of potential risks. Starting at $299 per year, Mezzi offers unlimited AI chat, 24/7 monitoring, and proactive insights - helping you monitor fees while staying in control of your financial decisions.
Mezzi provides insights and recommendations with read-only access. It does not execute trades or move funds. For tax-loss harvesting or other tax-related decisions, consult a tax professional for personalized advice. This article is for informational purposes only and is not a substitute for professional guidance.
FAQs
How often should I check my funds for overlap?
It's a good idea to review your investment funds for overlap every 6 to 12 months. These regular check-ins help ensure your portfolio stays diversified and avoids overexposure to certain assets, keeping it aligned with your financial objectives.
What’s a good overlap percentage for my portfolio?
A good overlap percentage in a portfolio is generally below 70%, with lower percentages being ideal. Keeping overlap low helps maintain diversification and reduces the risk of overexposure. When overlap exceeds 70%, it can lead to concentration risk, which undermines the benefits of diversification and may make your portfolio more vulnerable to market fluctuations.
Should I sell a fund if two funds overlap a lot?
If two funds hold many of the same assets, it might be worth considering whether to sell one. When funds overlap, your portfolio becomes less diverse, increasing the risk of over-concentration and potentially magnifying losses during market downturns. Tools like Mezzi’s AI-powered analysis can help pinpoint these overlaps, making it easier to identify redundancies. By selling one of the overlapping funds, you may support diversification, manage risk, and pursue tax efficiency - all while adjusting your portfolio to your objectives.
Related Blog Posts
- Are overlapping fund holdings costing me in taxes or performance?
- How to Check If Your ETFs Overlap (And Why 73% of Portfolios Have This Problem)
- Portfolio Overlap Checker: How to Find Hidden Duplication Across All Your Accounts
- Portfolio Overlap Checker: How to Find Hidden Duplication Across All Your Accounts
Table of Contents
Book Free Consultation
Walk through Mezzi with our team, review your current situation, and ask any questions you may have.