
A portfolio may look diversified and still lean hard on the same few stocks. If you hold overlapping funds across a 401(k), IRA, HSA, and taxable account, names like Apple, Microsoft, and NVIDIA may show up again and again.
Here’s the short version:
Overlap may add hidden concentration even when you own many funds
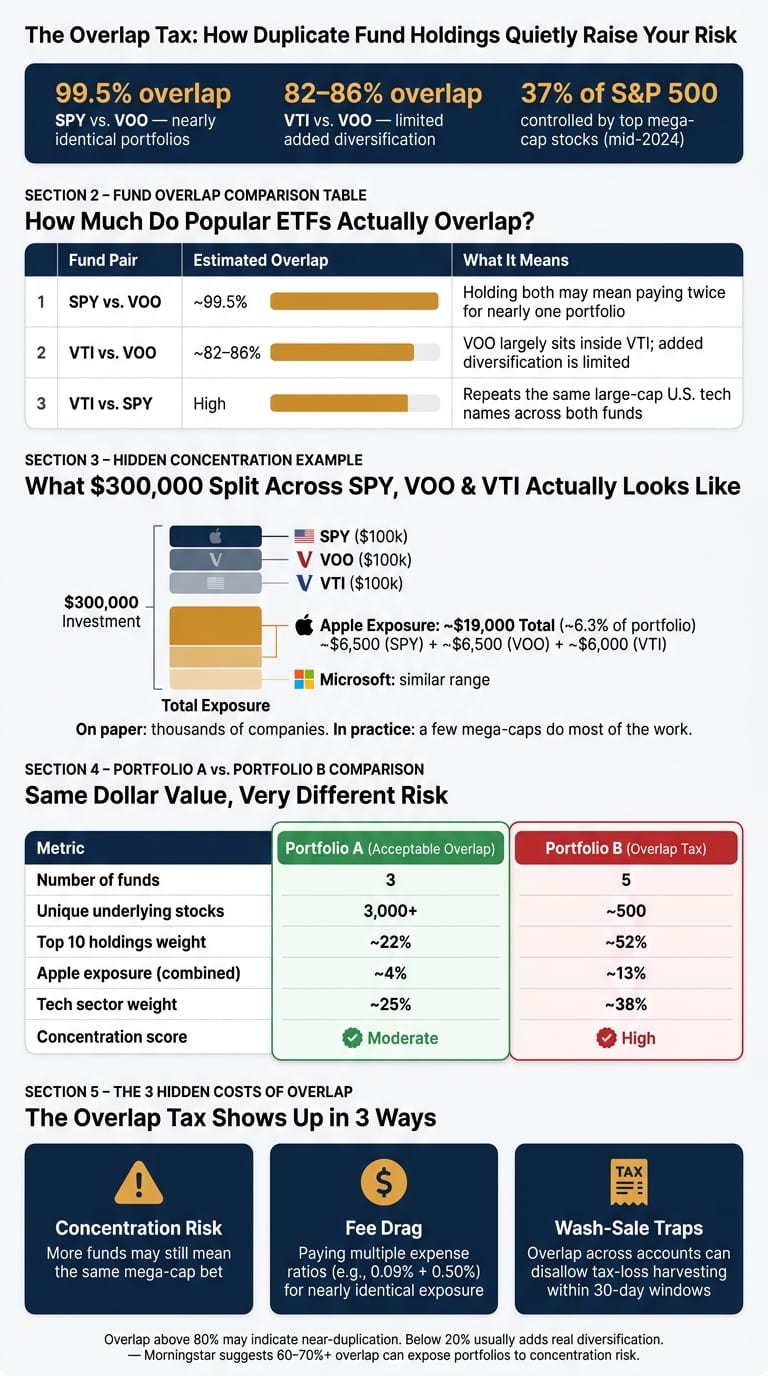
VTI and VOO may still overlap heavily at about 82%–86% by weight
Top S&P 500 stocks made up about 37% of the index by mid-2024
Fees may stack when several funds hold much of the same portfolio
Taxes may get messier if overlap across accounts affects tax-loss harvesting and wash-sale rules
In other words: more tickers may not mean more diversification.
A simple way to think about it:
| Issue | What may happen |
|---|---|
| Risk | Your money may be more tied to the same mega-cap stocks and sectors |
| Fees | You may pay more for exposure that looks very similar |
| Taxes | Wash-sale conflicts may be easier to trigger across accounts |
If I wanted to check this, I’d start with one view of every account, look through each fund’s holdings, and see where the same stocks keep repeating. From there, some investors may compare overlap, costs, and tax trade-offs before making changes.
How duplicate holdings quietly raise your risk and costs
Why owning more funds does not mean more diversification
More tickers don't automatically mean more diversification. When funds track the same index, or hold the same market-cap-weighted stocks, they may give you a bigger fund count without giving you much new exposure.
A clear example: SPY and VOO overlap by about 99.5%.[17][4][1] If someone splits $100,000 between them, that move may not spread risk much. It may mostly repeat the same exposure and the same fund-level costs. Add VTI, and the overlap with VOO alone may run about 82%–86% by weight.[16][18][19] SPY and VOO are almost the same portfolio, and VTI still overlaps a lot because the same mega-cap names sit at the top of all three. That kind of duplication may be easy to miss when the funds sit in different accounts.
So even if it looks like you own three funds, you may not have three meaningfully different portfolios. You may just have the same large-cap U.S. tech exposure repeated.
In a hypothetical $300,000 portfolio split evenly across SPY, VOO, and VTI, Apple exposure may stack up fast: about $6,500 from SPY, $6,500 from VOO, and $6,000 from VTI. That adds up to about $19,000, or 6.3% of the full portfolio, in one stock.[2][3][8][9][10] Microsoft may land in a similar range. On paper, the portfolio may hold thousands of companies. In practice, a small group of mega-caps may still do most of the work.
How overlap distorts concentration, fees, and tax decisions
Overlap doesn't just create the appearance of diversification. It may also skew concentration, costs, and tax choices.
On concentration, broad U.S. index funds are market-cap weighted, so the biggest companies tend to dominate. VTI, for example, allocates about 30%–33% to information technology.[5][7][8] If someone layers SPY and VOO on top, that may not add many new sectors. It may put more money into the same tech-heavy part of the market. If Nvidia, Apple, or Microsoft drops sharply, each overlapping fund may move down at the same time.
On costs, overlap may mean paying more than one expense ratio for nearly the same exposure. SPY has an expense ratio of about 0.09%, while VOO is about 0.03%. If a large-cap mutual fund that tracks a very similar index is added at 0.50% or more, the investor may end up paying higher fees for much the same exposure.[1][2][4][6] Over long periods, that drag may add up in dollar terms.
Overlap may also create tax issues when the same fund appears across more than one account. Under the IRS wash-sale rule, a loss may be disallowed if a substantially identical fund is bought in another account the investor controls within 30 days.[11][12][13][14][15] The more overlap someone has across accounts, the harder it may be to set up clean tax-loss harvesting pairs, or even spot when a problem may have been created.
Morningstar suggests that once overlap becomes extreme - around 60%–70% or higher - it can expose a portfolio to concentration risk across both companies and sectors.[20]
| Fund Pair | Estimated Overlap | What It Means |
|---|---|---|
| SPY vs. VOO | ~99.5% | Almost the same exposure; holding both may mean paying twice for what is close to one portfolio |
| VTI vs. VOO | ~82%–86% | VOO may sit largely inside VTI; the added diversification may be limited |
| VTI vs. SPY | High; same mega-cap top holdings | May repeat the same large-cap U.S. tech names across both funds |
The next step is to measure overlap across all accounts, not one fund at a time.
How to find and measure overlap across your full portfolio
Start with a consolidated holdings view and X-Ray
Now that you know overlap may hide across accounts, the next step may be to measure it in one consolidated view.
Looking at accounts one by one may hide duplication. A 401(k), IRA, and taxable account may each appear diversified on their own while still repeating many of the same stocks when viewed together.
A consolidated holdings view pulls every position from every account into one place: your 401(k), traditional IRA, Roth IRA, HSA, and taxable brokerage. Instead of separate pie charts for each account, you get one combined dashboard that shows your total exposure to each stock, fund, and sector across everything you own.
Mezzi connects accounts in read-only mode. From there, Mezzi's X-Ray feature breaks each fund into its underlying holdings. If your 401(k) target-date fund, your IRA's VTI position, and your brokerage's SPY all own Apple, X-Ray adds those exposures together and shows the combined weight. That figure may be much larger than any single account suggests.
With holdings combined, you may see where duplication sits and how much it may matter.
Measure overlap by stock, sector, and concentration score
Overlap may be measured at three levels: stocks, sectors, and total concentration.
At the stock level, X-Ray ranks your top holdings by total weight across all accounts. For illustration, an investor might find that Apple appears in four separate funds and ends up representing about 10%–15% of total equity exposure, even though no single fund shows more than 7%.
At the sector level, you may compare your combined technology or energy weight against a broad benchmark. If the benchmark allocates 25% to technology and your portfolio lands at 38% because of overlapping large-cap funds, that gap may reflect overlap rather than a deliberate strategy.
For one number that summarizes overall concentration, Mezzi's concentration score uses HHI. Higher scores mean more concentration. Mezzi then translates that into a plain-language score - Low, Moderate, or High - so you don't have to interpret the math yourself.
The table below shows how these metrics may look across two hypothetical portfolios with the same dollar value but very different underlying structures:
| Metric | Portfolio A (Acceptable Overlap) | Portfolio B (Overlap Tax) |
|---|---|---|
| Number of funds | 3 | 5 |
| Unique underlying stocks | 3,000+ | ~500 |
| Top 10 holdings weight | ~22% | ~52% |
| Apple exposure (combined) | ~4% | ~13% |
| Technology sector weight | ~25% | ~38% |
| Concentration score | Moderate | High |
Overlap above 80% may indicate near-duplication. Below 20% usually adds real diversification.
Once overlap is mapped, the next step may be to cut duplicate exposure without creating tax problems.
The ETF Overlap Nobody's Talking About
How to reduce the overlap tax without creating new tax problems
Finding overlap is just the start. The next part is trimming it in a way that may avoid extra tax friction. After you've mapped overlap across accounts, it may make sense to cut it in a clear order.
Choose one primary fund for each core exposure
A simple way to cut overlap may be to keep one fund for each core exposure: one broad U.S. stock fund, one international fund, and one core bond fund.
Take a common mix: an investor owns VTI, SPY, and a large-cap mutual fund at the same time. That setup may add repetition more than diversification. And the cost gap may be bigger than it looks. For example, VOO has an expense ratio of 0.03%, while an actively managed large-cap fund may charge 0.75% for similar exposure. On a hypothetical $100,000 portfolio, that gap comes to about $720 per year.
Mezzi can compare overlap, cost, and concentration side by side, which may make it easier to keep one main fund for each core exposure.
Once you've chosen your core funds, the next step may be to stop new money from rebuilding the same overlap.
Redirect new contributions before selling legacy holdings
Before selling positions in taxable accounts, some investors first stop new contributions from flowing into duplicate funds and redirect that money to their primary funds. That may include paycheck deferrals in a 401(k) or automatic purchases in a brokerage account.
This approach may reduce overlap bit by bit across connected accounts, without realizing embedded capital gains all at once. In 401(k)s and IRAs, the tax treatment may be simpler, since overlap may often be consolidated without current capital gains taxes. Taxable accounts may call for more planning.
Mezzi can show where most of the overlap sits by account type, so you may see where the heavier cleanup may happen.
Then the focus may shift to taxable sales where the tax cost looks more manageable.
Clean up overlap with tax-aware guidance
When overlap sits in a taxable account, timing may matter. It may turn into a tax issue when sales in one account line up with purchases in another.
The IRS wash-sale rule covers 30 days before and after the sale.[22] If you sell an S&P 500 ETF at a loss and buy a substantially identical fund inside an IRA during that window, the loss is disallowed.[21][23]
Mezzi scans connected accounts for wash-sale conflicts before you trade, so you may swap into a similar fund that is not substantially identical. For example, some investors move from an S&P 500 fund to a total U.S. market fund in cases like this, which may preserve the tax benefit.
The hypothetical table below illustrates what this kind of cleanup may look like, with a before-and-after view of concentration, fees, and tax friction:
| Metric | Before Cleanup | After Cleanup |
|---|---|---|
| Number of funds | 25 | 8 |
| Top 10 holdings weight | ~45% | ~30% |
| Average fund expense ratio | 0.45% | 0.10% |
| Equity overlap (top 50 stocks) | ~80% | ~55% |
| Realized capital losses available to offset gains | N/A | ~$5,000 |
Mezzi can generate a before-and-after summary of your accounts, showing how concentration, fees, and tax handling may change. That may give you a clearer view of how scattered accounts fit together, while leaving every trade decision in your hands.
Conclusion: Turn scattered accounts into one intentional portfolio
The overlap tax isn't a line item on a statement. It may build quietly through duplicate fund holdings across a 401(k), IRA, and taxable brokerage, until your portfolio may become a more concentrated bet on a handful of mega-cap names.
Once overlap is visible, the goal may be to simplify without creating tax drag. A common approach is pretty simple: consolidate every account, measure overlap by stock and sector, choose one primary fund for each core exposure, and reduce duplication in tax order.
That takes a single view of every account. Mezzi's read-only, AI-driven X-Ray look-through connects all your accounts at once, showing true concentration and redundant holdings. It updates as markets move, so overlap may not rebuild unnoticed. The result may be a cleaner, easier-to-manage portfolio.
Mezzi does not trade for you. It gives you the visibility to manage overlap in a deliberate way, with clear portfolio visibility, so you may act with more confidence rather than guesswork.
FAQs
How much overlap is too much?
It may depend on your risk tolerance and goals, but the usual benchmarks are fairly clear. More than 70% overlap is often viewed as high and may reduce diversification while also duplicating fees. 40% to 70% is more moderate and may be worth watching over time.
Some professionals suggest keeping total portfolio overlap below 50%, while others prefer 10% to 20% so each fund may play a more distinct role.
Can overlap hurt me if my funds are low-cost?
Yes. Low expense ratios don't always solve the overlap problem.
You may still pay multiple management fees for what may amount to many of the same stocks. And while the funds may look different on the surface, your portfolio may end up less diversified than it appears and more exposed to concentrated losses if those shared holdings run into trouble.
Overlap may also create tax friction. If someone tries to cut duplication, that process may involve selling funds and triggering capital gains in a taxable account. It may also make wash sale planning more complicated, especially when similar funds sit across the same account.
How do I reduce overlap without triggering taxes?
First, look for duplicate holdings across all accounts with Mezzi’s consolidated overlap view. That may show where the same stocks or funds appear in more than one place.
Then, some investors rebalance mainly inside tax-advantaged accounts like 401(k)s, IRAs, and Roth accounts. The goal may be to avoid triggering capital gains in taxable brokerage accounts.
If changes in taxable accounts still make sense, tax-aware steps like tax-loss harvesting may be part of the process. It may also make sense to avoid wash sales during the 30-day window. Mezzi’s AI may help identify potential lower-tax replacement funds to evaluate against your target allocation.
Disclosures:
This content is for informational purposes only and does not constitute investment advice or a recommendation to buy or sell any security.
Past performance is not indicative of future results. No guarantee of future performance or outcomes is implied.
Savings and performance examples are hypothetical and for illustrative purposes only. Actual results will vary based on individual circumstances, portfolio composition, market conditions, and fees.
Registration does not imply a certain level of skill or that the SEC has approved the company or its services.