
A retirement plan may look solid until one input moves. In this article, I’d sum it up like this: small changes in returns, inflation, spending, retirement timing, Social Security, or taxes may shift the whole answer.
Here’s the short version:
A plan showing $65,000 to $80,000 a year in retirement spending may depend heavily on a few assumptions.
A one-variable-at-a-time sensitivity test may show which input changes the outcome the most.
The main outputs to compare may include:
retirement age
annual income
how long the portfolio may last
the chance of running short
extra monthly savings needed
In the article’s sample base case, a 45-year-old U.S. couple with $600,000, saving $20,000 a year, retiring at 65, and expecting 5% returns and 2.5% inflation may have about a 90% chance of making the plan last to age 95.
But small shifts may change that fast:
lower returns may put more pressure on withdrawals
higher inflation may push future spending up
retiring later may give the portfolio more time and fewer drawdown years
claiming Social Security at 62 vs. 70 may change the monthly benefit a lot
taxes and withdrawal order may change how much gross income is needed to net the same spending
What stood out to me most: this isn’t about finding one perfect forecast. It’s about seeing which assumption your plan may lean on the hardest.
Quick Comparison
| Assumption | If it changes | What may move |
|---|---|---|
| Returns | 1 to 2 points lower | income, success rate, portfolio life |
| Inflation | 0.5 to 1.0 point higher | future spending need, shortfall risk |
| Spending | +$5,000 to +$20,000/year | withdrawal pressure, longevity |
| Retirement age | 1 to 3 years later | savings time, withdrawal years, Social Security timing |
| Social Security | claim earlier or later | guaranteed monthly income |
| Taxes | higher or lower after-tax drag | gross withdrawals needed |
If I were boiling the article down to one line, it would be this: the plan that looks best on paper may not be the one that holds up after a few inputs change.
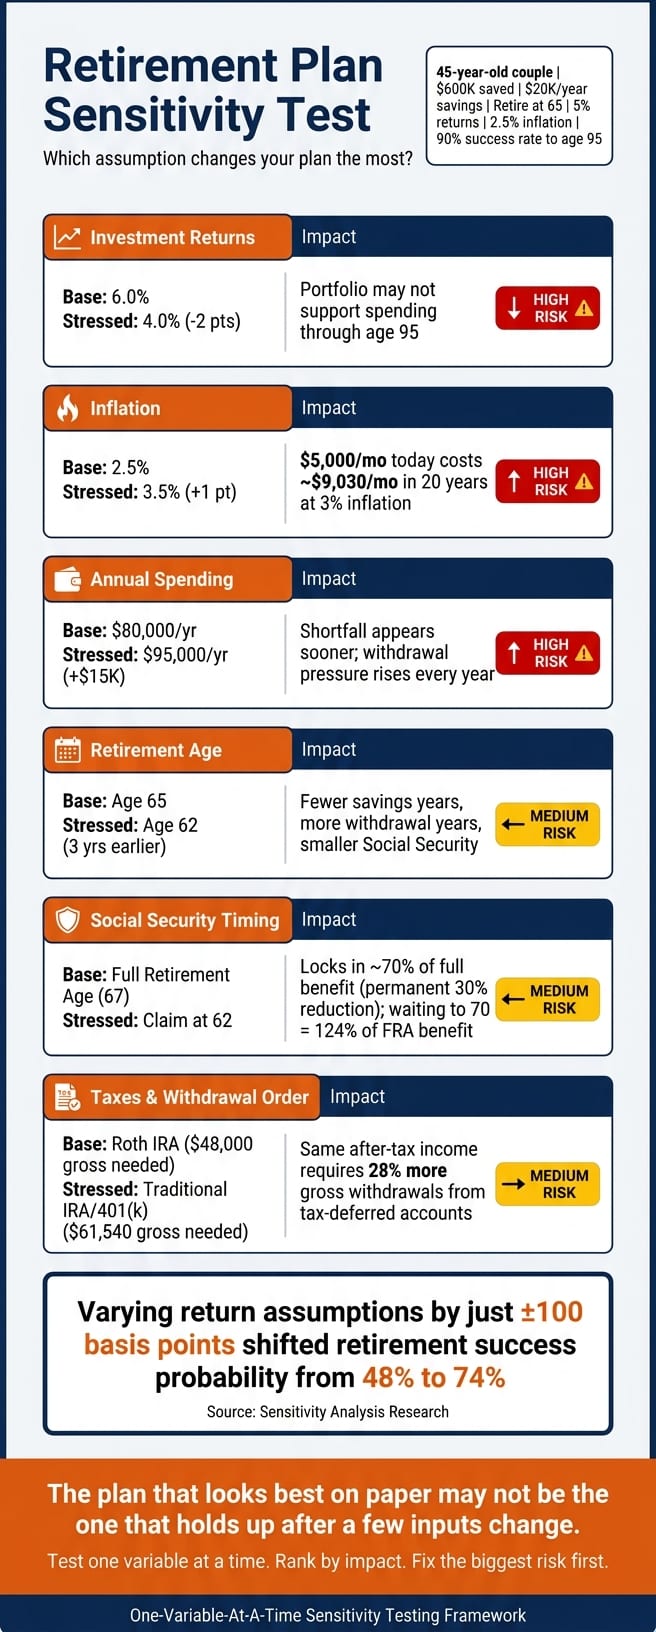
How to Stress Test Your Retirement Plan
The assumptions most likely to change your retirement outcome
A retirement plan may look steady on the surface, but a few inputs usually do most of the heavy lifting: returns, inflation, spending, retirement age, Social Security timing, and taxes. A sensitivity test may show which one changes the result the most. From there, the cleanest way to test the plan may be to change one input at a time and measure what happens.
Returns, inflation, and sequence risk
The gap between a 7.0% and 5.5% nominal return may not seem huge in a single year. Over 25 to 35 years of retirement withdrawals, though, that gap may become much more serious. Lower returns may leave less growth in the portfolio while withdrawals keep going, which may narrow the margin for error.
Inflation works the same way. It tends to creep rather than shout. A monthly budget of $5,000 today may cost about $9,030 in 20 years at 3.0% inflation.[1] Stretch that over 30 years, and even a small shift in inflation may push required income much higher.
The order of returns may matter just as much as the average return. Two portfolios may post the same 7.0% average nominal return over 30 years and still end up in very different places, depending on when losses show up. In one example, a $1,000,000 portfolio with a $40,000 initial withdrawal adjusted for 2.5% inflation ran out around year 19 when poor returns came early, but lasted 30+ years when strong returns came early.[7]
Morningstar research found that nearly 70% of retirement portfolio failures involved cases where the portfolio had lost value by the end of year five, despite long-run averages that could look reasonable.[6]
That’s sequence risk in plain English: the same long-run average may lead to very different results if the bad years hit first.
Spending, savings rate, and retirement date
Spending may be the most controllable retirement lever, and for many households, it may also be the most sensitive one. Moving annual retirement spending from $120,000 to $135,000 may not sound extreme, but that extra $15,000 repeats every year, may rise with inflation, and may pull from the portfolio across the full retirement period.
Before retirement, the savings rate may matter for the same basic reason. A few hundred dollars more per month may build into a much larger ending balance over 10, 15, or 20 years. It may also leave more room in the plan if markets post lower returns than expected.
Retiring two to three years later may change more than many people expect. It may give the portfolio more time to grow, add more contributions, and shorten the period when withdrawals are needed. For some households, that mix may do more for the plan than a small change in investment assumptions.
Social Security timing, taxes, and account mix
Social Security timing may change the size of the guaranteed income base, which may change how much the portfolio needs to cover. For workers with a full retirement age (FRA) of 67, claiming at 62 locks in about 70% of the full benefit - a permanent 30% reduction. Waiting until 70 raises the benefit to roughly 124% of the FRA amount.[2][3][4][5] That spread may be large enough to shift how hard the portfolio needs to work, especially in the early retirement years when sequence risk may matter most.
Taxes may also change the picture, even when the headline portfolio return stays the same. To net $48,000 per year after tax, a retiree drawing entirely from a traditional IRA or 401(k) at a 22% effective rate may need to withdraw about $61,540 gross. The same after-tax income from a Roth IRA requires only $48,000, with no gross-up.
| Account Type | Effective Tax Rate | Gross Withdrawal Needed for $48,000 Net |
|---|---|---|
| Roth IRA | 0% | $48,000 |
| Mixed Strategy | 15% | $56,470 |
| Traditional IRA/401(k) | 22% | $61,540 |
| Less Efficient Withdrawal Order | 25% | $64,000 |
Tax-deferred, Roth, and taxable accounts may lead to different after-tax results even when pre-tax performance is identical. Two investors with the same pre-tax return may end up with different after-tax outcomes based on account type and withdrawal order. That’s why taxes may belong in the same stress test as returns and spending.
How to run a one-variable-at-a-time sensitivity test
Start with a base case. Change one assumption. Recalculate. Then reset the model and test the next input.
That step-by-step setup may sound simple, but that's the whole point. If you change several inputs at once, it gets hard to tell which one actually moved the result.
Use realistic ranges, not extreme guesses
Use ranges that may happen in normal planning, not dramatic worst-case scenarios.
A few examples:
Returns that are 1 to 2 percentage points lower
Inflation that is 0.5 to 1.0 percentage points higher
Retirement delayed by 1 to 3 years
Savings increased by $500 to $2,000 per month
Spending reduced by $5,000 to $20,000 per year
These kinds of tests may give you a cleaner read on where a plan may be more exposed.
Compare the base case against each stressed case
Once you have your ranges, run each stressed case side by side with the base case. Here’s what that comparison might look like for a plan starting with $1,200,000, $80,000 in annual spending, and a 6% return:
| Assumption Tested | Base-Case Value | Stressed Value | Change in Outcome |
|---|---|---|---|
| Investment return | 6.0% | 4.0% | Portfolio may no longer support the same spending through age 95 |
| Inflation | 2.5% | 3.5% | Required income rises more quickly over time |
| Retirement age | 65 | 67 | Portfolio has more time to grow and fewer withdrawal years |
| Annual spending | $80,000 | $95,000 | Retirement shortfall appears sooner |
| Social Security claim | Full retirement age | Age 62 | Lower monthly benefit means the portfolio must cover more of the gap |
| Savings rate | Base savings rate | +$1,000/month | Larger ending balance at retirement |
Keep all other inputs fixed while testing each row. That isolation makes the comparison more useful. It also gives you a clearer way to see which assumptions may matter most.
Rank changes by impact, not by opinion
After each test, sort the results by the size of the swing they caused.
That swing might show up as:
How many years the money lasted
Whether the plan still funded expected spending
How much the required savings rate changed
The assumption that creates the biggest swing may deserve the most attention.
A sensitivity analysis found that varying return assumptions by just ±100 basis points shifted the probability of fully funding retirement from 48% to 74%, and the chance of ending with the original nest egg from 11% to 47%.[8]
That kind of move from one modest assumption change is exactly what a sensitivity test is built to surface. Once the rankings are clear, focus on the assumption that moves the result most.
What to do when one assumption drives most of the risk
Once you've ranked your sensitivities, the next step may be action. You don't need to fix everything at once. You may need to deal with the right issue first.
If returns matter most, lower the return the plan needs
If a modest drop in returns may be enough to throw off the plan, that may suggest the plan depends too much on markets going your way. One response some households consider is lowering the return the plan needs in the first place. That may come from lower spending, higher savings, or both.
If returns don't appear to be the main driver, it may make sense to look first at the levers you control more directly: spending, savings, and timing.
If spending or retirement timing matters most, adjust the levers you control
For many households, the variables with the biggest effect may not be market-related at all. They may be the retirement date and the spending level. Those are also among the few things you may actually change.
Retiring later may give the plan more time to grow, fewer years to fund, and in many cases a larger Social Security benefit. On the spending side, lowering annual retirement expenses by $5,000 or $10,000 may improve the plan in a meaningful way without changing the investment strategy. If your sensitivity test shows that spending or timing is driving most of the risk, that may be the place to start before making portfolio changes.
If taxes and withdrawal order matter most, use a full-account view
If taxes appear to be the main risk driver, the analysis may need to shift from portfolio value to after-tax cash flow. Tax and withdrawal decisions may be easy to mishandle when accounts are viewed one by one. The best withdrawal order may depend on the full picture: current tax brackets, future RMD exposure, and Social Security timing, not just one account.
Morningstar's research found that combining tax-efficient asset location with smart withdrawal sequencing can add the equivalent of roughly 3.23% per year in retirement income compared with an uncoordinated approach.[9]
That's where a full-account view may matter. A consolidated view may make it easier to compare withdrawal sequences across taxable, traditional, and Roth accounts. If taxes are driving the risk, it may help to test the full account mix before changing withdrawals.
Build a retirement plan that holds up, not just one that looks good
Once you know which assumptions move the result the most, the next step is to make the plan less fragile. A retirement plan may only be as strong as the assumptions behind it.
A plan that holds up may be one that survives realistic misses. It builds in some flex through spending guardrails, a backup retirement date, and tax-aware withdrawals, with the goal of absorbing drift without the plan going off course.
Sensitivity testing may reduce uncertainty by showing where the plan is most exposed.
Some people focus on the two or three variables that move their outcome the most. That gives a short list of assumptions that may be worth revisiting first.
Key takeaways
In practice, some people start with a base case built from real balances, actual spending, and current tax status.
Then they test one variable at a time, such as:
returns
inflation
retirement age
savings
Social Security
taxes
From there, attention often shifts to the biggest drivers they may control: spending, timing, and withdrawal order.
It may also make sense to revisit the top assumptions each year and after major life or market changes.
Sensitivity testing may improve decisions, but it does not guarantee results. Treat the output as a planning signal, not a promise.
FAQs
How often should I rerun a sensitivity test?
It may make sense to rerun a sensitivity test any time your financial situation, market conditions, or tax rules change.
At a minimum, some people review their retirement plan once a year. Some people also do quick 10-minute check-ins on a regular basis to spot potential issues early. It may help to treat your plan like a living document and revisit it often so it stays aligned with your goals.
Which assumption is usually most important?
No single assumption may matter most in every case. The impact may depend on your personal financial situation.
That said, small shifts in inflation, investment returns, or retirement age may compound over time and lead to large shortfalls. A common approach may be to stress-test your plan one assumption at a time and see which variable may affect your outcome the most.
Should I test taxes before or after spending?
It may help to test taxes and spending together, not as separate parts.
Spending shapes how much you may need to withdraw. And withdrawals may affect taxes.
If you change one without testing the other, you may miss effects like:
moving into a higher tax bracket
higher Medicare premiums
more of your Social Security becoming taxable
It may make sense to model spending and withdrawals side by side, so you can see how the two interact. That kind of view may show whether a plan remains sustainable over time and stays tax-efficient.
Disclosures:
This content is for informational purposes only and does not constitute investment advice or a recommendation to buy or sell any security.
Past performance is not indicative of future results. No guarantee of future performance or outcomes is implied.
Savings and performance examples are hypothetical and for illustrative purposes only. Actual results will vary based on individual circumstances, portfolio composition, market conditions, and fees.