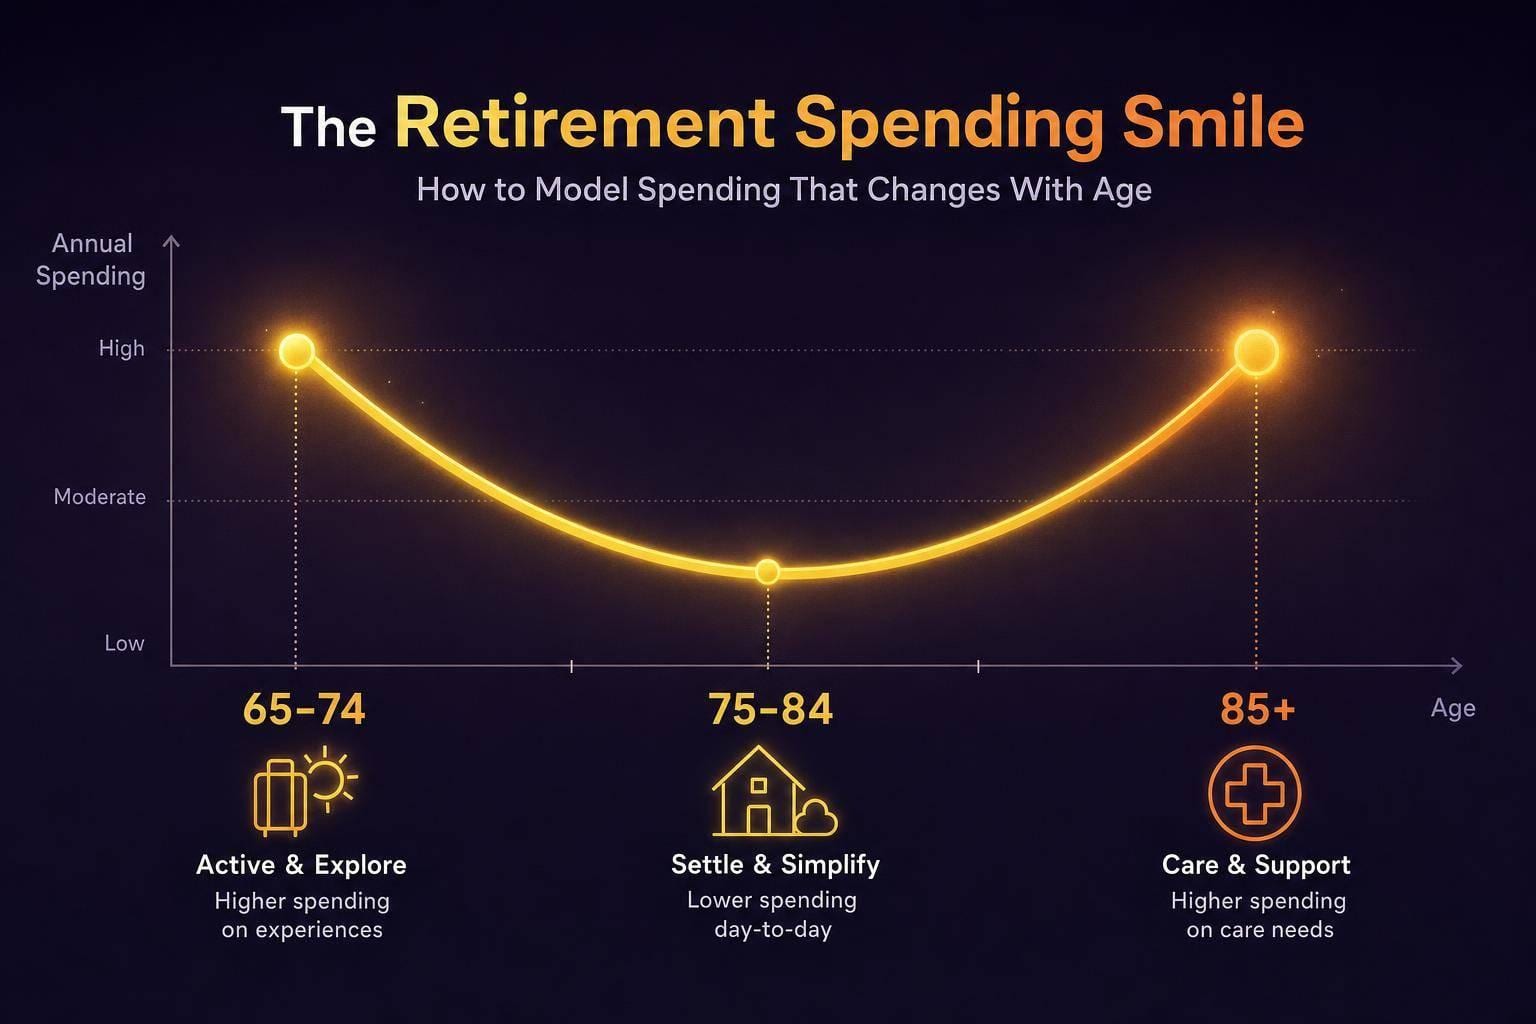
Retirement spending may not stay flat. For many households, it may start higher, dip in the middle years, and then move up later as health and care costs take a larger share.
If I were summarizing this article in plain English, I’d put it this way: a single inflation-adjusted budget like $78,000 a year may miss two common pressure points - an early phase that may look closer to $90,000, and a later phase where medical or care costs may push spending up again. Research cited here points to real spending declines of about 1% to 2% per year through much of retirement, while care costs may still be high later on.
Here’s the short version:
I may break retirement into three age bands: 65–74, 75–84, and 85+
I may sort costs into four buckets: housing/basic bills, lifestyle, healthcare, and care reserve
I may use phase-based withdrawals instead of one fixed annual draw
I may test general inflation separately from healthcare inflation
I may keep long-term care as its own line item instead of blending it into the base budget
A flat plan may look neat on paper. But a phase-based plan may give a closer view of how spending patterns may shift with age.
Retirement Spending Isn't Flat - It's a U-Shaped Curve
1. What the retirement spending smile means for U.S. retirees
U.S. retirees may move through three spending phases: higher spending early on, a dip in the middle years, and a later rise. The key point here is to look at real, inflation-adjusted spending, not just nominal dollar totals.
What the research says about how spending changes with age
Blanchett's research suggests retiree spending may fall by about 1% per year on average, with steeper declines in the middle years and a possible late-life uptick.[2][3] That pattern matters because one flat spending number may hide two very different things: the mid-retirement dip and the later-life spike.
Some planners use that average pattern as a starting point, then stress-test for higher healthcare and long-term care costs.[1][4][5]
How flat spending assumptions create planning errors
A flat $100,000 real spending assumption may overstate spending in mid-retirement and understate care costs later in life. That's where the gap may get large.
The 2024 CareScout national median for assisted living is $70,800 per year. A semi-private nursing home room costs $111,325 annually, while a private room reaches $127,750.[6] Home health aide services come in at a national median of $77,792 per year.[7]
Those figures may shift withdrawal needs in the final phase of retirement.
The next step is to translate that pattern into age-based expense categories and dollar amounts. A simple phase table makes the shift easier to see.
| Retirement Phase | Age Band | Spending Trend | Main Cost Drivers |
|---|---|---|---|
| Go-Go Years | 65–74 | High / Peak | Travel, hobbies, lifestyle, home projects |
| Slow-Go Years | 75–84 | Declining (~1–2% per year, real) | Essentials, local leisure, reduced activity |
| No-Go Years | 85+ | Rising | Healthcare, home support, long-term care |
2. Build an age-based retirement budget by expense category
Instead of using one flat retirement number, map your budget to age bands. The goal is simple: turn the spending smile from Section 1 into a working budget across three phases of retirement.
Split expenses into essentials, lifestyle, healthcare, and reserve costs
Four categories cover most retirement spending, and each one may change in a different way over time.
Essentials include housing costs like property taxes, insurance, utilities, and maintenance, plus groceries, core transportation, and basic communications. Housing may stay fairly steady at first, then take up more of the budget later. Households age 75 and older devote about 39% of spending to housing, compared with 34% for households ages 65–74.[11]
Lifestyle covers the flexible stuff: travel, dining out, hobbies, gifts, and entertainment. This category often lines up with the early-retirement peak, then may shrink as mobility and daily routines change.
Healthcare may move up with age. It includes Medicare Part B, Medigap or Medicare Advantage premiums, Part D drug coverage, copays, prescriptions, and dental and vision care. The 2026 standard Medicare Part B premium is $202.90 per month.[12]
Reserve costs are the wildcard. In 2026, estimates put home care at around $34 per hour, assisted living at about $5,419 per month, and a private nursing home room at roughly $10,798 per month.[9][8] These costs may not show up every year, but they may shape the 85+ budget more than any other line item. That late-life jump is a big reason the curve rises again. It often makes more sense to treat this as a separate reserve line instead of folding it into a normal annual budget.
Assign dollar amounts to each age band: 65-74, 75-84, and 85+
Start with your own spending history. Pull 6–12 months of statements, sort each transaction by category, and annualize the totals. That gives you a baseline from actual spending, not a rough estimate.
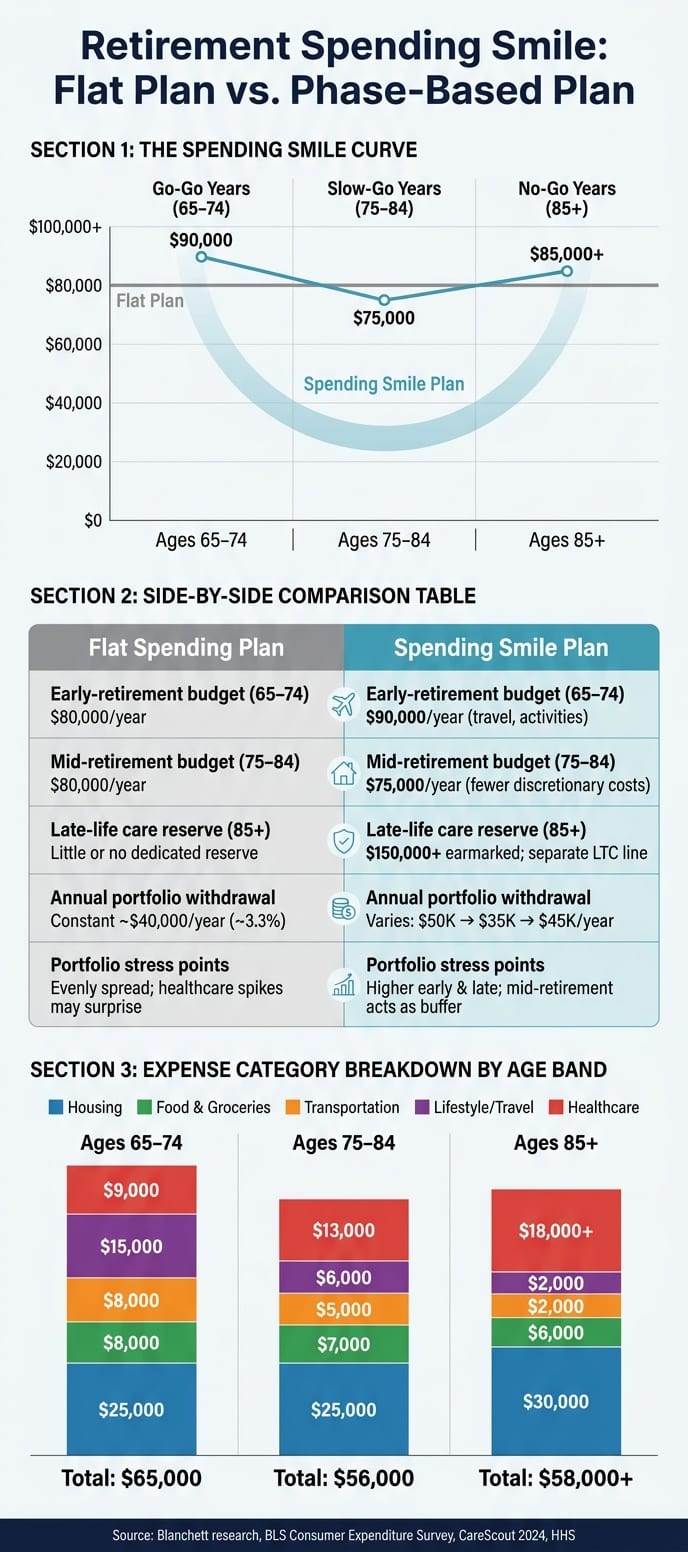
Then adjust each category by life phase. Travel, for example, may fall from $15,000 in the late 60s to $6,000 in the mid-70s and $2,000 after 85. Healthcare may move from about $9,000 to $13,000, then $18,000 or more. That same pattern shows up in Bureau of Labor Statistics data: transportation spending drops from $7,972 per year for households ages 65–74 to $5,149 for households 75 and older.[10]
Keep one-time costs out of the recurring annual budget. A car replacement every 8–10 years, a $10,000–$25,000 home modification project like ramps, grab bars, or a stair lift, or a major hearing aid purchase may distort a single year's spending if you lump it into the base budget. Some retirees model these as planned one-time withdrawals in specific years. Others set aside a reserve, such as around $3,000 per year for future vehicle replacement.
Use a budget table to see where the dip and rise actually come from
The point here isn't perfect precision. It's to show which costs may fall, stay flat, or move up in each age band. This example uses a hypothetical retired couple with moderate spending.
| Expense Category | Ages 65–74 | Ages 75–84 | Ages 85+ | Trend |
|---|---|---|---|---|
| Housing | $25,000 | $25,000 | $30,000 | Steady, then rising |
| Food & Groceries | $8,000 | $7,000 | $6,000 | Gradually declining |
| Transportation | $8,000 | $5,000 | $2,000 | Falling |
| Lifestyle / Travel | $15,000 | $6,000 | $2,000 | Falls sharply |
| Healthcare | $9,000 | $13,000 | $18,000+ | Rising |
| Reserve costs | - | - | Varies | Late-life wildcard |
| Total Annual Budget | $65,000 | $56,000 | $58,000+ | High → Dip → Rise |
Those phase totals may then serve as the spending input for withdrawal assumptions and retirement projections.
3. Turn age-based budgets into withdrawal targets and retirement projections
Once you have totals for each age band, subtract income that may arrive no matter what happens in the market, like Social Security or a pension. What’s left is the amount your portfolio may need to cover in each phase. That figure becomes the starting input for your retirement projection.
Model withdrawals by phase instead of using one fixed spending number
In a hypothetical example, consider a couple retiring at 65 with $1,200,000 in investment assets and $40,000 per year in combined Social Security. Under a flat spending plan of $80,000 per year, they may need $40,000 annually from their portfolio. That comes out to an initial withdrawal rate of about 3.3% each year, no matter their age.
Now compare that with a phase-based plan for the same couple. Instead of pulling the same amount every year, withdrawals may start at $50,000 in the early years, drop to $35,000 in mid-retirement, and then move up to $45,000 later. Total lifetime spending may look similar on paper, but the cash-flow shape is very different.
A simple way to model this is to use fixed spending by age band as the base case. If you want more moving parts, you may layer in guardrail withdrawals or phase-based withdrawal percentages.
Next, it helps to pressure-test the costs most likely to throw off the pattern: healthcare and long-term care.
Stress-test healthcare inflation and long-term care costs separately
One practical approach is to run two inflation rates in the same projection:
About 2.5% to 3% for housing, food, and transportation
About 4% to 6% for Medicare premiums, supplemental coverage, prescriptions, and long-term care
Some projections put long-term healthcare inflation near 5.8%, versus about 2.4% for Social Security COLA.[14][15][16] So an $8,000 healthcare budget at age 65, growing at 5% per year, may become about $13,000 by age 75 and $21,000 by age 85, before adding any long-term care costs.[14][15][16]
For late-life care, it often makes more sense to model it as a separate expense line instead of a smooth yearly increase. A Department of Health and Human Services research brief estimates that an American turning 65 today will incur an average of $120,900 in future paid long-term services and supports costs. Among people who end up using paid care, the average rises to $245,400.[13]
You may model recurring home care starting around age 80, maybe $800 to $1,500 per month, plus a one-time home modification expense around age 78 or 82. Entering those as separate events, rather than smearing them across every year, may give you a more realistic view of when portfolio pressure shows up.
Compare a flat spending plan with a spending-smile plan side by side
| Planning Dimension | Flat Spending Plan | Spending Smile Plan |
|---|---|---|
| Early-retirement budget (65–74) | $80,000/year | $90,000/year (higher travel, activities) |
| Mid-retirement budget (75–84) | $80,000/year | $75,000/year (fewer discretionary costs) |
| Late-life care reserve (85+) | Little or no dedicated reserve | $150,000+ earmarked; separate LTC line item |
| Withdrawal pattern | Constant ~$40,000/year (~3.3%) | Varies: $50,000 → $35,000 → $45,000/year |
| Projected portfolio stress points | Evenly spread; healthcare spikes may catch the plan off guard | Higher stress in early and late phases; mid-retirement provides a natural buffer |
A flat plan may overstate how much spending you’ll need in the middle years while missing some late-life healthcare risk.[2][17] A spending-smile plan makes those pressure points easier to see. You may then use that timing to test savings targets, withdrawal rates, and late-life reserves in Mezzi.
4. Use Mezzi to check a spending-smile plan against real account data
Once the spending smile is mapped, the next step may be to test it against your actual accounts in Mezzi. It connects in read-only mode to balances and transactions through Plaid and Finicity, so you may review the plan without giving up control of your money.
Start with your actual balances, spending patterns, and retirement timeline
Connect your accounts - 401(k), IRA, Roth IRA, brokerage, and bank - through a secure Plaid or Finicity window. Mezzi imports balances, holdings, and recent transaction history without ever seeing your login credentials. Your retirement timeline, income goals, and spending then shape the plan, and that baseline becomes the starting point for phase-by-phase spending assumptions.
Build the age-band budget from your actual spending
You can ask Mezzi how your spending has shifted across categories in your linked accounts and look at the transactions behind each one. That may give you a baseline for today's essential, lifestyle, and healthcare costs, which you sort and refine yourself - separating a recurring utility bill from a one-time vacation, for example - so the baseline reflects how you spend today.
How each of those buckets may shift across the three phases of retirement is an assumption you set, using the patterns above as a starting point, and revisit as your situation changes.
Stress-test the plan against your full balance sheet
Mezzi is designed to stress-test a drawdown against your full balance sheet, estimate a sustainable spending level, and flag the years where you could fall short. Running that check at your early-retirement spending level, and again at your projected late-life level, may show which phase puts the most pressure on the plan.
Mezzi also weighs which accounts to draw from first. From there, some people adjust savings targets, withdrawal assumptions, and late-life reserves based on what the comparison shows.
Conclusion: Build a retirement plan around spending that changes by age
Retirement spending is rarely a straight line. It may start higher, dip in the middle years, and then move up again later as care needs grow. The practical takeaway is pretty simple: model retirement in phases, not as one annual number. A flat annual spending assumption may miss both the early-retirement bump and the late-life cost surge. When you build budgets across the three phases - 65–74, 75–84, and 85+ - the pattern may become a lot easier to plan around.
It may also help to split expenses into a few clear buckets: essentials, lifestyle, healthcare, and contingent costs. That gives you a much clearer picture of where money may actually go. Healthcare may take up a larger share of the retirement budget later on, so one blended number may understate that shift.
Long-term care may be easier to handle as a separate late-life reserve instead of being folded into routine spending. That rise in the final phase may be tied in large part to care costs. Treating those costs as their own line item may be one simple way to reduce the chance of a late-retirement shortfall.
Once the age-band budget is set, withdrawals may be modeled on that same age-based curve. Mezzi may be used to stress-test those spending levels against your full balance sheet and see which years may fall short.
These steps may sharpen savings targets, withdrawal rates, and portfolio flexibility. That may be the difference between a rough estimate and a retirement plan you may actually use.
FAQs
How do I estimate my own retirement spending smile?
Start by sorting your spending into essential costs, such as housing and healthcare, and discretionary spending, such as travel and hobbies. Then track what you spend over 12 to 24 months so you may set a baseline that reflects your actual habits, not a rough guess.
From there, model how those categories may shift over time. Some retirees may spend more on discretionary items in the early years, less in the middle, and then more later as healthcare or long-term care costs increase. Mezzi can show how your spending has shifted across categories in linked accounts, which may make that baseline easier to build; how each category shifts with age, including healthcare inflation, remains an assumption to set and revisit.
What expenses should I separate from my base retirement budget?
Separate your retirement expenses into essential, discretionary, and healthcare costs.
Essential expenses may include housing, utilities, groceries, and transportation. These are the bills and day-to-day costs that many people treat as the base of their budget.
Discretionary expenses may include travel, dining out, and hobbies. It often makes sense to track these on their own because they may be easier to adjust over time.
Healthcare costs may also be worth separating from your main budget. For many retirees, these costs may rise faster than general inflation. Keeping them in their own bucket may make cash flow easier to track and may make plan changes simpler later on.
How much should I set aside for late-life care costs?
Late-life care may come with costs that Medicare does not cover. That may include dental, vision, hearing, and long-term care. One common estimate suggests an individual may need up to $172,500 in after-tax savings, while a couple may need about $330,000.
Healthcare costs may also rise faster than general inflation, so some people budget for those increases on a separate line. An HSA may help here too, since it offers tax-free growth and tax-free withdrawals for qualified medical expenses.
Disclosures:
This content is for informational purposes only and does not constitute investment advice or a recommendation to buy or sell any security.
Past performance is not indicative of future results. No guarantee of future performance or outcomes is implied.
Savings and performance examples are hypothetical and for illustrative purposes only. Actual results will vary based on individual circumstances, portfolio composition, market conditions, and fees.