
A 7-year gap between one spouse retiring at 60 and the other at 67 may change far more than paychecks. It may shift taxes, health coverage, Social Security timing, and how much a portfolio may need to cover from year to year.
Here’s the short version:
If both spouses retire together, income may drop all at once, which may put more pressure on savings early.
If Spouse A retires at 60 and Spouse B keeps working full-time until 67, one paycheck may keep the gap smaller and may leave more room around claiming Social Security later.
If Spouse A retires at 60 and Spouse B works part-time until 67, withdrawals may be lower than a full stop, but health coverage, hours, and pay may be less certain.
In the examples, the plan uses $90,000 in yearly household spending, inflation-adjusted dollars, taxes, Social Security for each spouse, and health costs before and after Medicare.
One sample case shows that if both spouses stop work at 62 with $48,000 of combined Social Security at 67, the bridge before benefits begin may call for about $450,000 in pre-tax withdrawals, before health costs.
This article does not try to pick one path. Instead, it shows how couples may compare the same three paths across:
cash flow
taxes
health insurance before Medicare
Social Security claiming
withdrawal order
survivor income
portfolio durability
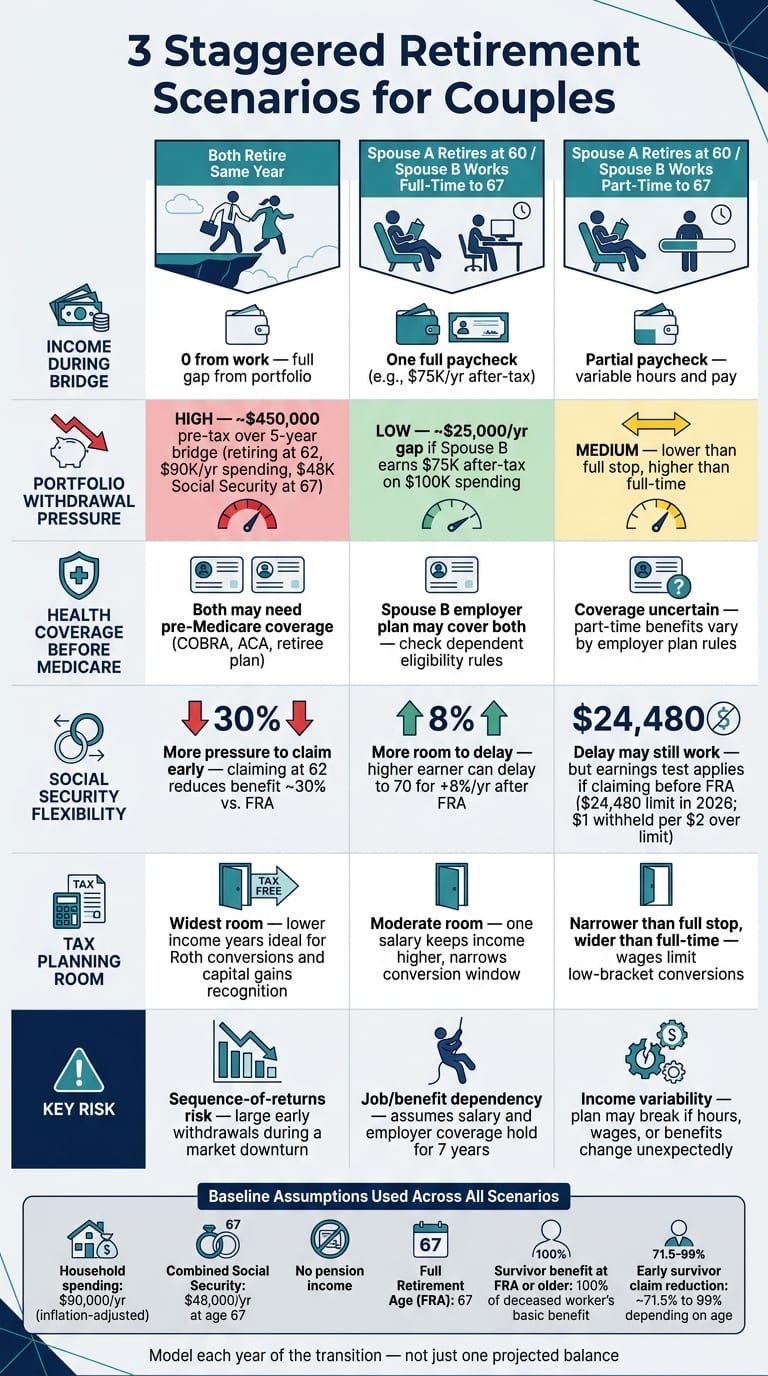
Retirement Planning When One Spouse Retires First
Quick Comparison
| Scenario | Income during the bridge | Early withdrawal pressure | Health coverage questions | Social Security pressure |
|---|---|---|---|---|
| Both retire in the same year | None from work | Higher | Both may need pre-Medicare coverage if under 65 | More pressure to claim earlier |
| A retires at 60, B works full-time to 67 | One full paycheck | Lower | Employer plan may stay in place, depending on rules | More room to delay |
| A retires at 60, B works part-time to 67 | Partial paycheck | Middle | Part-time benefits may vary | Delay may still work, but earnings rules may matter |
The main takeaway: a retirement date may look fine on paper, but the better test may be whether the plan still holds up after a market drop, a job change, or higher medical costs. That’s why many couples may model each year of the transition instead of relying on one balance projection.
1. Both spouses retire in the same year
When both spouses retire in the same year, household income may drop fast because both paychecks stop at once. A useful first step may be to measure the cash-flow gap: annual spending minus income you may count on from Social Security, pensions, and other guaranteed sources.
Under the baseline - $90,000 in annual spending, no pension, and $48,000 in combined Social Security at 67 - retiring at 62 may leave a five-year gap that the portfolio may need to cover. That may amount to roughly $450,000 in pre-tax withdrawals, before healthcare costs.
One of the biggest risks in that early stretch may be sequence-of-returns risk. If weak market returns show up early in retirement, withdrawals during a downturn may leave less money in the portfolio for a rebound later. That’s why some people stress-test the plan against poor early returns instead of looking only at average results.
Healthcare also needs its own model before Medicare begins. Costs may include:
ACA coverage
Retiree coverage
Premiums, deductibles, and coinsurance
Prescriptions, dental, vision, and out-of-pocket maximums
When wages stop, a couple may have more room for Roth conversions or gain recognition. But those moves may also increase taxable income and may lead to higher Medicare premiums through IRMAA. That may change the size of the withdrawals needed to bridge the gap, so taxes and healthcare may need to be modeled together rather than separately.
Social Security claiming is a separate choice from the retirement date, which means one spouse may claim earlier while the other delays to support survivor income later on. For workers with a full retirement age of 67, claiming at 62 generally reduces the benefit by about 30%, while delaying after full retirement age may increase the worker’s benefit by roughly 8% per year until age 70 [2][3].
| Social Security claiming choice | Short-term portfolio need | Long-term income effect |
|---|---|---|
| Both claim at 62 | Lower - benefits start immediately | Permanently reduced |
| Both delay to 67 (FRA) | Higher - portfolio funds the gap | Full benefit; stronger survivor income |
| Both delay to 70 | Highest - largest bridge need | Maximum lifetime benefit |
This baseline may serve as the reference point for the staggered-retirement scenarios that follow.
2. Spouse A retires at 60 while Spouse B works until 67
Compared with both spouses retiring at the same time, this setup leaves one paycheck in place and may create a smaller income gap. The seven-year bridge may be modeled year by year by subtracting Spouse B's after-tax pay and other income from spending, debt, insurance, and retirement costs. If the household may need $100,000 a year after tax and Spouse B brings home $75,000, the portfolio may need to cover about $25,000 in the first year, adjusted for inflation, before irregular costs like travel, home repairs, or medical bills. That figure may serve as the baseline when looking at whether part-time work narrows the gap.
Healthcare may be the first cost to sort out. Spouse A may need coverage from age 60 to 65, so it may make sense to model the cost of joining Spouse B's employer plan, COBRA, or an ACA policy against household income. Marketplace premiums are income-sensitive, which means retirement-account withdrawals or capital gains during this stretch may affect subsidy eligibility.
When Spouse A retires, taxable income may drop. That may create room for Roth conversions or capital gains recognition. But withdrawals still count as ordinary income and may affect ACA subsidies. The aim may be to stay in lower tax brackets while also preserving subsidy eligibility.
Social Security claiming is separate from the retirement date. Since Spouse A has already stopped working, it may be worth comparing Spouse A's own benefit with a spousal benefit, which may be as much as 50% of the higher earner's full retirement benefit at full retirement age [4][5]. Delaying the higher earner's benefit until 70 may also strengthen the survivor benefit later.
| Claiming scenario | Short-term portfolio need | Long-term income effect |
|---|---|---|
| Spouse A claims at 62 | Lower - partial income starts early | Permanently reduced; about 70% of FRA benefit [6] |
| Spouse A delays to 67 (FRA) | Higher - portfolio funds the full gap | Full benefit; stronger survivor income |
| Higher earner delays to 70 | Highest bridge need | Maximum lifetime benefit for survivor |
Strategically planning your retirement withdrawals may matter most during this seven-year bridge. Some households draw from taxable assets first, keep a short cash buffer, preserve Roth flexibility, and stress-test the plan for an early market drop. Spouse B's ongoing 401(k) contributions may offset part of the gap. The next model looks at whether part-time income may change the tradeoff enough to improve flexibility.
3. Spouse A retires at 60 while Spouse B shifts to part-time until 67
When Spouse B moves to part-time work instead of staying fully employed, household income drops, but it doesn't disappear. That middle ground changes the math. The main tradeoff is pretty simple: part-time work may reduce how much the portfolio needs to cover, but it may also add uncertainty around hours, health coverage, and employee benefits.
A practical starting point is to look at spending, subtract Spouse B's after-tax pay and any other steady income, and then model the remaining gap that the portfolio may need to fill. That model may need to include hourly pay, expected hours, payroll taxes, state income taxes where they apply, employer benefits, and the chance that the job ends earlier than planned. Because those inputs may shift from year to year, this usually works better as a cash-flow model than as one average estimate.
Model each year from 60 to 67 on its own. Wages may change. Spending may change. Taxes and insurance premiums may change too. It may also help to separate essential spending from optional spending, since that may show how much the couple might trim if part-time income falls short. Many people test at least three versions of the plan:
planned part-time work
reduced hours
no employment income
If the plan only works when part-time employment continues exactly as expected, that may leave less room for error than a plan that still works if Spouse B stops working a few years early.
Healthcare is one of the biggest moving parts in this setup. Whether Spouse B's employer keeps group health coverage in place for part-time workers depends on the plan's eligibility rules. If that coverage ends, the comparison may include COBRA, a spouse's plan, and ACA coverage until Medicare begins. A spouse retiring before 65 may need bridge coverage until Medicare. ACA premiums are tied to income, so part-time wages plus portfolio withdrawals may affect subsidy eligibility. Pulling too much from a traditional IRA in the same year Spouse B earns wages may increase the net cost of coverage. The core issue is whether the smaller withdrawal need may offset the added insurance and earnings rules.
Social Security adds another layer. Part-time wages may create an earnings-test issue if Spouse B claims before full retirement age and keeps working. In 2026, the annual earnings limit is $24,480 for someone below full retirement age for the entire year, and benefits are reduced by $1 for every $2 earned above that amount [1]. That withholding is not necessarily a permanent loss because Social Security recalculates benefits at full retirement age for months in which benefits were withheld [7]. And delaying the higher earner's benefit until 70 still increases the eventual monthly payment by 8% for each full year of delay after full retirement age [8].
The table below shows how part-time work stacks up against stopping work during the bridge years:
| Planning issue | Spouse B works part-time | Spouse B stops working |
|---|---|---|
| Employment income | Reduced but ongoing | None |
| Portfolio withdrawals | Lower during the transition | Higher immediately |
| Health coverage | May continue through Spouse B's employer if plan rules permit | May require Marketplace coverage, COBRA, or other private coverage before Medicare |
| Social Security flexibility | Continued wages may allow both spouses to delay benefits | Larger immediate funding gap may pressure one spouse to claim early |
| Roth conversion room | Narrower - wages keep income higher | Wider in lower-income years |
One sequencing approach some households may look at for the 60–67 bridge is using Spouse B's wages and taxable-account withdrawals for day-to-day expenses, limiting traditional IRA distributions to the amount needed to stay in a lower tax bracket, and looking at partial Roth conversions in lower-income years while keeping Roth assets available for later flexibility. That approach may keep current taxable income lower and may reduce future Medicare premium risk. These tradeoffs are usually easier to compare on one connected timeline.
4. Use a connected planning tool like Mezzi to compare staggered-retirement scenarios
These scenarios are tied together, so a change in one area may affect the rest. Wages may affect taxes. Taxes may affect ACA subsidies. Withdrawal timing may affect Social Security. A connected planner may make those tradeoffs easier to see in one model.
Mezzi connects to your accounts in read-only mode and uses your actual balances to model retirement scenarios across taxable, retirement, and cash accounts. It doesn't move money or execute trades. Instead, it is designed to let you build multi-year scenarios using real data rather than manual estimates.
For a couple comparing staggered-retirement timing, one practical starting point may be to build three separate scenarios using the same assumptions established earlier:
Both spouses retire at the same time
Spouse A retires at 60 while Spouse B works full-time until 67
Spouse A retires at 60 while Spouse B works part-time until 67
The funding gap may change sharply across those three paths. Mezzi's paid memberships support retirement projections, RMD planning, and tax-aware withdrawal strategies.[10] When the same assumptions stay in place, the differences between the three paths may become much easier to compare.
Social Security claiming ages may be set independently for each spouse, and healthcare costs may be split by coverage type - employer plan, ACA Marketplace, COBRA, or Medicare - so the tool is designed to connect those inputs across years instead of treating them separately. Account connections are unlimited on every plan, including the free tier, so adding both spouses' accounts does not create a separate per-account charge.[11]
Once the scenarios are built, the next step may be to weigh the tradeoffs one path at a time. The model may be used to compare cash flow, taxes, and flexibility side by side before weighing the pros and cons below.
Pros and Cons of Each Retirement Path
No single path may fit every couple. The better option may depend on savings, health, job flexibility, and how much schedule change a household is comfortable with. The table below compares the three paths across cash flow, taxes, healthcare, Social Security, and withdrawal pressure.
After modeling each scenario, it may make sense to compare them using the same four tests: cash flow, taxes, healthcare, and survivor income.
| Scenario | Pros | Cons | Best Fit For | Key Risk |
|---|---|---|---|---|
| Both spouses retire in the same year | Simple transition; one Social Security and withdrawal plan | Two paychecks end at once; larger initial portfolio withdrawals | Couples with sufficient assets, predictable healthcare, and a preference for simultaneous change | Sequence-of-returns risk tied to high withdrawals right after both retire |
| Spouse A retires at 60; Spouse B works full time until 67 | Continued salary; possible employer coverage; lower early withdrawals; more time to delay Social Security | Dependence on one salary and one benefits package | Couples prioritizing financial resilience, employer benefits, or a larger survivor benefit | Assuming salary or coverage may continue unchanged for seven years |
| Spouse A retires at 60; Spouse B works part time until 67 | Partial income; gradual transition; more room for tax planning | Lower income than full-time work; benefits may disappear; irregular cash flow | Couples seeking flexibility who can tolerate variable income and have adequate savings | Underestimating the income, benefits, and schedule variability of part-time work |
Employer plan rules need to be checked directly with the employer, since not all plans extend dependent coverage to a non-working spouse. That may make the full-time bridge look stronger on paper, but it may also be less flexible if the job changes.
When both spouses claim early to cover living expenses, early claiming may weaken survivor income. Delaying the higher earner may strengthen it. A surviving spouse at full retirement age or older generally receives 100% of the deceased worker's basic benefit, while claiming earlier may reduce that amount to roughly 71.5% to 99%.[12][13] The remaining question may be which trade-off the household can live with.
The right path may be the one that still works in a bad market, after a health shock, or after a job change.
Conclusion
After comparing same-year, full-time staggered, and part-time staggered retirement, the last test may be resilience. There’s no single retirement date that may work best for every couple. The better fit may be the plan that still holds up through market drops, higher healthcare costs, or job changes. That means testing each scenario - same-year retirement, staggered full-time, or staggered part-time - against the same core measures: reliable cash flow, healthcare continuity, tax flexibility, Social Security outcomes, and portfolio resilience.
Compare retirement dates year by year, not by one projected balance. A plan may still break down if healthcare gaps, taxes, or withdrawal timing create pressure later. Some households run projections through at least age 95 to account for longevity. It may also make sense to stress-test each scenario for market drops and inflation. That may be the real test of a staggered-retirement plan.
Revisit the model yearly and after any job loss, market drop, health change, or spending shift.
Rules vary by household and change over time. Because retirement timing may affect taxes, coverage, and benefits at the same time, expert review may help validate the model. A planner, tax professional, and benefits expert may each pressure-test withdrawals, taxes, coverage, and Medicare timing. It may also help to check each spouse's Social Security estimate against the official earnings record and benefit statement, since claiming ages and benefit reductions depend on individual circumstances.[9][14]
The goal is to cover essential spending while preserving flexibility.
FAQs
How much cash should we keep during the retirement gap?
Many households keep a cash reserve equal to 6 to 12 months of living expenses. That cash may give you liquidity for near-term needs and may reduce the chance that you’d need to sell investments during a market downturn.
Beyond that reserve, a taxable brokerage account may help bridge the years before Social Security or required minimum distributions begin. It may also preserve flexibility and may help with managing taxable income.
Which spouse should delay Social Security?
Generally, the higher-earning spouse may choose to delay claiming Social Security until age 70. Doing that may increase the monthly benefit by about 8% per year after full retirement age and may strengthen long-term household income.
Survivor benefits are based on the higher earner’s benefit, so that delay may also provide more security for the surviving spouse. The lower-earning spouse may claim earlier to help with near-term cash flow.
How do we stress-test a staggered retirement plan?
Couples may use AI-powered scenario modeling to test how your portfolio may hold up across different market conditions, inflation rates, and surprise expenses. Monte Carlo simulations may show the likelihood of meeting your goals and may point to the moments when your plan may be more exposed to market downturns.
You may also model the effects of delaying Social Security, changing withdrawal sequencing, and covering health care costs before Medicare eligibility. It may make sense to revisit projections on a regular basis as your situation changes.
Disclosures:
This content is for informational purposes only and does not constitute investment advice or a recommendation to buy or sell any security.
Past performance is not indicative of future results. No guarantee of future performance or outcomes is implied.
Savings and performance examples are hypothetical and for illustrative purposes only. Actual results will vary based on individual circumstances, portfolio composition, market conditions, and fees.