Updated September 26, 2026.
The Boost · Mezzi’s Sunday email
Archived article dated November 4, 2024. This page retains the original newsletter and dated images, with a September 26, 2026 calculation guide. Historical market figures are not current readings. See current membership options and the Mezzi help center for today’s product details.
If your 401(k) or another investment account holds a broad U.S. market-cap-weighted stock index fund, you may have meaningful exposure to large companies such as NVIDIA, Apple, Microsoft, Alphabet, Meta, and Amazon without choosing their shares directly. Other index funds track different markets or asset classes; inspect the actual holdings before drawing that conclusion.
This is because these companies make up a substantial portion of the total market capitalization of the US stock market, and index funds aim to mirror the composition of the market they track.
The S&P 500 holds many companies, but diversification by number of holdings and concentration by weight are different measurements. The archived opinion below raises that distinction; it does not establish that every investor should change their allocation.

A market-cap-weighted index can hold many companies while a smaller group accounts for a substantial share of its value. Index membership is not solely a simple size ranking, and sector weights change over time.
What you need to know
Investing in the S&P 500
You may own one of these ETFs or mutual funds that track the S&P 500, including:
- Vanguard S&P 500 (VOO)
- SPDR S&P 500 ETF Trust (SPY)
- Fidelity 500 Index Fund. (FXAIX)
- Schwab S&P 500 Index Fund (SWPPX)
Have a company 401(k) plan or 529 plan for your children? You’ll find variations of these funds that track the S&P 500 but come with different tickers.
Historical market context from the original 2024 issue
The original issue discussed the 2023 performance of the "Magnificent Seven": Apple, Microsoft, Alphabet, Amazon, NVIDIA, Tesla, and Meta. The charts below retain its 2024 market context; they are not a current performance comparison.

Historical holdings snapshot: May 13, 2024
The original issue reported the following May 13, 2024 weights against its end-of-2023 figures. These are retained as dated context, not a current allocation calculation:
- Microsoft (MSFT): 7.1%, previously 6.9%
- Apple (AAPL): 6.1%, previously 6.8%
- NVIDIA (NVDA): 5.1%, previously 3.0%
- Amazon (AMZN): 3.9%, previously 3.3%
- Alphabet Class A and Class C shares (GOOGL and GOOG combined): 4.2%, unchanged
- Meta (META): 2.4%, previously 2.0%
- Tesla (TSLA): 1.1%, previously 1.8%
The archived price charts below illustrate the period discussed in the original newsletter. They are not current returns, and this update does not attribute a price movement to any single cause.

The Tesla chart is likewise a historical snapshot; it should not be used as a current trading signal.

What should you do?
Decide on the right exposure for you.
Some believe these mega-cap tech stocks will continue to get stronger and thus grow in size. Artificial intelligence (AI) is viewed as a big opportunity for each of them.
Others believe it is too risky to maintain such concentrated exposure to these seven large companies, which span several sectors and that it’s thus important to diversify away from the S&P 500 by investing in index funds with exposure to non-tech companies, smaller companies, international markets, or different asset classes like bonds and commodities.
Either way, if you have exposure to the stock market, it’s critical to follow what’s happening to these large companies and understanding what it means for your portfolio.
Calculate exposure across accounts
Editorial update, September 26, 2026. Suppose you own $15,000 of Company A directly, $200,000 in a workplace fund with a 5% Company A weight, and $100,000 in another fund with a 3% weight.
| Source | Calculation | Company A exposure |
|---|---|---|
| Direct holding | $15,000 | $15,000 |
| Workplace fund | $200,000 × 5% | $10,000 |
| Other fund | $100,000 × 3% | $3,000 |
| Combined | $28,000 ÷ $315,000 | 8.89% |
The direct position alone is 4.76% of that $315,000 portfolio. Looking through the funds changes the answer substantially. This is hypothetical arithmetic, not a result from the historical charts or a customer account.
Use holdings from comparable dates. A similarly named ETF is not automatically an exact proxy for a workplace trust or another share class. Mark unsupported holdings as unknown instead of counting them as zero exposure.
The original issue announced an upcoming X-Ray feature. For the current description, see Exposure X-Ray. It helps investigate supported fund exposure; it does not guarantee a target allocation or execute a corrective trade.
How Mezzi can help
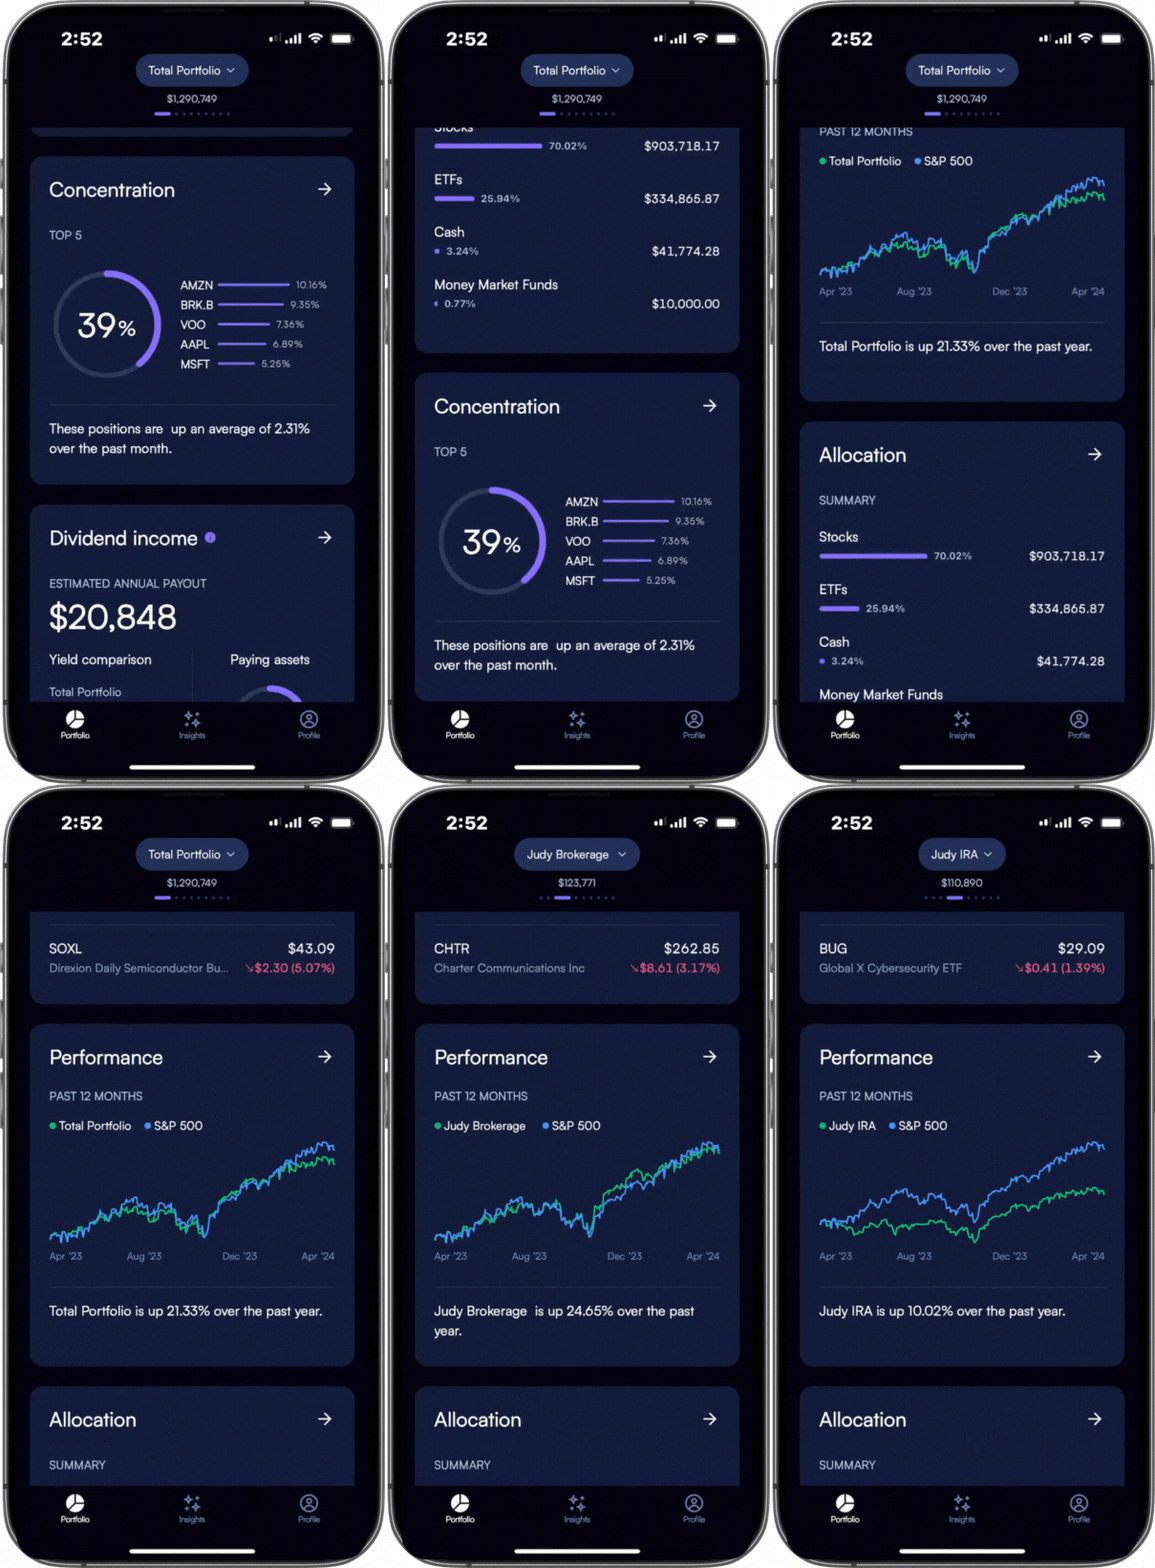
Two useful questions for an exposure review are: “What are my largest underlying company positions?” and “How much cash do I hold across accounts?” Check the available holdings and dates before relying on the answer.
Use Mezzi to unlock insights for:
- Concentration and allocation
- Portfolio and account performance
- Dividend income
- Potential capital-gains tax questions to review
- Fund costs and possible lower-cost alternatives
Explore Mezzi today. See how your available accounts and personal goals fit together.
Explore MezziFor current product details, visit the Mezzi help center.
This archived newsletter is educational and is not personalized investment, tax, or legal advice. Historical product descriptions, prices, and market examples may no longer apply. Investing involves risk, including loss of principal.