Updated September 26, 2026.
This week we provide an overview of how robo advisors work and asset allocation considerations.
What you need to know
Automated investing services typically ask about goals and risk preferences, then manage investments under an account agreement. Rebalancing, available portfolio choices, and tax-loss harvesting vary by product, account type, and eligibility. Review the actual agreement rather than assuming every service includes the same automation.
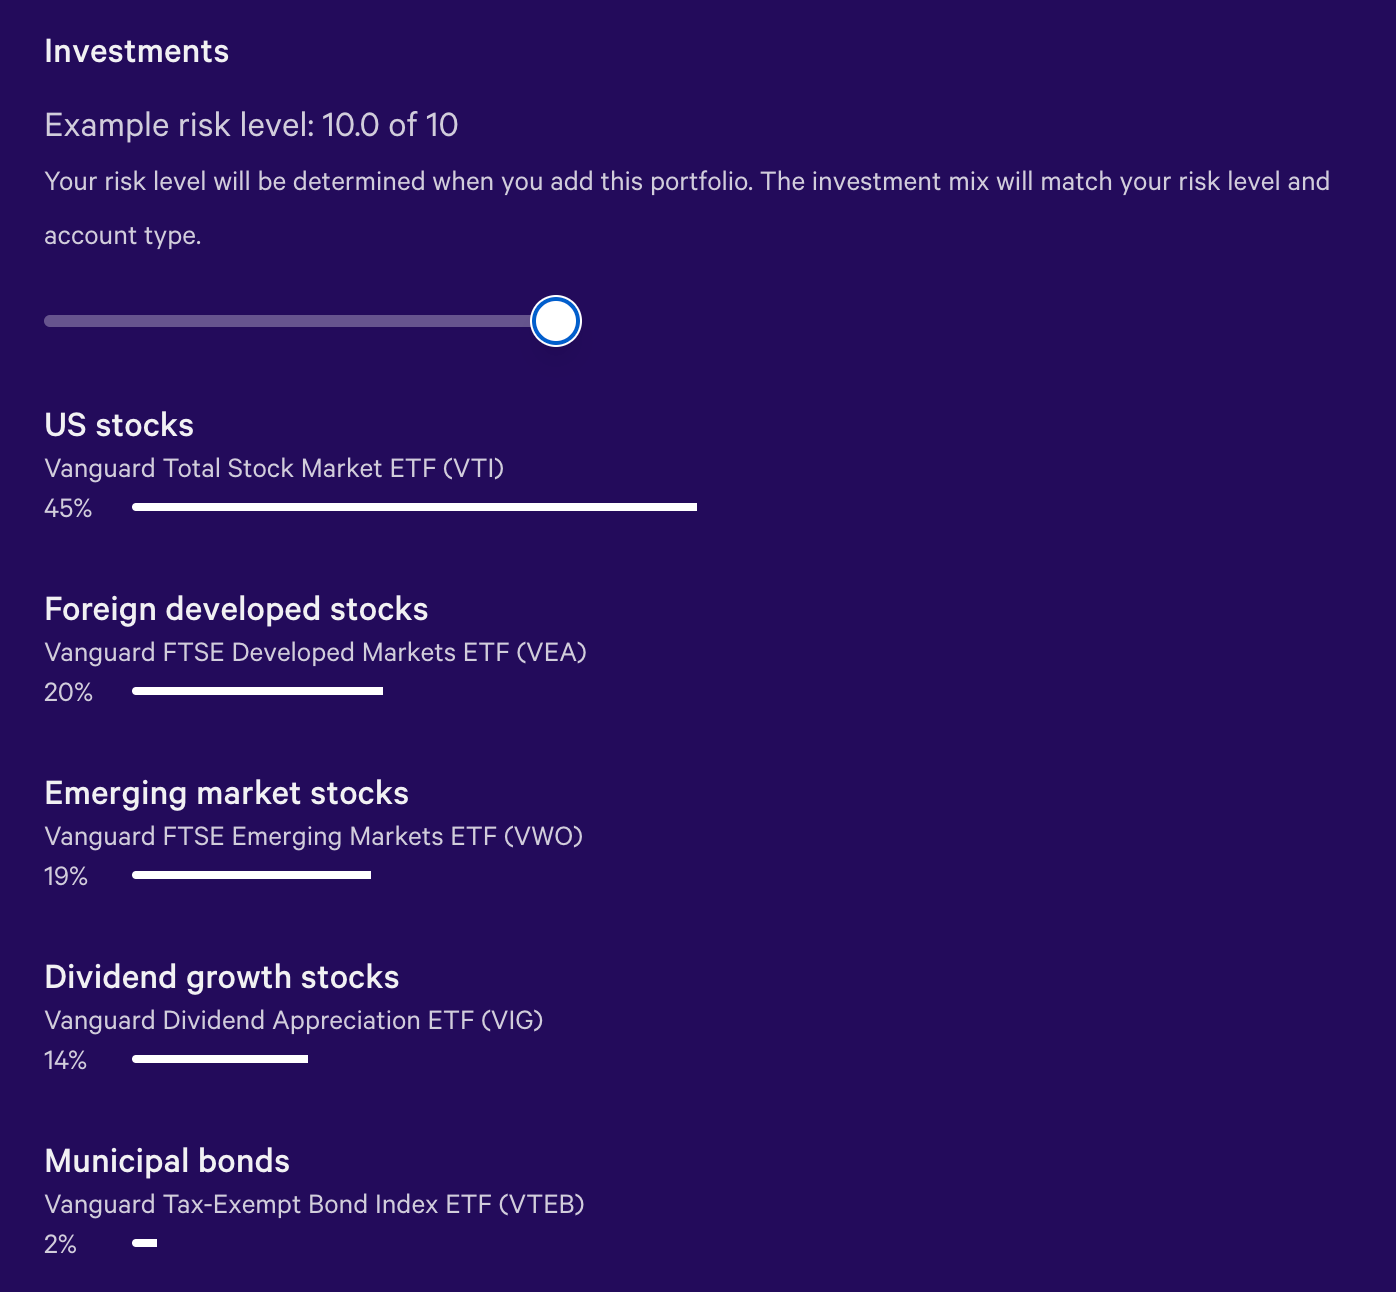
Below is Wealthfront’s Classic Portfolio with a 10 out of 10 risk profile – in other words, a higher risk portfolio based on their scale. Wealthfront uses the Modern Portfolio Theory, a popular framework for building diversified portfolios based on a long history of data.
Investing with a robo advisor is convenient, but it's crucial to understand your portfolio's allocation and risks. The archived discussion below illustrates a common source of confusion: comparing portfolios with different assets as though they took the same risk.
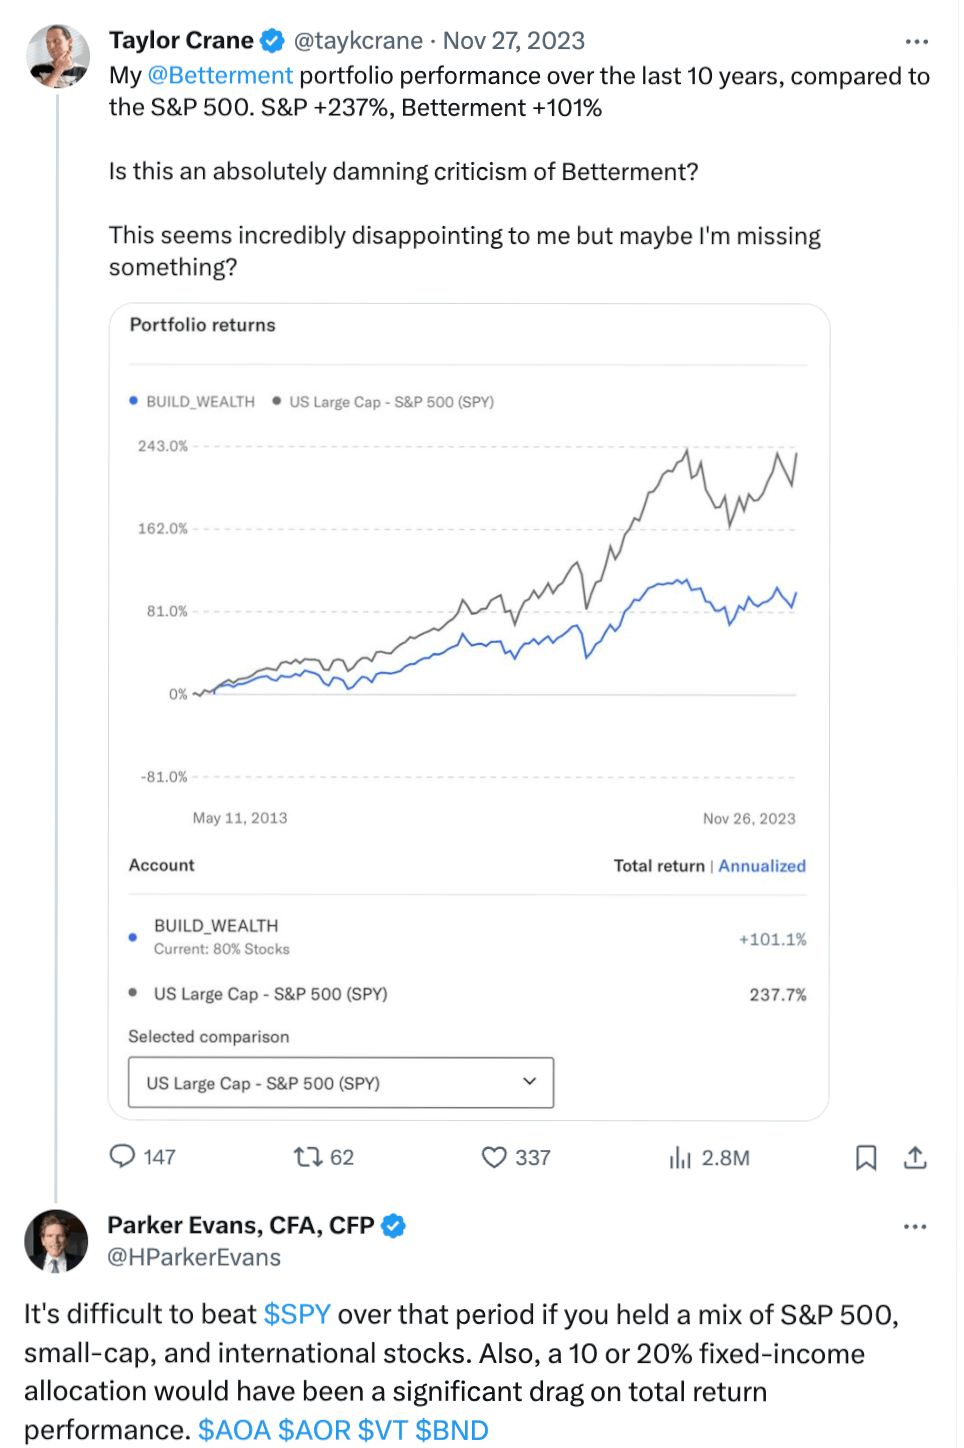
A diversified portfolio can trail a US large-company stock index in one period and behave differently in another. That difference alone does not establish poor management or prove that the index was the right portfolio for the investor.
A deeper look at diversification tradeoffs:
The historical example pictured in this issue used the following allocation. It is not a current recommendation or an assertion that this allocation remains available:
- Vanguard Total Stock Market ETF (VTI): 45%
- Vanguard Tax-Exempt Bond Index ETF (VTEB): 16%
- Vanguard FTSE Developed Markets ETF (VEA): 15%
- Vanguard FTSE Emerging Markets ETF (VWO): 15%
- Vanguard Dividend Appreciation ETF (VIG): 9%
The archived graphic below covers 2019 through January 2024. Its figures should not be read as current trailing returns or a controlled after-fee comparison: the article does not establish identical cash flows, rebalancing, tax treatment, or measurement conventions. The useful point is the different asset mix, not a conclusion that one provider or fund will win.
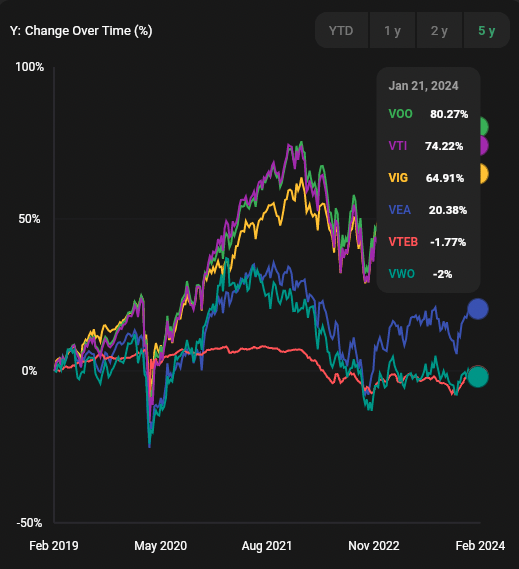
If this allocation matches your risk profile and goals, there's nothing wrong with it. For example, you may prefer it because it reduces your exposure to the Magnificent Seven. But it's important to understand why it's right for you and ensure performance meets expectations so you aren’t surprised by results over the next five years and beyond.
A useful review of an automated account
Editorial update, September 26, 2026. Check the service you actually use. Wealthfront Automated Investing lists a 0.25% annual advisory fee. Betterment's standard automated-investing price is $5 monthly unless you qualify for its percentage-based price through at least $200 in monthly recurring deposits or the relevant $24,000 balance threshold; the standard percentage rate is 0.25% annually. Premium has a separate scope and fee. Investment expenses can apply in addition. Wealthfront pricing, Betterment pricing
For a hypothetical constant $100,000 balance charged 0.25%, the annual advisory fee is $250 before fund expenses. This calculation says nothing about the value of the work or future returns.
| Review item | Question to answer |
|---|---|
| Allocation | Does the current stock/bond and geographic mix still fit the goal? |
| Outside holdings | Does a workplace plan or spouse's account change household exposure? |
| Cash needs | Is money for a near-term expense being mistaken for long-term capital? |
| Performance | Are dates, cash flows, risk, and fee treatment comparable? |
| Tax activity | Who checks relevant purchases outside the managed account? |
Suppose an automated account is $100,000 with 70% stocks, while an outside workplace plan holds $200,000 entirely in stocks. Combined investment exposure is $270,000 in stocks out of $300,000, or 90%. This hypothetical arithmetic explains why the managed account's risk label is not the household's allocation.
Keep the managed service if you value implementation and its allocation fits your goals. Investigate changes when your circumstances change, rather than reacting solely to a period in which an unrelated index performed better.
How can Mezzi help?
If you have an automated investing account, you can use available Mezzi account information to review:
- changes in allocations
- performance against a benchmark appropriate to the portfolio, with comparable dates and cash-flow treatment
- allocation vs. your other investment accounts
- performance vs. your other investment accounts or advisor-managed accounts.
If you choose to implement your own portfolio, Mezzi can help discuss available account information and your personal constraints. You take on execution and verification responsibilities. Neither lower subscription costs nor a tax-loss opportunity guarantees better returns or a particular saving.
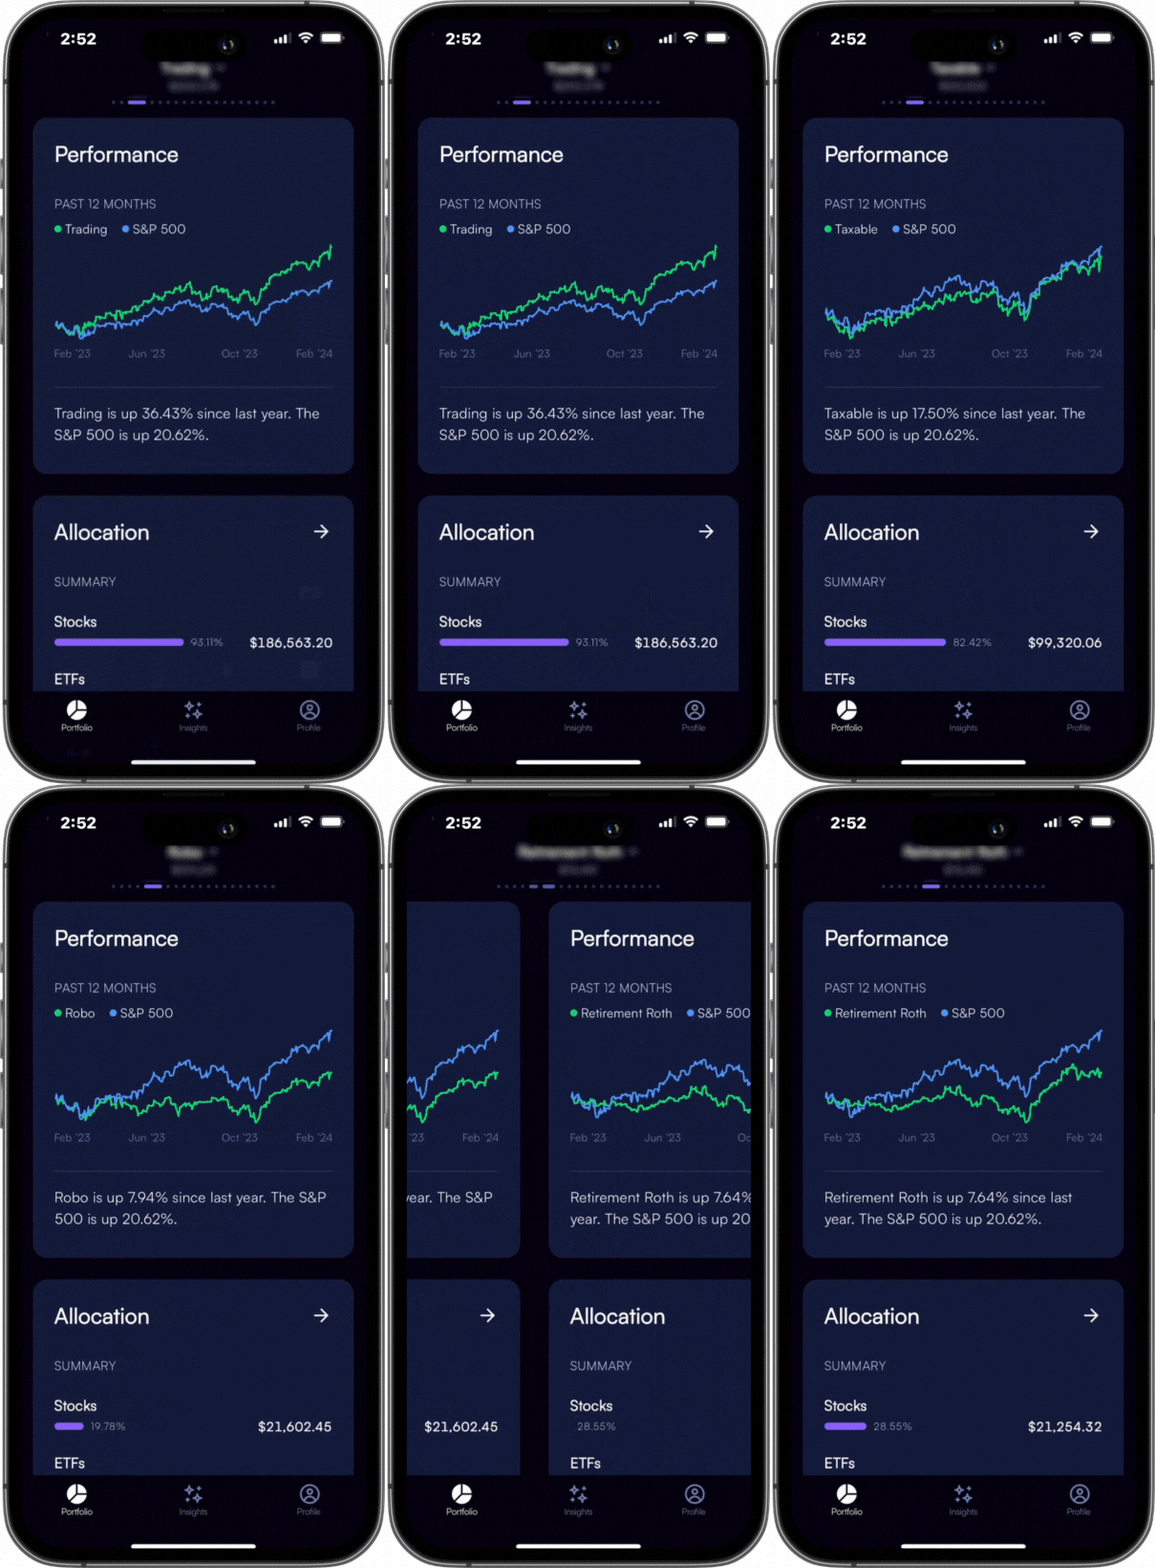
Explore Mezzi today. See how your available accounts and personal goals fit together.
Explore MezziFor current product details, visit the Mezzi help center.
This archived newsletter is educational and is not personalized investment, tax, or legal advice. Historical product descriptions, prices, and market examples may no longer apply. Investing involves risk, including loss of principal.