
A fund may show an overall gain while some of your shares may still be down. That may happen when you bought the same fund at different prices over time, since each purchase creates its own tax lot.
Here’s the short version:
Tax losses are measured by lot, not by the full position
Older shares may be up while newer shares may be down
Recurring buys and dividend reinvestment may create many separate lots
A loss lot may still exist even if the fund’s total value is higher than your total cost
Wash sale rules may apply across taxable accounts, IRAs, and in some cases a spouse’s accounts
Specific identification may give some investors more control than average cost or FIFO
A simple example shows the idea fast: if you bought shares at $30 and later at $45, and the fund now trades at $40, your full holding may still be up. But the $45 lot may still show a loss.
That gap between position-level performance and lot-level tax math is the whole point. Some investors review lot details - not just the headline return - when looking for tax-loss harvesting openings.
Tax-Loss Harvesting Explained
How tax lots work inside one mutual fund or ETF position
Brokerages track each purchase as a separate tax lot, with its own purchase date, share count, and cost basis per share.[1][3][7] That lot-level record may shape the tax result when shares are sold. That’s why one rising fund may still include loss lots.
Each purchase creates its own cost basis and holding period
Think of each purchase as its own lot inside the same fund. A $10,000 investment in a U.S. total market index fund on January 15, 2025, at $50 per share gives you 200 shares in Lot 1. A second $10,000 purchase on July 10, 2025, at $60 per share adds roughly 167 shares in Lot 2.
Your brokerage may show one position, but taxes may be calculated lot by lot.[2][4][5][6] Selling shares from Lot 1 may produce a different tax result than selling shares from Lot 2.
Why a later purchase can stay at a loss
The math gets easier to see in a simple two-lot example. At $55 per share, the lots look different:
| Tax Lot | Shares | Cost Basis | Current Value | Unrealized Gain/Loss |
|---|---|---|---|---|
| Lot 1 (01/15/2025 @ $50) | 200 | $10,000 | $11,000 | +$1,000 |
| Lot 2 (07/10/2025 @ $60) | roughly 167 | $10,000 | about $9,185 | −$815 |
| Total position | roughly 367 | $20,000 | about $20,185 | about +$185 |
The position may be up overall, but Lot 2 still shows a loss because it was bought at a higher price. That’s the gap between headline performance and tax-lot reality. A fund may be up overall and still hide loss lots that some investors may choose to harvest.
Tax treatment may also depend on how long each lot was held. Lot 1 becomes long-term after one year, while Lot 2 stays short-term until July 2026.[1][2][7]
How a rising fund ends up with both gain lots and loss lots
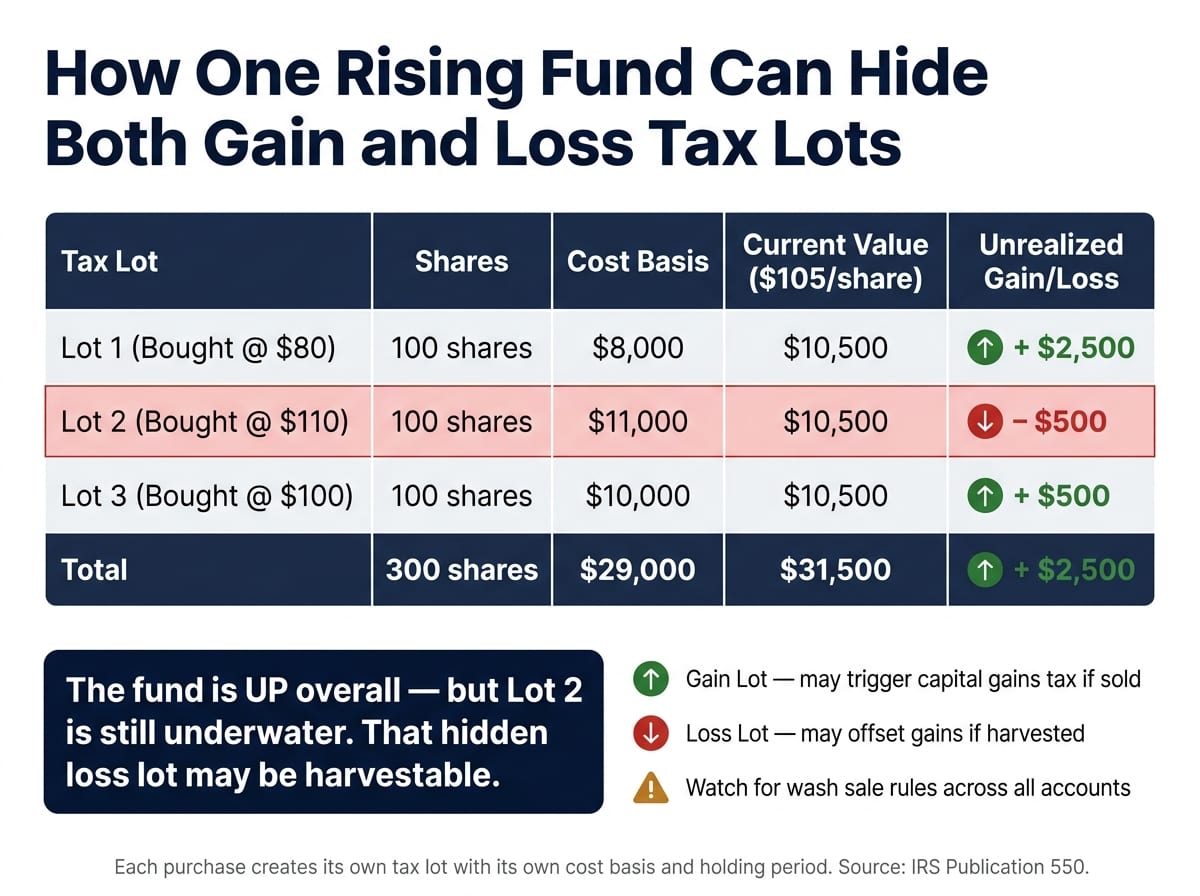
Buy the same fund at different times, and you may end up with a mix of gain lots and loss lots even when the full position is up. That's common with recurring buys and dividend reinvestment. Each new purchase creates its own tax lot, with its own cost basis. So the next step may be less about the fund's total return and more about which lots still sit below their purchase price.
Example: one fund, three purchase prices, mixed results
Say you bought 100 shares of the same ETF on three separate dates: first at $80 per share, then at $110, and then at $100. Your total cost would be $29,000 across 300 shares. If the fund now trades at $105, the position would be worth $31,500. On the surface, that leaves an overall unrealized gain of $2,500.[6][11][13][14]
But once you zoom in by lot, the picture changes:
| Tax Lot | Shares | Cost Basis | Current Value | Unrealized Gain/Loss |
|---|---|---|---|---|
| Lot 1 (bought @ $80) | 100 | $8,000 | $10,500 | +$2,500 |
| Lot 2 (bought @ $110) | 100 | $11,000 | $10,500 | −$500 |
| Lot 3 (bought @ $100) | 100 | $10,000 | $10,500 | +$500 |
| Total position | 300 | $29,000 | $31,500 | +$2,500 |
The full position may look healthy, but one lot may still be underwater. Here, Lot 1's gain offsets Lot 2's loss, so the account shows a net gain. That's why a lot-level review may tell you more than the fund's headline return. Lot 2 - bought near a short-term high - still shows a loss inside a position that otherwise appears profitable. In a taxable account, some investors may be able to sell only Lot 2 while leaving the gain lots in place. If more shares had been bought at $110, that loss lot may be larger.[14]
Recurring contributions and dividend reinvestment create loss lots
Recurring buys and dividend reinvestment add more tax lots, which may make it easier for one fund to hold gains and losses at the same time.[8][9][11] Automated investing may create many lots over time, and that may hide loss lots inside a position that still looks profitable overall.[10][12][15]
So the key issue may not be whether the fund is up. It may be which specific lots are still available to harvest.
How to find loss lots without confusing them with total performance
Once you know a fund may hold both gain and loss lots, the next step is figuring out which lots are still underwater.
What to check at the lot level before harvesting
Once a position is up overall, the work shifts to the lot level. In a typical U.S. brokerage account, look for Unrealized gains/losses or show lot details. That view may show each tax lot on its own.
Focus on four fields:
Unrealized gain or loss per lot - some lots may still show a negative number even if the full position is positive
Purchase date and holding period - this may affect whether a lot is treated as short-term or long-term under IRS rules
Cost basis per share - the original price paid for that batch of shares
Cost-basis method in use - whether the account uses FIFO, average cost, or specific identification
Not every loss lot may be worth harvesting. Some investors harvest only when the loss feels meaningful, the holding period fits their tax mix, and they may keep their allocation in a similar, not substantially identical, fund.[22][23]
If your broker uses average cost, you may have less control over which shares are sold. Specific identification (SpecID) may give you the option to choose the exact lot to sell, even when the full position looks profitable.[22][15][24][25]
That lot-level view matters for another reason: a tax benefit may disappear if another account buys the same fund too soon.
Why cross-account visibility matters
Wash sale rules may apply across all accounts you control, including taxable accounts and IRAs. Purchases in a spouse's accounts may also create wash sale risk for households filing married jointly. If you sell a loss lot in a taxable brokerage account but an automatic contribution buys the same fund in your IRA within 30 days, the loss may be disallowed. In an IRA, the loss may be disallowed and not added back to basis.[16][17][18][19][20][21]
How Mezzi helps surface tax-lot opportunities
With a full household view, hidden loss lots may be easier to spot before a market gain number masks them. Mezzi connects household accounts in one read-only view, identifies embedded loss lots inside positions that may look profitable on the surface, and flags wash sale risk before you trigger it. Mezzi does not trade for you - it surfaces lot-level detail for your review and notifies you when the 30-day wash sale window has passed, if you choose to repurchase.
Conclusion: Look past the fund's headline return
A fund's total return shows the average result for the position. It does not show what happened with each share you bought. So even if a fund looks like a winner overall, some shares purchased at a higher price may still sit at a loss. That's often where tax-loss chances may be hiding.
Lots bought near a market high may remain underwater long enough to make a tax sale worth reviewing. Under current IRS rules, realized capital losses may offset capital gains and up to $3,000 of ordinary income per year. Because of that, some investors look for those lots before year-end.
The right check happens at the lot level, not the position level. Open the tax-lot view in each taxable brokerage account, find lots where the current price is below your cost basis, and review the purchase date to see whether the lot is short-term or long-term. Short-term loss lots, held for one year or less, may be more useful because they may offset short-term gains taxed at ordinary income rates. Before selling anything, review all accounts you and your spouse control for any purchase of the same or a substantially identical fund within 30 days.
Some investors use the tax angle without drifting from their allocation. The choice is about which lot to sell, not whether the fund itself belongs in the portfolio. Some investors sell only when the tax value appears meaningful, the replacement still fits the allocation, and the wash-sale window appears clear.
Mezzi surfaces hidden loss lots across all connected accounts and flags wash-sale risk before you act. That lot-level view may reveal tax benefits that a headline performance screen may miss.
FAQs
How do I find losing tax lots in my account?
Look past your portfolio’s total return and check each purchase lot on its own. In your brokerage account, open the unrealized gains and losses report, then select the option to show lot details.
That view may show the purchase date, cost basis, and current performance for each lot. As a result, you may spot shares trading at a loss even if the full position is up overall.
Mezzi may also pull together these lot-level details across accounts and identify harvestable losses automatically.
Which tax-lot method gives me the most control?
Specific identification may give you the most control. It lets you choose the exact tax lots to sell based on each lot’s purchase date and price, instead of relying on FIFO or average cost.
That level of precision may make it easier to limit taxable gains or realize certain losses. It does require careful record-keeping, though. Mezzi is designed to automate lot-level tracking across your accounts.
Can a wash sale happen across my other accounts?
Yes. The IRS wash sale rule may apply across all accounts tied to your tax ID. That may include taxable brokerage accounts, IRAs, Roth IRAs, HSAs, and even a spouse’s accounts.
Here’s where it gets tricky: brokers often track wash sales only within each account. So they may not flag activity across firms or between account types.
Mezzi is designed to monitor substantially identical purchases across your full portfolio in real time.
Disclosures:
This content is for informational purposes only and does not constitute investment advice or a recommendation to buy or sell any security.
Past performance is not indicative of future results. No guarantee of future performance or outcomes is implied.
Savings and performance examples are hypothetical and for illustrative purposes only. Actual results will vary based on individual circumstances, portfolio composition, market conditions, and fees.