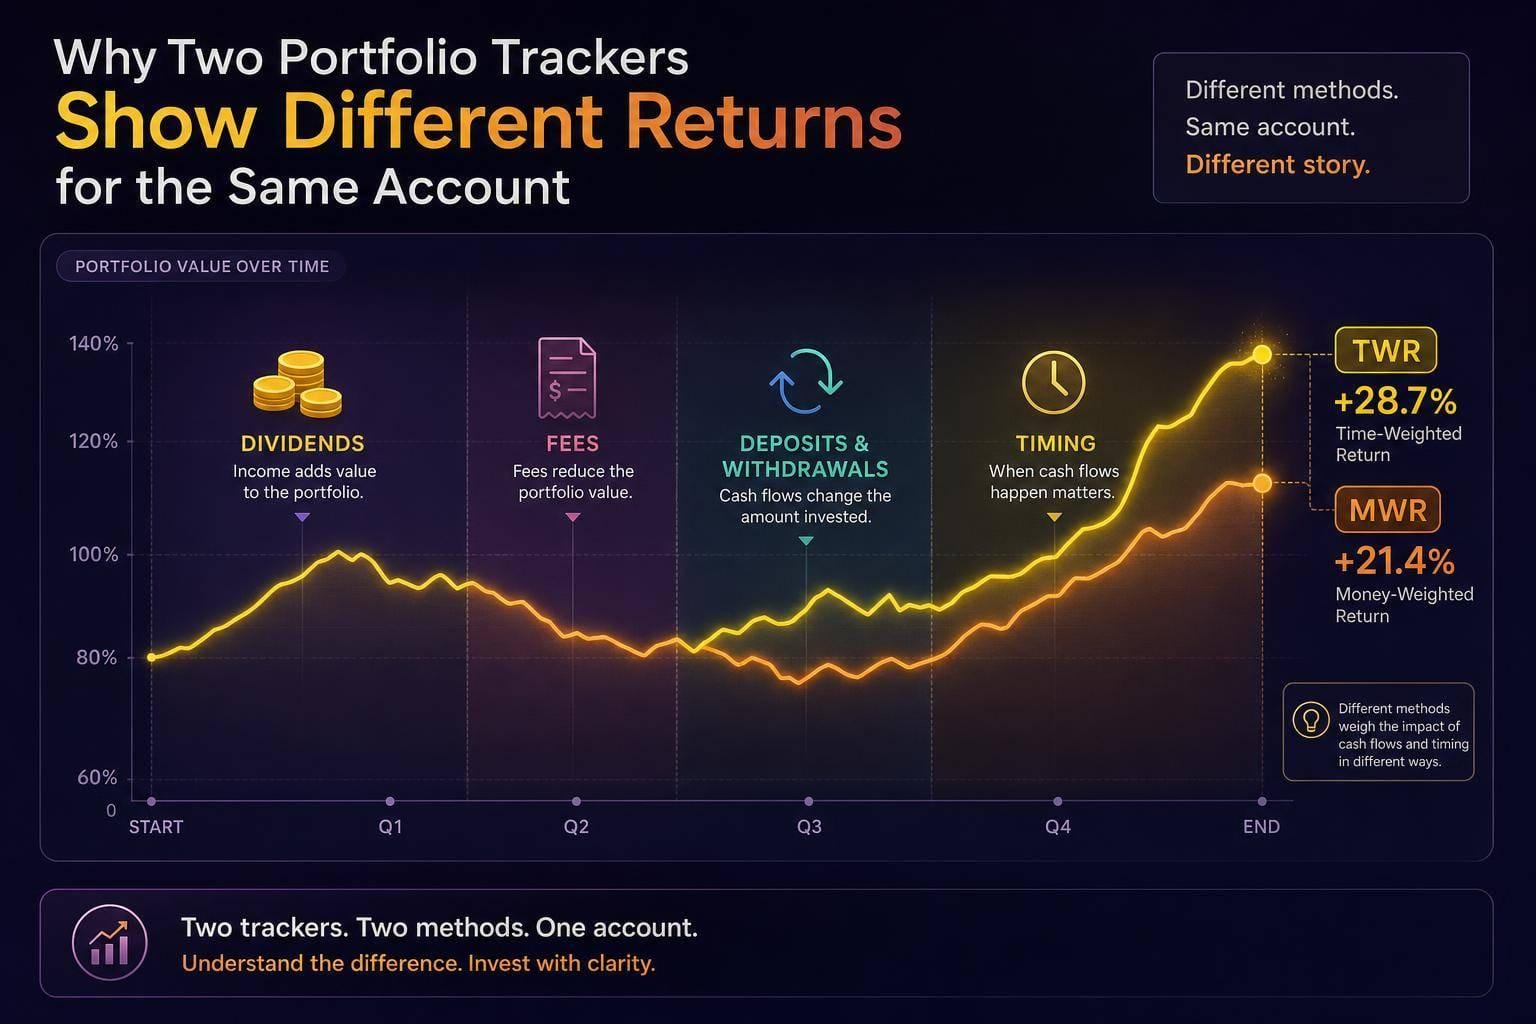
Yes - the same account may show two different returns, and both numbers may still be valid. In many cases, the gap may come from different math, different transaction data, or different timing.
Here’s the short version:
One tool may show time-weighted return (TWR), which may focus on portfolio performance and set aside deposit timing.
Another may show money-weighted return (MWR/IRR), which may reflect your personal result based on when money moved in or out.
A third tool may use Modified Dietz or another estimate if full daily data or cost basis is missing.
Some broker feeds may not send full cost basis data to outside apps.
Returns may also shift based on dividends, fees, transfers, and price timing.
Put another way: a 12% return in one app and a 9% return in another may point to a measurement gap, not a different investing outcome.
If I were checking a mismatch, I’d usually look at these items first:
Date range
Opening and closing balances
Deposits and withdrawals
Transfers
Dividend handling
Fee treatment
Price source and valuation time
Return method used
Portfolio Tracker in Excel, never trust your returns before checking these 4 cells
Quick Comparison
| Return type | What it may show | How cash flows affect it | Where it may appear |
|---|---|---|---|
| TWR | Portfolio performance | Low impact | Broker reports, manager reports, benchmark comparisons |
| MWR / IRR | Personal investing result | High impact | Personal finance apps, investor reports |
| Modified Dietz | Estimated return | Medium impact | Trackers with limited history or missing data |
The big idea is simple: before comparing returns, I’d match the method first, then the data. If one tool shows a period return and another shows all-time gain/loss, the numbers may look close while measuring two different things.
The main reason: different return calculation methods
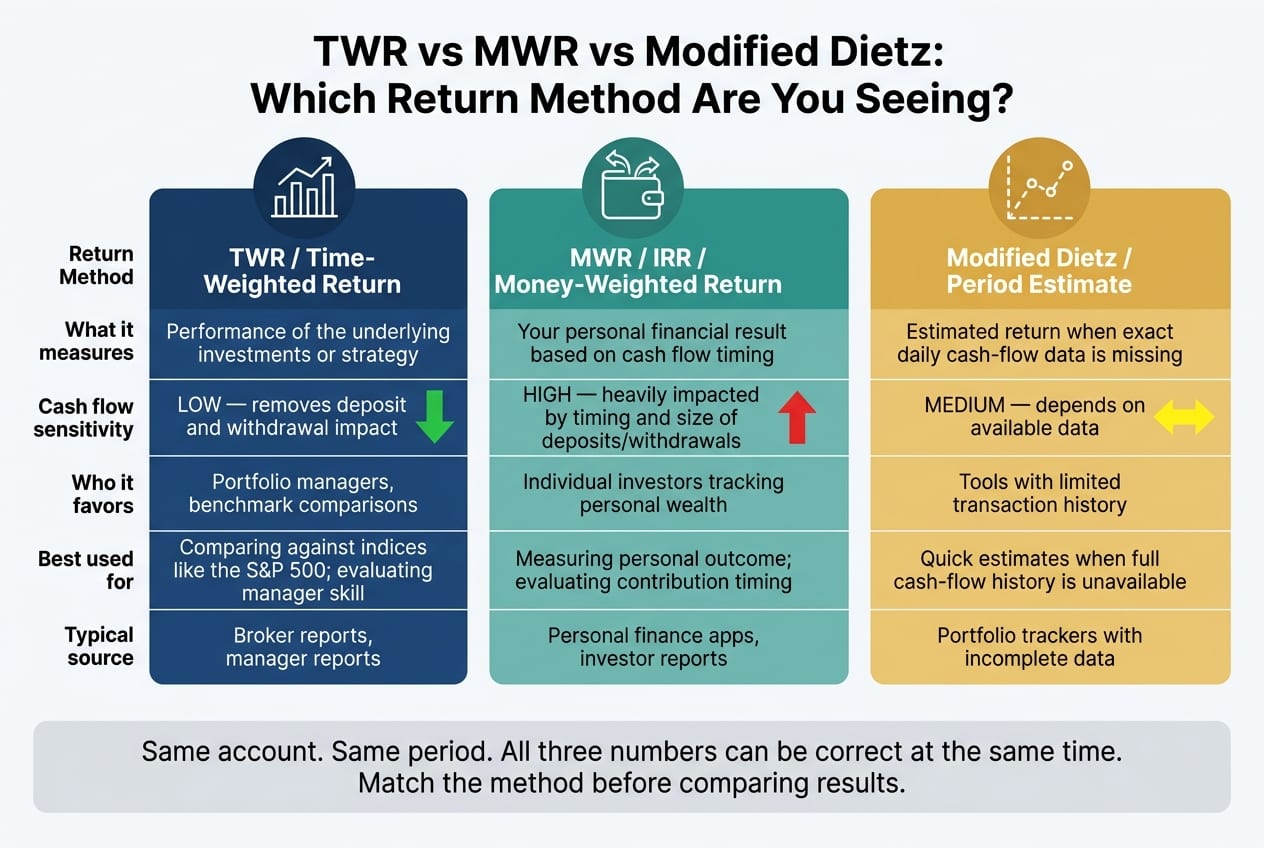
Two tools may read the same account and still show different returns because they use different formulas. Once you know which formula each tool uses, the next gaps usually come from how the tool handles cash flows, dividends, fees, and pricing.
Time-weighted return measures portfolio performance, not deposit timing
Time-weighted return (TWR) is built to remove the effect of deposits and withdrawals. It focuses on how the investments performed, no matter when money went in or out. Put simply, it grades the portfolio strategy, not your timing.
Say you invest $10,000 in January, add $50,000 in July, and the portfolio gains 20% and then 5%. TWR sets aside the July deposit and reports only the investment performance.
Money-weighted return measures your actual investing result
Money-weighted return, or IRR, takes a different path. It gives more weight to periods when more money was in the account. So if a big balance was in place during a strong stretch, MWR may look better. If that big balance sat through a weak stretch, MWR may look worse.
A large deposit after a decline may lift MWR even if the portfolio itself did not change.
Modified Dietz and other approximations can produce a third answer
Some tools use Modified Dietz or another estimate when exact daily cash-flow data is missing [3]. If the full transaction history is not available, the tool may rely on estimates instead of exact daily calculations.
| Metric | What It Measures | Sensitivity to Cash Flows | Best Use Case |
|---|---|---|---|
| Time-Weighted Return (TWR) | Performance of the underlying investments or strategy | Insensitive - removes deposit and withdrawal impact | Benchmarking against indices; evaluating manager skill |
| Money-Weighted Return (MWR/IRR) | Your personal financial result | Highly sensitive - impacted by the timing and size of cash flows | Tracking personal wealth growth; evaluating contribution timing |
| Modified Dietz / period estimates | Estimated returns when exact daily cash-flow data or cost basis is unavailable | Varies - depends on the data the tool has | Quick estimates when full cash-flow history is missing |
Both TWR and MWR may be correct at the same time [2].
How cash flows, dividends, fees, and pricing each change the number
Once the return method is set, the next gaps usually come from how each tool records the same activity. After the formula itself, transaction handling may be one of the main reasons two platforms show different results.
Deposits, withdrawals, and transfers are not always classified the same way
This may be one of the most common - and least obvious - reasons for a mismatch. When money moves between accounts, one tool may label it as new cash coming in, while another may record it as a neutral transfer. The account may have done the exact same thing either way, but the reported return may still change.
Timing matters too. If cash was added right before a strong market move, a money-weighted return may look better than a time-weighted return. And if transactions are missing or duplicated, the comparison may be off before the math even starts.[2]
The same kind of issue shows up with dividends and fees.
Dividend treatment and fee assumptions affect total return
Price return leaves out dividends. Total return adds them back in. For holdings that pay dividends, that difference may create a noticeable gap between tools.
Fees add another layer. One tool may show gross return and ignore fees. Another may subtract advisory fees or fund expense ratios and show net return instead. Neither approach may be wrong. They may just answer different questions.
Gross return leaves out fees
Net return subtracts fees
Pricing source and valuation time create small but real gaps
Valuation timing is the last source of drift. If one tool uses intraday prices and another uses end-of-day pricing, the reported portfolio value - and the return tied to it - may differ a bit. Those gaps may look small, but they’re still real. End-of-day pricing may be more stable for mutual funds.
Here’s how these differences may change the number:
| Factor | Treatment A | Treatment B | Likely Effect on Reported Return |
|---|---|---|---|
| Internal transfer | Classified as new cash | Classified as neutral transfer | Reported return may look lower because cash inflows are counted differently |
| Cash-flow timing | Time-weighted return (TWR) | Money-weighted return (IRR) | IRR may look higher if cash is added right before a rally |
| Dividends | Price return only | Total return (price + dividends) | Treatment B may report a higher return |
| Fees | Gross return (fees ignored) | Net return (fees subtracted) | Treatment A may report a higher return because costs are left out |
| Valuation timing | Intraday pricing | End-of-day (EOD) pricing | Small differences may appear and may change until the market closes |
Before comparing performance, it may help to check the transaction list, dividend treatment, and pricing source.
How to reconcile conflicting returns, step by step
Use this checklist to figure out whether the mismatch may come from data, classification, or method. When two tools show different numbers for the same account, the gap may be a measurement issue rather than a performance issue.
Start with the date range, opening and closing balances, and transaction history
First, make sure both tools use the same date range, opening balance, closing balance, and transaction history. This sounds basic, but it often explains the whole problem.
One tool may show a period return. Another may show an all-time gain/loss based on cost basis. Those numbers may look similar at first glance, but they may measure different things.
If the window matches, move to transaction classification next.
Check for missing or miscategorized transactions
Once the date range lines up, look for missing or miscategorized deposits, withdrawals, dividends, transfers, or fees. A single entry in the wrong bucket may change the result more than people expect.
Also check whether one tool breaks ETF holdings into underlying positions while the other treats the ETF as a single line item [1][2].
If the transaction list looks clean, compare the same return method in both tools.
Match the calculation method before comparing results
If the date range and transaction history match but the numbers still differ, compare like with like: time-weighted return (TWR) to TWR, or money-weighted return (MWR) to MWR. Don't mix methods.
Which return number to use for each decision
Once you know why the numbers differ, the next step is picking the right one for the decision in front of you.
Use TWR to evaluate portfolio performance
Use TWR to compare strategy performance and benchmark returns because it removes the effect of deposits and withdrawals. If two tools disagree on performance against a benchmark like the S&P 500, TWR may be the cleaner number to use. That may make it the better choice when two tools show different performance results.
Use MWR to measure your personal result
The choice depends on whether you're judging the portfolio or judging your own investing outcome.
Use MWR to measure your personal result because it shows how the timing and size of your cash flows affected the account. If you added a large lump sum right before a market drop, MWR may show that effect. That may make it the better choice when deposits or withdrawals changed the result.
The same account can produce more than one valid return
After matching the method, check whether the tools are also using the same dates, cash flows, dividends, fees, and pricing.
The same account may produce different valid returns because tools use different methods and inputs. Compare period return with period return, and lifetime profit/loss with lifetime profit/loss. Most mismatches may come from method, data, or timing. Use TWR for portfolio performance, MWR for personal outcome, and reconcile any mismatch before comparing them [1].
FAQs
Which return method should I trust?
It depends on what you want to measure.
Use Time-Weighted Return (TWR) when you want to judge your investment picks without the effect of deposits and withdrawals. TWR strips out cash-flow timing, so it may give you a cleaner read on how the investments themselves performed.
Use IRR (money-weighted return) when you want to reflect your personal result, including when money went in and out. Since cash-flow timing stays in the math, IRR may line up more closely with what you actually experienced.
For a simple snapshot of portfolio growth that includes capital gains and dividends, use total return.
Why do dividends and fees change my return?
Dividends and fees may change your return because they directly affect the cash added to, or taken from, your portfolio.
Dividends may be included in performance, and reinvested dividends may be treated like additional buys. Fees and expense ratios, on the other hand, may reduce net growth.
Results may also differ if a tracker uses a different return method. The same thing may happen if it misses dividend or fee transactions, or records them late because of sync gaps or incorrect transaction mapping.
How do I fix mismatched portfolio returns?
Start by reconciling the underlying data across your accounts. Check cash balances, share quantities, dividends, and transactions, and look for duplicate or missing entries. For more complex events, like stock splits or dividend reinvestments, a manual review may make sense. In those cases, your financial institution’s statements may serve as the source of truth.
Then re-sync your accounts. If differences still remain, compare the return methods being used, how cost basis is treated, and whether fees and contributions are included the same way across each account.
Disclosures:
This content is for informational purposes only and does not constitute investment advice or a recommendation to buy or sell any security.
Past performance is not indicative of future results. No guarantee of future performance or outcomes is implied.
Savings and performance examples are hypothetical and for illustrative purposes only. Actual results will vary based on individual circumstances, portfolio composition, market conditions, and fees.