
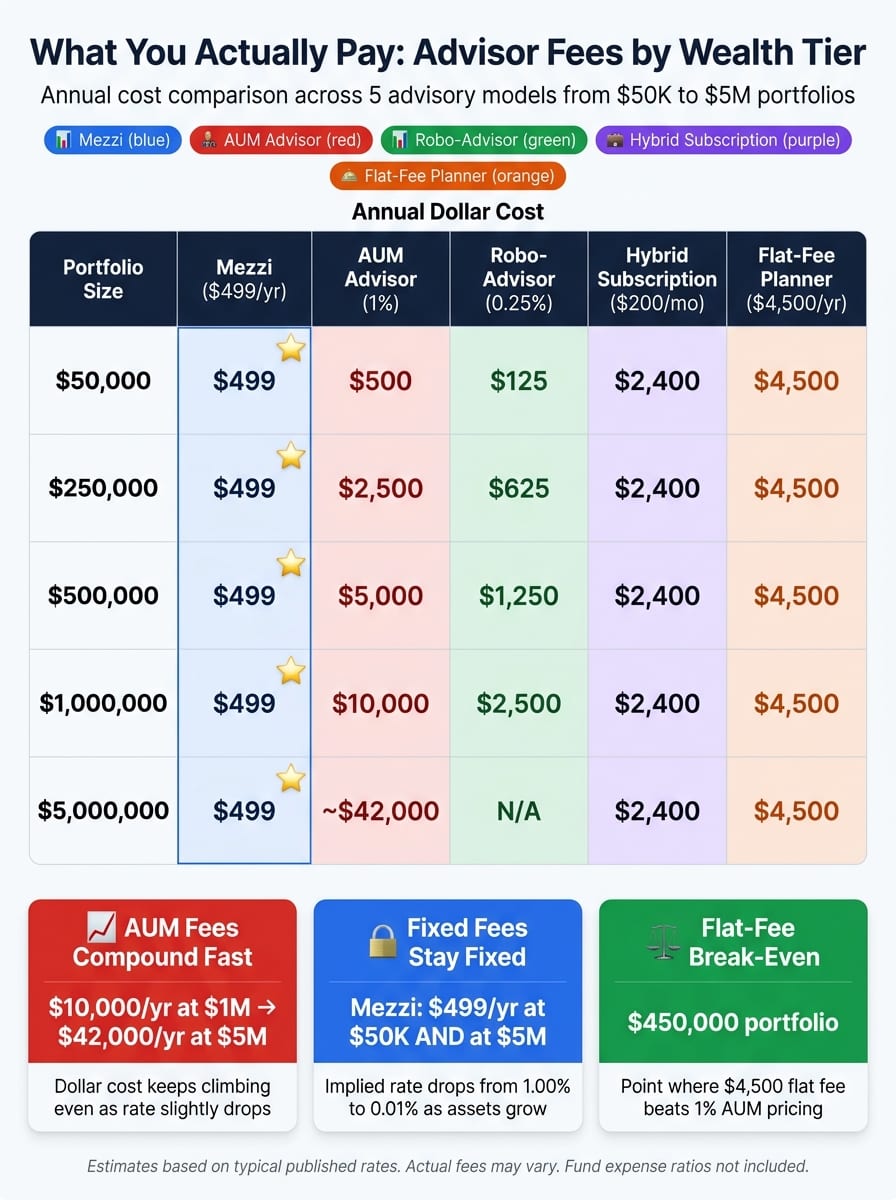
A fee that looks small in percentage terms may turn into a very large dollar cost as assets grow. In this piece, I compare five advice models - Mezzi, AUM advisors, robo-advisors, hybrid subscription firms, and flat-fee planners - across portfolio sizes from $50,000 to $5,000,000.
Here’s the short version:
A 1.00% AUM fee may mean about $500 on $50,000, $10,000 on $1,000,000, and roughly $35,000 to $42,000 on $5,000,000.
A robo-advisor at 0.25% may look low in dollar terms at small balances, but the bill may still move into the thousands at higher balances.
A flat annual fee or monthly subscription may look expensive on a small portfolio, then look much lower as assets grow.
Mezzi’s fixed fees - $299, $499, or $1,499 per year - don’t change with account size, so the implied rate may drop a lot as portfolio value rises.
Advisory fees are only part of the picture. Fund costs may add about 0.15% to 0.25% for many index-based portfolios.
If you want a simple way to read the data, here it is: smaller portfolios may lean toward low-cost AI financial advisors, while larger portfolios may make fixed-fee pricing look far cheaper than asset-based pricing. The tradeoff often comes down to price versus depth of service.
Are 1% Financial Advisor Fees Worth It? The REAL Impact on Retirement
Quick Comparison
| Model | How pricing works | Lower-balance effect | Higher-balance effect | Best match mentioned in the article |
|---|---|---|---|---|
| Mezzi | Fixed annual fee | May look high as a % on small accounts | May look very low as a % on large accounts | Self-directed investors |
| AUM advisor | % of assets | May start near 1.00%+ | Dollar fee may keep climbing even if rate drops | Households with more involved needs |
| Robo-advisor | Low % of assets | May stay in low hundreds | May rise into the thousands | Simpler portfolios, often under $250,000 |
| Hybrid subscription | Monthly or annual fee, sometimes plus AUM | May look heavy on small balances | May look much lower on large balances | Mid-career households wanting regular planner access |
| Flat-fee planner | Fixed project or annual fee | May be pricey as a % at low balances | May become cheaper than 1% AUM past a break-even point | DIY households wanting a plan |
I wrote this to make one point plain: the same advice bill may feel minor or massive depending on your wealth tier and fee model.
1. Mezzi

Mezzi is an SEC-registered fiduciary advice platform with a flat annual fee. That fee stays the same no matter how much you have invested. So the main point isn't only the dollar amount. It's also the implied percentage at each portfolio level.
Its three plans - $299/year (Core), $499/year (Plus), and $1,499/year (White Glove) - don't increase as assets grow.
| Portfolio Size | $299 Plan | $499 Plan | $1,499 Plan | Traditional AUM Advisor |
|---|---|---|---|---|
| $50,000 | 0.60% | 1.00% | 2.998% | 1.00% ($500) |
| $250,000 | 0.12% | 0.20% | 0.60% | 1.00% ($2,500) |
| $500,000 | 0.06% | 0.10% | 0.30% | 1.00% ($5,000) |
| $1,000,000 | 0.03% | 0.05% | 0.15% | 1.00% ($10,000) |
| $5,000,000 | 0.006% | 0.01% | 0.03% | 0.84% (~$42,000) |
As assets rise, the implied rate drops fast. At $50,000, a flat fee may look close to - or even above - a percentage-based model, depending on the plan. At $1,000,000 or $5,000,000, the gap may look much larger.
The next comparison shows the flip side of that setup: under percentage-based pricing, costs may climb as account size grows.
Mezzi connects on a read-only basis to 401(k), brokerage, Roth IRA, and taxable accounts. It doesn't trade, move, or hold your money. Instead, it points out things like:
tax-loss harvesting openings
wash sale risk across accounts
rebalancing guidance
asset-location guidance
You decide whether to act, when to act, and how to do it.
This setup may appeal to households that prefer to manage their own portfolios but still want fiduciary advice without an asset-based fee. That contrast leads into the next section's AUM pricing model.
2. Traditional AUM Advisor
With a flat fee, the price stays the same. With AUM pricing, the fee may rise as your assets rise.
That’s because you pay a percentage of the money being managed each year. So even if the rate drops at higher balance tiers, the dollar fee may still keep going up. As of 2024, 86% of advisory firms use this as their main pricing method for advice [1].
Many firms use a tiered schedule; the ranges below are illustrative. In plain English: larger portfolios may get a slightly lower percentage, but not a lower bill.
| Portfolio Size | Typical Fee % | Annual Dollar Fee |
|---|---|---|
| $50,000 | 1.00%–1.25% | $500–$625 |
| $250,000 | 1.00% | $2,500 |
| $500,000 | 1.00% | $5,000 |
| $1,000,000 | 1.00% | $10,000 |
| $2,000,000 | 0.875%–0.90% | $17,500–$18,000 |
| $5,000,000 | 0.70%–0.84% | $35,000–$42,000 |
You can see the pattern pretty fast. A household with $500,000 may pay about $5,000 per year. At $1,000,000, that may become $10,000. Same general setup, much larger bill.
That gap may matter more over long periods. In a hypothetical example at $1,000,000, a 1% fee may reduce a 7% gross return to 6%. Over 30 years, that may reduce ending wealth by nearly $1.87 million.
This setup may make sense for households that want broad, hands-off support and want that fee to cover things like:
Withdrawal strategy
Estate coordination
Behavioral coaching
For others, the key issue may be simpler: does the bundle inside that percentage line up with what they’re actually looking for?
3. Robo-Advisor
Robo-advisors usually charge about 0.25%–0.40% per year, and 0.25% works as a useful benchmark because it sits near the middle of common pricing. With smaller balances, the dollar cost may stay fairly modest. With larger balances, the gap versus flat-fee pricing may grow.
Here’s what that may look like at a 0.25% platform fee, with an all-in estimate of 0.33% once ETF costs are included:
| Portfolio Size | Platform Fee (0.25%) | All-In Est. (0.33% w/ ETFs) |
|---|---|---|
| $50,000 | $125/year | $165/year |
| $250,000 | $625/year | $825/year |
| $500,000 | $1,250/year | $1,650/year |
| $1,000,000 | $2,500/year | $3,300/year |
ETF expense ratios may add another 0.05%–0.15% per year. For households under $250,000, the annual bill may stay in the low hundreds. At $1,000,000, it may move into the thousands.
The main issue isn’t only price. It’s whether the automation covers enough of what a household may need. Even a small fee may compound over time: over 30 years, a 0.25% fee may still reduce ending wealth, while a 1.00% fee may reduce it by much more.
This model usually stands out on cost, not on planning depth. It may fit households with about $10,000–$250,000 that want automated, diversified investing with built-in rebalancing and tax-loss harvesting. It may fall short when planning needs get more involved.
That sets up a middle ground between asset-based pricing and fixed annual advice.
That leads into hybrid subscription pricing.
4. Hybrid Subscription Advisor
A hybrid subscription advisor charges a recurring fee for ongoing planning, and some firms may also add a small asset-based fee for investment management.[4][5] In practice, that fee may cover portfolio management, retirement projections, tax strategy, and periodic check-ins with an advisor. Pricing often varies more by complexity, income, or net worth than by the amount invested.
Many hybrid firms use tiered pricing. Entry-level tiers often run $75–$150/month ($900–$1,800/year), mid-tier plans may land around $150–$250/month ($1,800–$3,000/year), and higher tiers for more involved situations may go up to $400/month ($4,800/year).[2][3]
Here’s how those dollar costs may translate into effective percentages across wealth tiers, using a $200/month ($2,400/year) mid-range example:
| Portfolio Size | Annual Fee | Effective % of Assets | vs. 1% AUM Benchmark |
|---|---|---|---|
| $50,000 | $2,400 | 4.80% | Far above 1% |
| $250,000 | $2,400 | 0.96% | About 1% |
| $500,000 | $2,400 | 0.48% | Below 1% |
| $1,000,000 | $2,400 | 0.24% | Well below 1% |
| $5,000,000 | $2,400 | 0.048% | Much lower |
Put simply, the same flat subscription may feel heavy at lower account balances and may look much more efficient as assets rise. That’s why this setup may sit in the middle: more ongoing than one-time planning, but not tied as tightly to AUM pricing.
This model may fit households with more involved planning needs, such as equity compensation, student loans, or tax coordination, but that may not want AUM pricing. The next model removes recurring pricing altogether.
5. Flat-Fee Financial Planner
With lower balances, a fixed annual fee may take up a bigger share of assets. As balances grow, that effective rate may drop fast.
For illustration, this comparison assumes annual fees ranging from $2,500 to $9,200, with a median of about $4,500 per year. Here’s how that may look across common portfolio sizes:
| Portfolio Size | Flat Fee (Annual) | Effective Rate | Traditional AUM (1%) |
|---|---|---|---|
| $100,000 | $4,500 | 4.50% | $1,000 |
| $250,000 | $4,500 | 1.80% | $2,500 |
| $500,000 | $4,500 | 0.90% | $5,000 |
| $1,000,000 | $4,500 | 0.45% | $10,000 |
| $2,000,000 | $4,500 | 0.225% | $20,000 |
The next step is the break-even point. That’s the portfolio size where a flat fee may cost less than a 1% AUM charge.
At the median $4,500 fee, flat-fee planning may become cheaper than a 1% AUM model once a portfolio goes above $450,000. At $2,500, the break-even point may be $250,000. At $9,200, it may be $920,000.
Below those thresholds, the flat fee may be less cost-efficient. Above them, the fixed fee may become cheaper over time.
This setup may fit:
Larger portfolios
More involved planning needs
Households that prefer fixed costs
It may be less efficient for smaller accounts.
Those crossover points shape the wealth-tier tradeoffs in the next section.
Pros and Cons by Household Wealth Tier
Each model may have a break-even range where its pricing makes more sense.
| Advisory Model | Best Fit | Pros | Cons | Sweet Spot |
|---|---|---|---|---|
| Mezzi | Self-directed investors | Fixed low cost; tax optimization guidance | No human judgment for complex legal or business-sale events | $100,000 to $5M+ |
| Traditional AUM | Complex estates; high-touch needs | Bundled tax, estate, and behavioral coaching | High absolute dollar cost; potential conflicts of interest | $1M+ for genuine complexity |
| Robo-Advisor | Simple, early-stage portfolios | Lowest cost for automated rebalancing | Limited nuance for complex tax or life situations | Under $250,000 |
| Flat-Fee Planner | DIYers seeking a one-time roadmap | Predictable fixed cost regardless of portfolio size | Expensive as a percentage for smaller accounts; no ongoing monitoring | Around $500,000+ |
| Hybrid/Subscription | Mid-career professionals | Predictable cost with occasional human access | May layer AUM fees on top of subscription charges | $100,000 to $500,000 |
The table lays out the pattern. The examples below show where fee efficiency may flip.
Here’s the basic idea: as portfolios get larger, the math may change. A traditional AUM advisor charging 1% would cost $10,000 per year on a $1,000,000 portfolio. That may create a meaningful fee drag if the service goes beyond what someone needs.
Mezzi uses fixed annual pricing, so the implied percentage may shrink as assets grow. That may appeal to investors who want ongoing portfolio guidance without a fee tied directly to account size. The same cost picture may look very different under asset-based pricing.
Flat-fee planning may also look better as assets rise, especially once a portfolio moves into the mid-six figures. For people who want a one-time plan instead of steady monitoring, that setup may be a better fit.
That leaves one main question: what level of advice may match the assets you have?
Conclusion
Across the $50,000 to $5,000,000 range, fee structure may matter as much as fee rate. A 1% AUM fee on a $1,000,000 portfolio may cost $10,000 per year, and that cost may add up over time. By contrast, a $499 flat fee stays at $499 per year, which may make it easier to estimate as assets grow.
That’s why the same advisory price may look expensive at one wealth tier and efficient at another.
Before deciding whether your costs may be high, fair, or open to negotiation, add advisory fees and fund expense ratios to estimate your all-in cost. Then compare that total with your portfolio size and the planning needs you may actually have. The goal may be to match the fee structure with your wealth tier and the level of advice you use.
FAQs
How do I calculate my all-in advisory cost?
Add your advisor’s main fee to indirect costs like fund expense ratios, trading commissions, platform or overlay fees, and custodial charges. Core fees may be based on AUM, hourly billing at $200–$400, flat project fees of $2,750–$3,500, or annual retainers of $2,500–$9,200.
Then divide your total annual dollar cost by your portfolio value to find your effective fee.
For fee details, some people review Form ADV or Form CRS. To estimate the long-term effect of fees, you may use:
Final Value = Initial Investment × (1 + Annual Return - Annual Fee)^Years
When does a fixed fee become cheaper than a percentage fee?
A fixed fee may be cheaper when its annual dollar cost is lower than the annual cost of a percentage-based fee.
Why? Because percentage fees usually rise as portfolio value rises. So as assets grow, a fixed fee may look cheaper by comparison.
For example, a $6,000 flat fee on a $1,000,000 portfolio works out to 0.60%. A 1% AUM fee on that same portfolio would be $10,000.
A simple way to compare the two: divide the fixed fee by your portfolio size.
How much do fees reduce long-term returns?
Fees may create a compounding drag on wealth because they reduce yearly returns and leave less money in the account to compound over time. That’s the double hit.
A 1% annual AUM fee may reduce a portfolio’s ending value by about 25% over 30 years.
Here’s a simple hypothetical example. A $500,000 portfolio growing at 7% may end up with about $560,000 less over 25 years if that fee applies. So even what looks like a small gap in fees may add up to hundreds of thousands of dollars over time.
Disclosures:
This content is for informational purposes only and does not constitute investment advice or a recommendation to buy or sell any security.
Past performance is not indicative of future results. No guarantee of future performance or outcomes is implied.
Registration does not imply a certain level of skill or that the SEC has approved the company or its services.
Savings and performance examples are hypothetical and for illustrative purposes only. Actual results will vary based on individual circumstances, portfolio composition, market conditions, and fees.