
A household with $1 million to $5 million may look diversified on paper but still have hidden overlap. From what I see in the article, this tier often sits between early wealth-building and high-net-worth investing strategies, with money spread across public stocks, bonds, cash, real estate, retirement accounts, and sometimes business interests.
Here’s the short version:
Below $1 million: net worth may lean more on home equity, cash, and retirement accounts
$1 million to $5 million: wealth may shift toward a more layered mix of investable assets, but concentration and tax placement may still be easy to miss
Above $5 million: portfolios may include more private assets, trusts, entities, and longer lockups
For the $1 million to $5 million group, the main pattern in the third-party sources cited below may be:
20%–30% public equities
15%–25% fixed income
20%–25% cash
15%–20% real estate
5%–15% alternatives
What stands out most? More accounts do not always mean more diversification. A household may hold the same stock exposure across a 401(k), IRA, Roth IRA, HSA, taxable brokerage account, and employer stock plan without seeing the full picture.
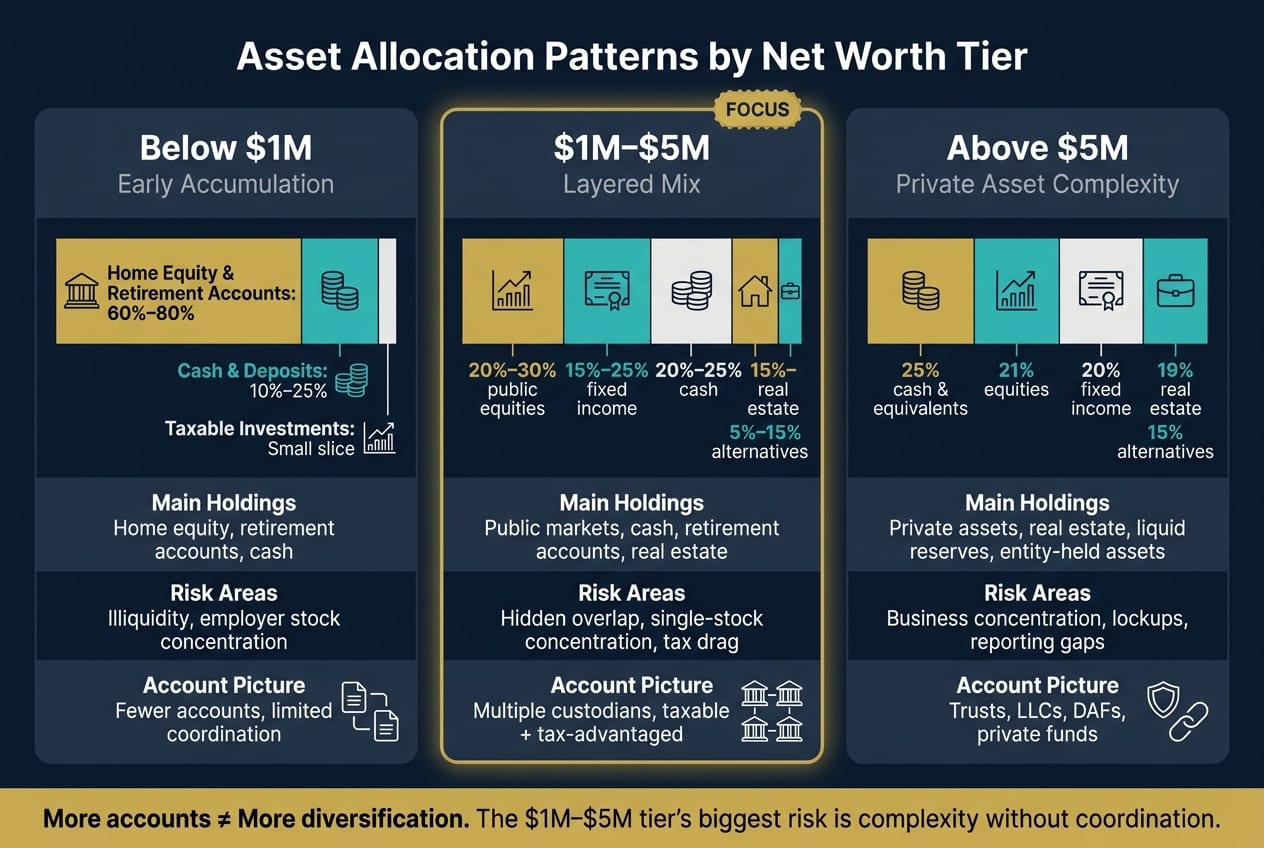
Quick Comparison
| Net-worth tier | What it may own most | Main risk areas | Common account picture |
|---|---|---|---|
| Below $1M | Home equity, retirement accounts, cash | Illiquidity, employer stock, limited taxable investing | Fewer accounts, less household-level coordination |
| $1M–$5M | Public markets, cash, retirement accounts, real estate | Overlap, single-stock concentration, tax drag | Multiple custodians, taxable + tax-advantaged accounts |
| Above $5M | Private assets, real estate, liquid reserves, entity-held assets | Private-business concentration, lockups, reporting gaps | Trusts, LLCs, DAFs, retirement accounts, private funds |
If I boil the article down to one idea, it’s this: the issue for the $1 million to $5 million tier may be less about owning the wrong assets and more about not seeing how all the pieces fit together.
1. Below $1M Net Worth
Asset Mix
Below $1 million, net worth may be concentrated in home equity and retirement accounts. Federal Reserve Survey of Consumer Finances data suggest that, in this tier, real estate and vehicles make up most total assets, while stocks, bonds, and business interests may play a much smaller role.[2][3] Within financial assets, cash and bank deposits may come first, retirement accounts may come second, and taxable brokerage accounts may remain a distant third.
An illustrative profile may look like this:
60% to 80% in home equity and retirement accounts
10% to 25% in cash and deposits
A small slice in taxable investments
The "Mass Affluent" segment ($100K–$1M in assets), which overlaps heavily with sub-$1M net-worth families, holds roughly 70% of assets in market-linked investments and about 30% in deposits.[5] Meaningful private investments and alternatives are usually absent. That setup may shift fast as net worth moves closer to $1 million.
Compared with the next tier, this group may still lean more on residence value and retirement savings than on a more balanced taxable portfolio.
Liquidity and Concentration
That mix may create a trade-off: the balance sheet may appear sizable, but much of it may be illiquid or concentrated. A large share of net worth may sit in home equity and retirement accounts that may not be easy or cheap to access before retirement age. So wealth may look strong on paper while staying harder to use in practice.
Concentration risk may also show up inside retirement plans. Employer stock may add another layer of exposure - roughly 22% of employee shareholders hold more than 50% of their savings and investments in company stock.[6] In that case, both human capital and portfolio risk may be tied to the same company-specific shock.
Tax Location
Tax location may often be incidental rather than planned. A bigger issue may be unused tax-advantaged account space: only about 60% of U.S. adults hold a tax-preferred retirement account at all.[7] Among lower-income households, IRA ownership drops to roughly 8.8%, compared with 63% for high-income earners.[8]
Portfolio Complexity
The account mix may be fairly modest, but old 401(k)s and scattered balances may still make the full picture easy to miss. Without a unified view, rebalancing may happen less often, and allocations may drift over time. That drift may add risk and may be associated with weaker returns.
Once net worth crosses $1 million, taxable brokerage balances, better diversification, and more intentional asset location may become more common. At the $1M–$5M level, the same accounts may still be in play, but the portfolio may become larger, more layered, and harder to manage without a consolidated view.
2. $1M–$5M Net Worth
Asset Mix
Crossing $1 million often changes the shape of a household balance sheet. Wealth may start to move away from a setup led by home equity and retirement accounts into something more layered. Compared with households below $1 million, this group tends to hold less of its wealth in home equity and more in investable assets.
Around the $1M–$2M range, one common pattern looks like this: about 39% in housing, 33% in retirement accounts, and 17% in liquid assets, with only a small share in business equity. As net worth gets closer to $5 million, housing may drop into the low-20% range, while liquid assets and business interests start to show up more often.[4][14]
A common investable mix may include:
20%–30% public equities
15%–25% fixed income
20%–25% cash
15%–20% real estate
Households near $1 million may stay closer to public markets. Households near $5 million may lean more into private assets.[11][12]
That broader mix may spread risk across more asset types. At the same time, it may make concentration and tax location more important.
Liquidity and Concentration
A more mixed balance sheet does not mean concentration risk goes away. Liquidity may improve, but a large share of wealth may still sit in home equity, retirement accounts, or a private business. In broader $1M–$10M household breakdowns, business interests may account for 20%–40% of total net worth, and one weak asset may pull on a large share of household wealth.[15][16]
Employer stock may add another layer of concentration. In that case, a household may have exposure to the same company through both compensation and investments. Any single exposure above 20%–30% of total wealth may call for a plan to bring that share down over time.[11][12] Once that issue shows up, asset location often becomes the next part of the puzzle.
Tax Location
When taxable brokerage accounts, retirement accounts, and private assets all sit side by side, where each asset sits may matter as much as what it is. Empower data show that households with $1M–$5M in wealth hold a median of 63% of net worth in retirement accounts during their 60s, and more than 54% on average across all age groups. That sits well above the general population median of about 27%.[17]
Some investors place high-yield bonds and REITs in 401(k)s and IRAs when possible, while broad equity index funds may fit better in taxable accounts. HSAs and 529s also appear to be underused.[1][12] When assets end up in the wrong account type across several accounts, tax drag may build over time.
Portfolio Complexity
By $2M–$5M, households often manage several accounts across different custodians, each with its own allocation and tax treatment.[4][1] Without one consolidated view, holdings may overlap, allocations may drift, and tax decisions may get made account by account instead of at the household level.
A unified, AI-driven view of all accounts may help surface the full household picture across allocation, liquidity, and tax efficiency.
3. Above $5M Net Worth
Asset Mix
Above $5 million, the conversation may shift from basic diversification to a high-net-worth financial planning strategy involving private assets, liquidity, and entity structure. The balance sheet often looks different at this stage: housing may account for about 23% of net worth, liquid assets may rise to roughly 24%, and business equity may make up around 14%.[25]
Portfolios at this level also tend to look less public-market heavy. One representative mix includes 25% cash and equivalents, 21% equities, 20% fixed income, 19% real estate, and 15% alternatives.[19] Practitioner data for ultra-high-net-worth households points to an even broader range, with 30%–50% in equities, 15%–25% in private equity and venture capital, and 10%–20% in real estate.[21]
Compared with the $1M–$5M tier, one big difference may be access. Households above $5 million are more likely to meet the higher minimums tied to institutional private equity funds, and they may be better positioned to accept capital lockups that last 7–10+ years.
Liquidity and Concentration
More wealth doesn’t make concentration risk disappear. It may just show up in a different place.
As a general illustration, for entrepreneurs, 50%–60% of net worth may sit inside a single private business. For corporate executives, 30%–40% may be tied to employer stock, RSUs, and options. And even when money is spread across several private funds, sector overlap may still pile up.
On the liquidity side, some households in this tier hold 12–24 months of core living expenses in cash-like instruments. That may support lifestyle spending and potential capital calls. Research also suggests that the share kept in cash may stay fairly steady across wealth levels, even if the vehicles change toward higher-yield options like money market funds and short-duration Treasuries.[14]
Tax Location
Beyond standard account types, this tier often brings in FLPs, LLCs, trusts, DAFs, and CRTs.[22][20] In some cases, DAFs and CRTs may be used to donate appreciated stock, trim concentrated positions, and offset income in high-tax years.
Roth conversions during lower-income years are also common. For some households, that approach may reduce future required minimum distributions and add tax-free assets for heirs.
Portfolio Complexity
Above $5 million, portfolios often stretch across multiple custodians, old retirement plans, trust accounts, LLCs that hold real estate, and commitments to several private funds. Each piece may come with its own reporting calendar and valuation timeline. Private investments and real estate also may not update often, which can make total allocation harder to track in real time.[22][24][23]
That’s where things can get messy. A missed capital call, an overlooked RMD, or an expired option window may become more likely when no single view ties the household balance sheet together.
A unified, AI-driven platform that consolidates accounts, entities, and asset classes may make those gaps easier to spot. It may surface hidden overlap, flag concentration thresholds, and line up tax and risk decisions across the full household balance sheet.
That shift sets up the next question: where the $1M–$5M tier may get the structure right, and where it may still fall short.
Where the $1M–$5M Tier Gets It Right and Where It Falls Short
The $1M–$5M tier may often get diversification and liquidity right. But hidden overlap, concentrated positions, and misplaced assets may still reduce efficiency. Compared with households below $1 million, this tier often has enough moving parts to call for household-level oversight, but not enough scale to shrug off concentration or tax location issues.
On a broad balance sheet, this tier often holds a mix of public markets, home equity, business interests, and cash. At first glance, that may look balanced. The catch? A portfolio may seem spread out on paper while still carrying the same risks again and again.
| Criterion | Common Strengths | Common Blind Spots | Specific Actions to Consider |
|---|---|---|---|
| Asset Mix | Broad exposure across equities, bonds, and cash; meaningful diversification across account types | Real estate or employer stock concentration; ETFs and funds that own many of the same stocks | Use Mezzi's X-Ray tool to surface hidden overlap across funds; review whether any single position or asset class may be creating concentration risk |
| Liquidity & Concentration | Cash buffers and short-term bonds may reduce volatility; roughly 17% of investable assets kept in short-term instruments for immediate access [26][27] | Idle cash that may exceed near-term needs; correlated risks such as employer stock plus job income from the same company often go untracked | Connect all accounts in Mezzi to flag employer, sector, or single-position concentration |
| Tax Location | Retirement accounts (401(k), IRA) are generally funded; some Roth contributions in place | REITs and taxable bond funds held in taxable accounts; wash sale risk across separate brokerage accounts | Use Mezzi's tax optimization guidance to identify misplaced assets and tax-loss harvesting opportunities; watch the 30-day wash sale window across all connected accounts |
| Operational Complexity | Multiple account types reflect deliberate planning (401(k), Roth IRA, taxable, HSA, 529) | No single view ties it together; allocation drift, missed rebalancing signals, and overlapping fund exposure may be easy to miss across multiple accounts | Connect all accounts to Mezzi for a unified household view; review total allocation across custodians on a regular schedule rather than account by account |
The main gap may be visibility, not effort. A household may own the same stocks in a taxable account, a 401(k), and a Roth IRA without noticing the overlap. On paper, that may look like diversification. In practice, it may be concentration hiding in plain sight.
Those tradeoffs shape the upside and the weak spots of this tier.
Pros and Cons of the $1M–$5M Allocation Profile
The $1M–$5M tier usually holds a mix of public equities, fixed income, cash, real estate, and tax-advantaged accounts. Compared with sub-$1M households, this setup may be more diversified, but it may still carry overlap, concentration, and tax drag. So the tradeoff looks pretty simple: more flexibility, more moving parts.
At this level, a household may have enough complexity for tactics like Roth conversions, asset location, and tax-loss harvesting to become more relevant.
The most common blind spots may be fund duplication and employer-stock concentration. A household might hold a U.S. total market index fund in an old 401(k), an S&P 500 fund in a current 401(k), an actively managed large-cap blend in an IRA, and a broad-market ETF in a taxable account. On paper, that may look diversified. In practice, it may create heavy overlap in the same large-cap names.
For tech, healthcare, and finance professionals who receive RSUs or ESPP shares, 20%–50% of investable assets may sit in a single stock.[28][29] When accounts are spread across different custodians, that risk may be much harder to spot.
A few patterns show up again and again:
Asset mix: Households may have broad exposure across public equities, bonds, real estate, and several account types, but fund overlap may hide true concentration.
Concentration: Employer stock and correlated sector exposure may be the most common single-position risks, and they often go untracked across separate accounts.
Tax efficiency: Bonds and REITs in taxable accounts, wash-sale risk across separate brokerages, and underused HSAs and 529s may be recurring gaps.
The key question may not be whether the portfolio looks diversified. It may be whether all the pieces work together.
For this tier, the main issue may be coordination. The assets themselves may be sound, but the household-level view may be incomplete.
Conclusion
The $1M–$5M tier sits in an in-between stage: past early accumulation, but usually not deep into private-asset-heavy wealth. Households in this range may hold a mix of public equities, tax-advantaged retirement accounts, and real estate. At the same time, they may have less exposure to private investments and more advanced tax planning than households above $5M. That mix may be useful, but it doesn’t always mean everything is lined up well.
What often stands out here is complexity without coordination. Employer stock, plus overlapping funds across 401(k)s, IRAs, and taxable accounts, may create concentration that isn’t obvious at first glance.
A few checks may give a clearer picture:
Benchmark by percentage, not dollars. Compare the share of net worth tied to equities, bonds, cash, real estate, and private investments.
Check for concentration. Look across employer stock, home equity, and overlapping fund holdings. Some investors use a rough limit of about 5%–10% or less of investable assets for any single stock[37][11].
Review tax location. Tax-inefficient assets like taxable bonds and REITs may fit better in traditional IRAs or 401(k)s, while low-turnover index funds may make more sense in taxable accounts, and growth assets may be placed in Roth accounts[18][30][31][32][33][34][35][36][37][38].
Those checks may get tougher when accounts are spread across multiple custodians. Mezzi connects 401(k)s, IRAs, Roth accounts, HSAs, and taxable brokerage accounts through read-only access, with one household-level view of allocation, concentration, and tax efficiency. Its X-Ray feature surfaces overlapping holdings across funds, and its AI may flag cases where bonds sit in the wrong account type or where employer stock exposure has moved past a chosen threshold.
The idea is simple: see the full balance sheet, then decide how to handle the gaps.
FAQs
How do I know if I’m actually diversified?
To gauge whether you may be diversified, it often helps to look at your full financial picture, not just one account at a time. When investment accounts are pulled into one dashboard, hidden overlap and concentration risk may become easier to spot.
An AI-driven Exposure X-Ray may show holdings by company, sector, market cap, and geography. That kind of view may help you find duplicate exposure across funds or ETFs and see whether your allocation appears to line up with your targets.
How much cash is too much for a $1M–$5M household?
For a $1M–$5M household, holding too much cash may limit portfolio growth. A common guideline some people use is to keep 6 to 12 months of personal and business expenses in liquid assets.
Beyond that buffer, extra cash may weigh on returns. Cash options like money market funds or short-term Treasuries may offer a way to balance liquidity with potential yield.
Which assets belong in taxable vs. retirement accounts?
A common approach is to match investments to each account’s tax treatment, with the goal of improving after-tax returns.
Taxable accounts: tax-efficient assets like broad-market index funds, ETFs, municipal bonds, and long-term individual stocks
Tax-deferred accounts: tax-inefficient assets like corporate bonds, high-yield bonds, REITs, and high-turnover active funds
Tax-exempt accounts: high-growth assets like small-cap or emerging market equities
Disclosures:
This content is for informational purposes only and does not constitute investment advice or a recommendation to buy or sell any security.
Past performance is not indicative of future results. No guarantee of future performance or outcomes is implied.
Registration does not imply a certain level of skill or that the SEC has approved the company or its services.