
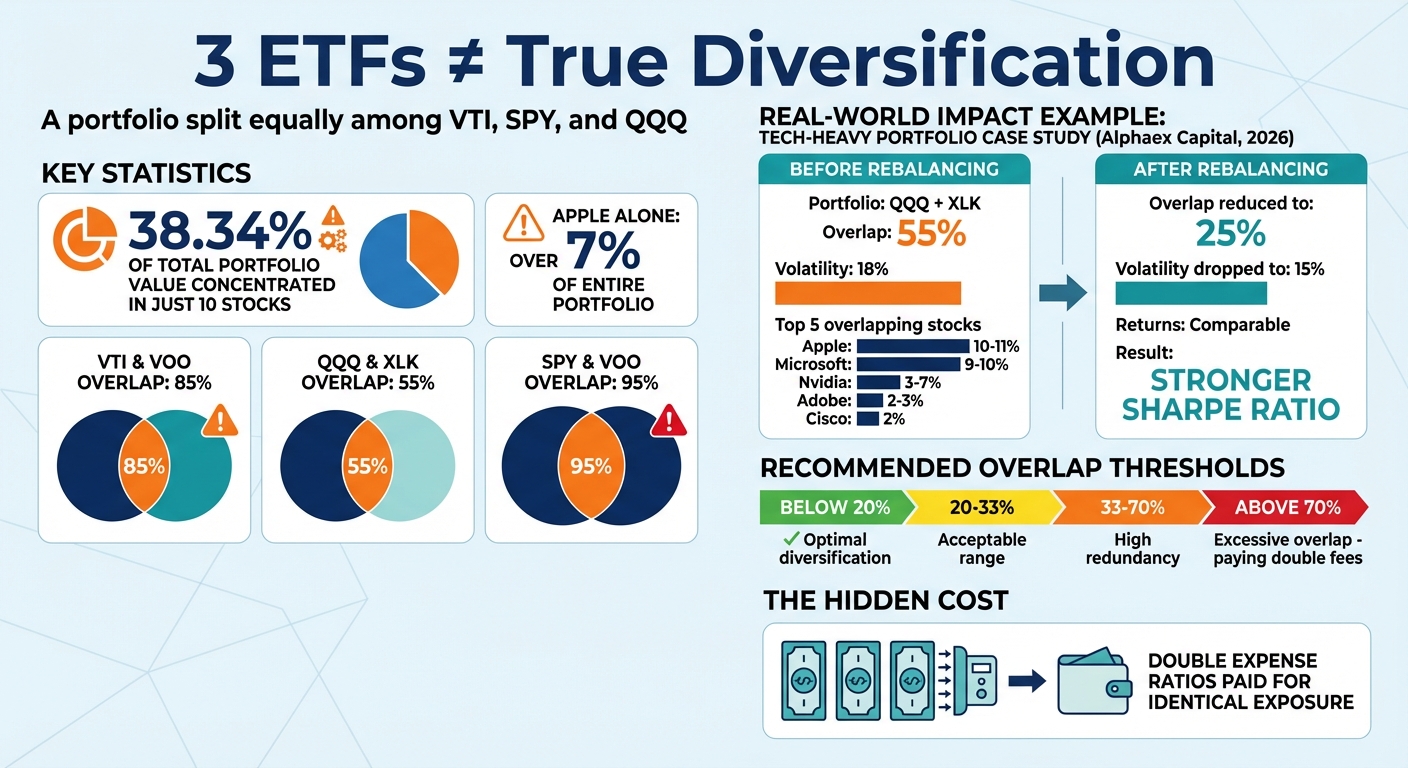
ETF overlap happens when multiple ETFs in your portfolio hold many of the same stocks. This can make your investments less diversified than they seem, increasing risk and redundancy. For instance, if you split your portfolio equally among VTI, SPY, and QQQ, nearly 40% of your money could be concentrated in just 10 stocks. Apple alone might make up over 7% of your portfolio.This reduces diversification, increases risk, and may cost you in fees and taxes.
Key Takeaways:
- Overlap reduces diversification: High overlap means you're exposed to the same companies across ETFs, increasing risk.
- Example of overlap: VTI and VOO overlap by 85%, while QQQ and XLK share 55% of holdings.
- Risks during downturns: If a major stock like Apple underperforms, it can impact multiple ETFs in your portfolio.
- Higher costs: You're paying multiple expense ratios for nearly identical exposure.
How to Fix It:
- Consolidate ETFs: Use one broad-market ETF instead of several overlapping ones.
- Diversify by asset class and geography: Add bond ETFs or international funds to reduce concentration.
- Use tools for analysis: Platforms like Mezzi help identify and reduce overlap while managing taxes.
Reducing overlap can lead to better diversification, lower fees, and improved risk management. Tools like Mezzi can simplify this process by analyzing your portfolio and offering actionable steps.
ETF Portfolio Overlap: Concentration Risk in a 3-ETF Portfolio
Your ETF Portfolio Is Lying to You: 3 Hidden Mistakes
The Hidden Risks of ETF Overlap
This section explores how adding a third ETF to your portfolio can amplify the risks of overlapping holdings.
How Risks Multiply Across 3 or More ETFs
While adding a third ETF might appear to diversify your portfolio further, it often does the opposite by increasing repeated exposure to the same companies. Instead of spreading risk, high overlap between ETFs can erode your diversification efforts. In fact, portfolios with significant overlap see minimal risk reduction from additional ETFs and may experience lower risk-adjusted returns.
A major issue arises when the same company appears across multiple ETFs - something that's common with mega-cap stocks that dominate broad indexes. If one of these companies faces an earnings miss or negative news, it can send shockwaves through your entire portfolio. For example, a stumble by Apple could simultaneously affect a tech ETF, an S&P 500 fund, and a total market fund. This interconnected risk becomes even more pronounced in sector-focused portfolios, as shown in the tech-heavy example below.
Example: Overlap in a Tech-Heavy Portfolio
In 2026, Alphaex Capital analyzed a portfolio containing QQQ (Invesco QQQ Trust) and XLK (Technology Select Sector SPDR Fund). They found a 55% overlap between the two ETFs, with five stocks - Apple (10–11%), Microsoft (9–10%), Nvidia (3–7%), Adobe (2–3%), and Cisco (2%) - making up the majority of the shared holdings. This overlap led to a portfolio volatility of 18%, effectively concentrating the investor’s risk across a small group of companies.
When Alphaex rebalanced the portfolio to reduce overlap to 25% - by downweighting duplicated holdings and increasing exposure to non-overlapping stocks like Amazon and Tesla - volatility dropped to 15%. Returns remained comparable, resulting in a stronger risk-adjusted Sharpe ratio. The takeaway? Holding three or more overlapping ETFs not only concentrates your bets but also increases redundant fees, ultimately weakening your portfolio's risk-adjusted performance.
How to Find ETF Overlap in Your Portfolio
Understanding the risks of overlap is one thing, but identifying it in your portfolio is the next crucial step. To figure out whether multiple ETFs you own hold the same underlying assets, you can either go the manual route or leverage technology for a more efficient analysis.
Manual Methods for Spotting Overlap
Start by reviewing the prospectus for each ETF in your portfolio. Focus on comparing the top 10–20 holdings, as these typically represent the bulk of the fund's exposure. To calculate the overlap percentage between two ETFs, identify the stocks they share. For each shared stock, use the smaller of the two weights. For example, if Apple makes up 10% of one ETF and 8% of another, count 8% toward your overlap total.
Using spreadsheet tools can make this process quicker. The CORREL function, for instance, calculates the Pearson correlation coefficient between the daily returns of two ETFs. If the coefficient is above 0.8, it’s a strong sign that the funds are tracking similar risk factors. Additionally, grouping holdings by GICS sectors can reveal concentration issues. For example, if two ETFs each allocate more than 40% to the Technology sector, you could be unintentionally doubling down on the same companies.
While this method is effective, it’s not exactly quick - especially if you’re managing several ETFs across different accounts. Still, identifying overlap is a critical first step toward reducing concentrated risks and achieving true diversification. If this process feels too time-consuming, technology can simplify the task.
Using Technology to Detect Overlap
Technology takes the manual process to the next level by providing a more streamlined and detailed analysis. Tools like Mezzi's Portfolio X-Ray feature allow you to analyze your entire portfolio by securely connecting all your accounts - whether it’s a 401(k), taxable brokerage or an IRA, or other account types. With read-only access, the tool identifies hidden overlaps among ETFs, mutual funds, and even individual stocks.
The X-Ray tool breaks down your portfolio to show which companies appear in multiple holdings, calculates your total exposure to each stock, and highlights areas of high sector concentration. For example, if Apple appears as 3% in one ETF, 5% in another, and 4% in a third, Mezzi aggregates these exposures to reveal that 12% of your portfolio is tied to Apple. This kind of insight is hard to achieve manually.
How to Reduce Overlap and Improve Diversification
Once you've spotted overlap in your portfolio, the next step is to bring it down to a level that still maintains diversification. Experts generally recommend keeping overlap between 10% and 20%, though some suggest staying below 33% for more effective diversification. If your overlap exceeds 70%, that’s a sign of high redundancy - essentially paying double fees for the same exposure. Using the identification methods we discussed earlier, here are some strategies to help you tackle overlap effectively.
Simplify with Broad-Market ETFs
Consolidating your holdings is one of the easiest ways to reduce overlap. If you own multiple ETFs tracking similar indexes - like SPY, VOO, and VTI - you’re likely paying multiple expense ratios for nearly identical exposure. For instance, SPY and VOO share a 95% overlap by weight, making them almost interchangeable. Owning both may not enhance diversification and could increase costs.
Instead, consider consolidating into a single broad-market ETF that tracks either the total U.S. stock market or the S&P 500. This approach offers exposure to hundreds of companies across various sectors, potentially reducing redundancy, risk, and fees.
Diversify Across Asset Classes and Geographies
True diversification requires spreading your investments across asset classes and regions that don’t move in sync. Adding bond ETFs or REITs to your portfolio can help, as these typically have minimal overlap with stock holdings. These asset classes tend to behave differently during market cycles, which may provide some protection when equities take a hit.
Geographic diversification is just as crucial. International equity ETFs and small-cap funds can capture segments of the market that are often underrepresented in funds focused on large-cap U.S. stocks. Including an international or emerging markets ETF introduces exposure to economies and companies not found in U.S.-centric portfolios. Aim for overlap below 40% when comparing ETFs - this indicates complementary exposure rather than redundancy.
Use AI-Driven Insights for Continuous Optimization
Markets evolve, and so do the weightings within your ETFs. A portfolio that seemed well-diversified six months ago might now show concentration as certain stocks outperform. Regular reviews are essential, but tracking overlap manually across multiple accounts can be tedious.
AI-driven tools can help simplify this process. For example, Mezzi’s Overlap Checker continuously monitors your portfolio for duplicative exposures by analyzing common holdings and their weightings. If an ETF isn’t recognized, you can manually input its top holdings for analysis. This tool helps pinpoint whether you’re unintentionally doubling down on specific stocks, which may increase risk if those holdings underperform. Additionally, Mezzi offers tax-aware rebalancing strategies, allowing you to reduce overlap without triggering unnecessary capital gains taxes - an important factor in keeping your portfolio healthy.
How to Rebalance Your Portfolio Without Tax Penalties
Selling appreciated ETFs in taxable accounts can lead to hefty capital gains taxes. For instance, if you own an S&P 500 ETF like IVV and a tech-heavy ETF like QQQ, both loaded with Nvidia, selling one could result in federal long-term capital gains taxes ranging from 15% to 20%, plus any applicable state taxes. This tax hit can quickly erode the benefits of diversification.
But here's the good news: rebalancing doesn't always mean selling. There are strategies to reduce overlap while keeping your tax liability low - or even turning rebalancing into a tax-saving opportunity.
Tax-Aware Rebalancing Techniques
Redirect new contributions. Instead of selling overlapping assets, you can channel new cash - whether from paychecks, dividends, or interest - into underweighted areas of your portfolio. For example, if your portfolio leans too heavily on QQQ and IVV due to tech exposure, you could direct your next $500 monthly contribution to a bond ETF or an international fund. Over six to 12 months, this approach gradually realigns your portfolio without triggering taxable events.
Rebalance in tax-advantaged accounts first. Accounts like IRAs, 401(k)s, and Roth IRAs allow you to trade without incurring capital gains taxes. Focus on making the bulk of your adjustments in these accounts. Then, use cash flow strategies to fine-tune your taxable accounts.
Leverage tax-loss harvesting. If one of your overlapping ETFs is trading at a loss, selling it can provide a tax advantage. Realized losses can offset gains from other sales or reduce your taxable income by up to $3,000 annually. Just be cautious of the wash sale rule: avoid repurchasing a "substantially identical" security within 30 days. For instance, selling QQQ at a loss and immediately buying VUG, which holds similar tech stocks, could trigger this rule.
How Mezzi Guides Tax-Efficient Rebalancing

Mezzi takes these strategies to the next level, offering data-driven insights to help you manage your portfolio with precision. Here’s how it works:
- Wash sale alerts. Mezzi continuously monitors your portfolio and flags potential wash sale risks before you act. For example, if you sell QQQ at a loss, Mezzi will check for overlap with other holdings like VUG (which may share stocks like Nvidia and Microsoft) and suggest waiting 31 days or choosing a less correlated replacement.
- Tax-loss harvesting opportunities. The platform analyzes unrealized losses across your portfolio to identify positions that could offset gains. For instance, it might highlight a -15% position in a sector fund that could counterbalance a +20% gain in a broad-market ETF. Mezzi even calculates the after-tax impact of each move, helping you maximize savings.
- Simulated rebalancing plans. Mezzi can model different strategies and compare their tax implications. It might recommend something like, “Sell 20% of QQQ, harvest losses from XLE, and add to VXUS,” projecting savings such as $2,500 on $10,000 in gains - all while reducing portfolio overlap. Step-by-step guidance ensures your diversification goals stay on track.
Tax rules can be complex and vary based on individual circumstances. Always consult a tax professional before making investment decisions.
Conclusion: Achieving True Diversification with Mezzi
Having three ETFs in your portfolio might seem like diversification, but the numbers tell a different story. For example, a portfolio evenly split between VTI, SPY, and QQQ can result in 38.34% of its total value being tied up in just 10 stocks. That kind of concentration exposes you to risks that diversification is supposed to avoid.
The key to solving this problem lies in gaining full visibility of your portfolio. You need to understand what you actually own, where overlaps occur, and how much exposure you have to individual stocks like Apple or Microsoft. This is where Mezzi’s X-Ray feature steps in. It reveals the stocks hidden within your ETFs, giving you a clear picture of your portfolio’s true composition.
Once you have that clarity, Mezzi helps you take action. It offers practical steps to optimize your portfolio, such as rebalancing in a tax-efficient way. Plus, it keeps an eye on your investments, alerting you to risks like wash sales and identifying tax-loss harvesting opportunities.
With Mezzi, portfolio management becomes more straightforward. It equips you with the tools to understand your holdings, manage risks, and make informed decisions - all without the1% AUM fees or the need to transfer accounts. You stay in control, while Mezzi ensures you have the transparency and insights needed for true diversification.
Whether your portfolio is $100,000 or $1,000,000, hidden overlaps can undermine your strategy. But with the right tools, you can address these issues and take control of your diversification. Mezzi makes it possible.
FAQs
How much ETF overlap is too much?
An ETF overlap exceeding 70% is often seen as too high. When this happens, it can undermine the diversification you’re aiming for and lead to heightened concentration risk in your portfolio. To maintain a more balanced investment strategy, take the time to review the underlying holdings of your ETFs and make adjustments to spread out your exposure.
Why do my ETFs overlap so much in big tech stocks?
ETFs frequently share holdings in major tech stocks because many funds target large-cap companies like Apple and Microsoft. This overlap often stems from similar investment strategies or the desire for broad market exposure. For example, combining a tech-focused ETF with a large-cap index fund might result in more than 70% overlap, which can undermine your portfolio's diversification. To spot these redundancies and address concentration risks, consider using tools like Mezzi’s overlap analyzer.
How can I reduce overlap without a big tax bill?
To minimize ETF overlap without incurring a hefty tax bill, start by pinpointing overlapping holdings. Tools like Mezzi's ETF overlap analyzer can make this process straightforward. Once identified, swap out redundant ETFs for more diversified alternatives to reduce concentration risk. To avoid triggering taxes, make these changes within tax-advantaged accounts, such as IRAs or 401(k)s. Mezzi’s AI-driven features can assist in fine-tuning your portfolio, ensuring it stays diversified and tax-efficient.
Related Blog Posts
Table of Contents
Book Free Consultation
Walk through Mezzi with our team, review your current situation, and ask any questions you may have.