
The short answer: a fiduciary may be required to put your interests first across the advisory relationship, while a broker may be held to Reg BI at the time of a recommendation. That gap may affect fees, fund choices, share classes, rollover advice, and long-term results.
Here’s what that may mean in plain English:
- A fiduciary may owe a duty of care and loyalty across the relationship.
- A broker may still recommend a higher-cost product if it fits Reg BI and conflicts are disclosed.
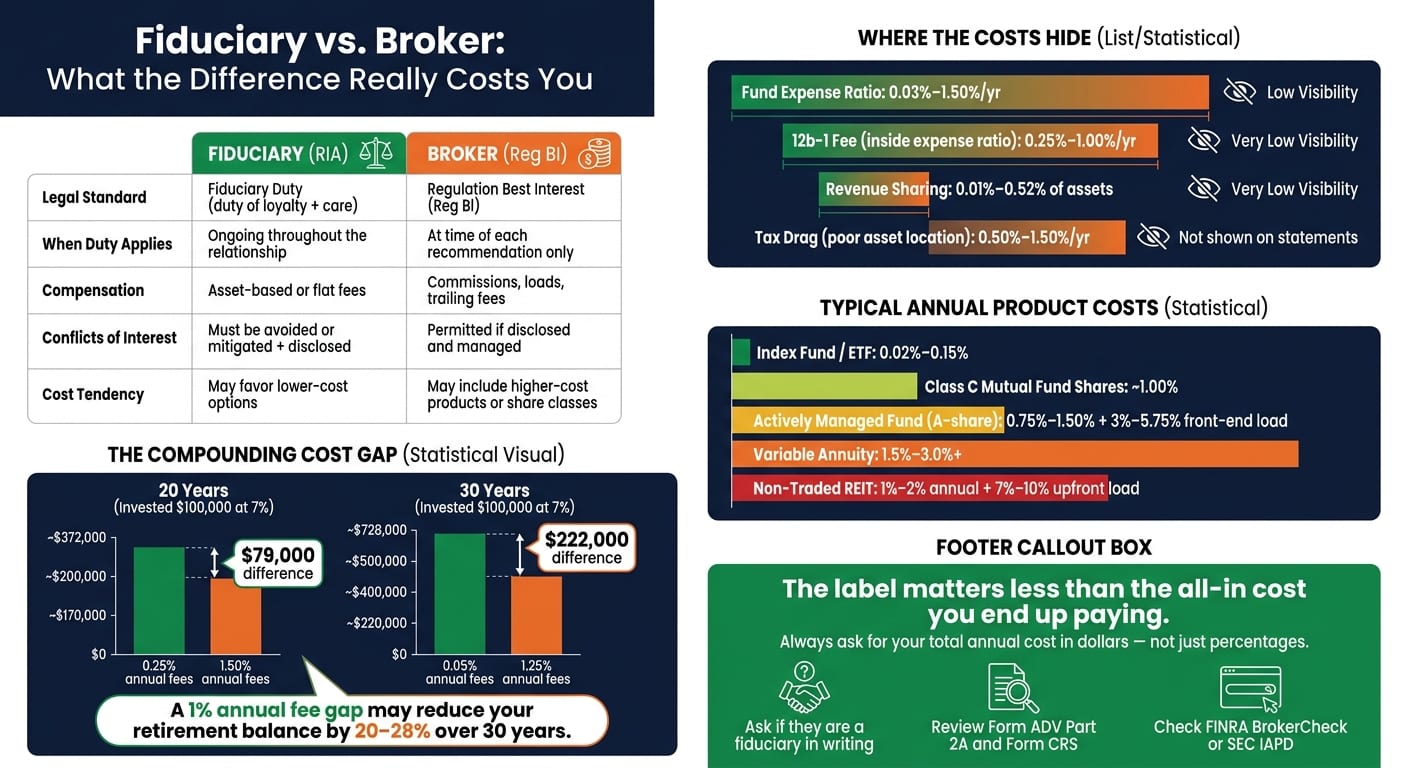
- Small fee gaps may add up. In the article’s example, $100,000 at 7% for 20 years may end near $372,000 at 0.25% in fees versus about $293,000 at 1.50%.
- Fund costs, loads, 12b-1 fees, revenue sharing, rollover fees, overlap, and tax drag may all add to the total cost.
- Dual-registered advisers may switch roles, which may change the standard that applies to your account.
Fiduciary Financial Advisor vs. Broker: Why Care?
Quick Comparison
If I were skimming this article, I’d focus on one thing: the label matters less than the all-in cost you may end up paying. The article’s main point is simple - the advice standard may shape what gets sold, and what gets sold may shape what you keep.
Fiduciary vs. broker: what each role legally owes you
The labels may sound close, but the legal duties are different. And that difference may shape what gets recommended.
A fiduciary - often an SEC-registered investment adviser (RIA) - owes you a duty of loyalty and care under the Investment Advisers Act of 1940. In plain English, your interests may come first across the advisory relationship. A broker, working under Regulation Best Interest (Reg BI), must act in your best interest for each recommendation, but that standard does not continue across the full relationship. It also still permits commissions and other conflicts if they’re disclosed and managed.
What fiduciary duty means in practice
A fiduciary adviser may be expected to understand your full financial picture and recommend what fits your goals, even if a lower-cost option pays them less. So if a low-cost index fund fits your plan better than an actively managed fund with a sales load, a fiduciary may be expected to point to the index fund instead. In many cases, that may push recommendations toward simpler, lower-cost choices when those choices fit the plan.
What a broker can recommend under suitability and Reg BI
Reg BI may have set a higher bar than the old suitability standard, but a broker may still recommend a higher-cost fund, a more complex product, or a share class that pays a trailing commission if the recommendation is reasonably in your best interest and the required disclosures are made. That’s often where higher-expense funds, commission-paying share classes, and other paid products may enter the picture.
Why dual registration can confuse investors
Many firms are dual-registered. That means the same person may act as a fiduciary in one context and as a broker in another - sometimes within the same relationship. The standard may shift based on the account type, and fees or product selection may shift with it.
The key question may be: which standard applies to this account? That answer may affect the products, share classes, and fees put in front of you. It may also change the funds, share classes, and account setup you end up paying for.
How the advice standard changes the investments you end up with
Once you know the standard, the next question gets pretty practical: what may it change in the account you actually open?
It may shape what gets recommended. In some cases, that may mean lower-cost funds. In others, it may mean higher-cost share classes or products that pay the seller more. The lowest-cost option for you may pay the seller less.
Expense ratios, loads, and 12b-1 fees explained
Every mutual fund charges an expense ratio - an annual fee stated as a percentage of your assets. A low-cost index fund might charge 0.05% per year, while an actively managed fund sold through a broker might charge 1.25% per year, including 12b-1 fees that pay the broker or platform. Many broker-sold funds also carry a front-end load of 3%–5.75%, taken before your money is invested.
Those percentages may look small on paper. Over time, they may add up.
At 1.25% in annual expenses, a $100,000 investment growing at 7% ends at about $506,000 after 30 years. At 0.05%, it grows to about $728,000 - a $222,000 gap.
A fiduciary may need to justify a higher-cost choice. A broker under Reg BI may still recommend it if the recommendation is disclosed and reasonably in your best interest.
The fee shown on the fund may be only part of the cost.
Commissions, revenue sharing, and shelf-space incentives
Beyond the expense ratio, brokers and their firms may receive revenue-sharing payments from fund companies in exchange for preferential platform placement. These payments may not appear in the fund's expense ratio, but they may shape which funds appear on the platform at all.
That may push you into a more expensive share class than your own plan would justify, with platform incentives potentially playing a part.
Rollover recommendations that raise your all-in costs
The cost gap may get wider at rollover time.
Rolling a 401(k) into an IRA may make sense, but it may also raise your costs. A DOL and GAO analysis found that average fees in IRAs are roughly 25 times higher than fees in the federal Thrift Savings Plan. Some advisers may earn $6,000–$9,000 from a single rollover recommendation.
One way some investors look at this is by comparing their current plan's total costs - expense ratios plus any plan-level administrative fees - against the proposed IRA's advisory fee plus underlying fund expenses. A 1% advisory fee on a $250,000 rollover is $2,500 per year before fund costs even enter the picture. If your 401(k) already holds low-cost institutional funds, staying put may cost less.
Where the money goes: cost drivers that compound quietly
The fee standard set at the start may show up later in the costs paid year after year. Many investors look first at the one number that's easy to spot: the advisory fee. But that fee may be only part of the picture.
The advisory fee is visible. Much of the rest may sit inside fund costs, trading, and taxes. Those less visible layers may be where broker incentives and adviser pay structures shape net returns over time.
Costs inside the portfolio
When a broker-led account setup gives preference to commission-paying funds over lower-cost options, the added cost may not appear as one clear line item on a statement. Instead, it may be spread across fund fees, platform payments, and tax-placement choices made when the account is opened.
The table below shows where each layer of cost often comes from, and how visible it tends to be:
Tax drag deserves a closer look. Poor asset location - for example, holding dividend-paying funds in a taxable account instead of an IRA - may create a recurring tax bill that reduces after-tax returns each year. A broker-led setup may also lead to weaker tax placement than a fiduciary-led one, since the incentive at account opening may center more on product placement than tax-aware allocation. It may not show up on a statement, but it may compound over time much like a fee.
Why overlap and unnecessary complexity cost more than expected
Redundant holdings are another source of hidden cost. Overlap means paying multiple layers of fees for much of the same exposure.
If overlapping funds carry expense ratios of 0.60% to 1.00%, the blended cost on that slice of the portfolio may end up well above what a single broad-market index fund may charge, often around 0.03% to 0.10%. In plain English: you may pay more for repetition. Mezzi's X-Ray feature may help show this overlap - cases where the same underlying stocks appear across several funds without being obvious at first glance.
Overlap may also create tax issues. When active managers in overlapping funds trade similar positions in opposite directions, they may realize gains without adding much diversification. Those gains may create tax bills. Add higher expense ratios, and the portfolio may cost more, diversify less, and become tougher to manage from a tax angle than a simpler, lower-cost setup.
A 1% annual fee gap may reduce a retirement balance by roughly 20%–28% over 30 years. And that's before adding overlap and tax drag.
The next step is to check statements, disclosures, and fee tools for these costs before they build up further.
How to protect yourself and cut unnecessary costs
Once you know the standard, the next step may be to verify costs and conflicts in writing. If those costs stay unchecked, they may add up over time.
Questions to ask before you act on advice
Before moving money or signing anything, it may help to get plain answers on a few points:
- Are you a fiduciary for every account and service you provide? Put it in writing.
- How are you paid - do you receive commissions, 12b-1 fees, or revenue sharing, and do you receive higher compensation for one product or account type?
- What is my total annual cost in dollars, including your fee, fund expense ratios, and account fees?
- Are there lower-cost share classes or products that provide similar exposure?
Ask for the answer in your engagement agreement or Form CRS. The goal isn't just to ask. It's to confirm whether the advice standard may be steering you toward higher-cost products.
Also, ask for your total annual cost in dollars, not just percentages. Over a 20- to 30-year retirement horizon, even a small gap may add up in a big way.
Documents and tools that reveal conflicts and excess fees
After that, compare the paperwork with the answers you were given. Two documents may matter most.
Form ADV Part 2A explains fee schedules, brokerage practices, and compensation arrangements. Pay close attention to the sections labeled "Fees and Compensation", "Brokerage Practices," and "Review of Accounts." If the language suggests the firm may receive added compensation from certain fund families or custodians, that may be worth a closer look.
Form CRS is shorter and standardized. It sums up services, fee ranges, conflicts of interest, the standard of conduct that applies, and the SEC's conversation-starter questions. Compare the fee ranges listed there with what appears on your account statements.
For background checks, use SEC IAPD for registered investment advisers and FINRA BrokerCheck for brokers and dual registrants. Both are free. A pattern of multiple recent complaints, regulatory actions, or repeated short stays at several firms may deserve more scrutiny.
You may also use Mezzi X-Ray to view all accounts together and spot overlap, duplicate exposure, and higher-cost share classes.
Do not sign or roll over until the math and disclosures match.
FAQs
How do I know which standard applies to my account?
Check your advisor’s Form ADV or Form CRS. These required disclosures may explain whether the advisor acts as a fiduciary or follows another standard, such as suitability.
You may find these forms through the SEC’s Investment Adviser Public Disclosure system or FINRA’s BrokerCheck. It may also make sense to ask the advisor directly whether they’re a fiduciary and how they’re paid, including any commissions or revenue-sharing conflicts.
Can a broker still recommend a good option if it costs more?
Yes. A broker may recommend a higher-cost option if it meets the suitability standard for your financial situation and goals.
Unlike a fiduciary, a broker does not have to put your best interests first. That setup may create conflicts. For example, a broker may have incentives to recommend products with higher commissions, sales loads, or expense ratios, even when a lower-cost option may be a better fit for long-term growth.
What fees should I add up before a rollover?
Before completing a rollover, some investors add up all costs to estimate the total fee drag on a portfolio.
That may include a new advisory fee, such as a percentage of assets under management (AUM), plus any platform or overlay fees.
It may also include internal fund expenses, such as:
- Expense ratios
- 12b-1 fees
- Sales loads
- Administrative fees
- Custodial fees
- Transaction fees
- Transfer fees
- Account maintenance fees
To spot costs that may be easy to miss, some people review fund prospectuses and the advisor’s Form ADV.
Disclosures:
- This content is for informational purposes only and does not constitute investment advice or a recommendation to buy or sell any security.
- Past performance is not indicative of future results. No guarantee of future performance or outcomes is implied.
- Registration does not imply a certain level of skill or that the SEC has approved the company or its services.
- Savings and performance examples are hypothetical and for illustrative purposes only. Actual results will vary based on individual circumstances, portfolio composition, market conditions, and fees.
- All links to external sources are provided for reference only.
Related Blog Posts
- Understanding Investment Fees: Hidden Costs to Watch For
- How high is too high for financial advisor fees
- How Much Does a Financial Advisor Actually Cost? Full Fee Breakdown
- How to Read Your Brokerage Statement and Spot Hidden Fees
Check your advisor’s Form ADV or Form CRS. These required disclosures may explain whether the advisor acts as a fiduciary or follows another standard, such as suitability.
You may find these forms through the SEC’s Investment Adviser Public Disclosure system or FINRA’s BrokerCheck. It may also make sense to ask the advisor directly whether they’re a fiduciary and how they’re paid, including any commissions or revenue-sharing conflicts.
Yes. A broker may recommend a higher-cost option if it meets the suitability standard for your financial situation and goals.
Unlike a fiduciary, a broker does not have to put your best interests first. That setup may create conflicts. For example, a broker may have incentives to recommend products with higher commissions, sales loads, or expense ratios, even when a lower-cost option may be a better fit for long-term growth.
Before completing a rollover, some investors add up all costs to estimate the total fee drag on a portfolio.
That may include a new advisory fee, such as a percentage of assets under management (AUM), plus any platform or overlay fees.
It may also include internal fund expenses, such as:
- Expense ratios
- 12b-1 fees
- Sales loads
- Administrative fees
- Custodial fees
- Transaction fees
- Transfer fees
- Account maintenance fees
To spot costs that may be easy to miss, some people review fund prospectuses and the advisor’s Form ADV.