If you’re investing, your brokerage statement is one of the most important tools for tracking your account. It provides a detailed breakdown of your holdings, transactions, and fees. But understanding it isn’t always straightforward - and hidden fees can quietly reduce your returns over time.
Here’s what you need to know:
- Account Summary: Shows your portfolio’s total value and changes over time.
- Holdings: Lists your investments, their cost basis, and current market value.
- Transactions: Details all trades, deposits, withdrawals, and fees.
- Fees: Includes charges like commissions, advisory fees, and fund expenses.
- Income: Summarizes dividends and interest earned.
Reviewing these statements regularly helps you spot errors, track performance, and identify charges that could erode your wealth. Even a 1% fee on a $100,000 portfolio can cost you $28,000 in returns over 20 years.
To avoid surprises, focus on sections like "Fees & Charges" and "Transaction Details." Look for vague descriptions like “miscellaneous” or “handling fees.” If something seems off, act quickly - brokerage agreements often require disputes within 30–60 days.
Understanding your statement not only protects your investments but also ensures your portfolio aligns with your financial goals. Small steps, like cutting unnecessary fees, can make a big difference over time.
How to Read Your Brokerage Statement [Stock, Bonds and Mutual Funds]
Understanding the Main Sections of Your Brokerage Statement
Once you know why brokerage statements matter, it’s time to dive into their common sections. While layouts may vary by firm, the core details remain similar.
Account Summary and Balance Changes
The account summary is your starting point. It shows your portfolio's ending value and how it changed during the statement period, giving you a clear picture of whether your investments grew or shrank.
This section also breaks down contributions, withdrawals, dividends, interest, fees, and market fluctuations. This helps you analyze which factors contributed to your portfolio’s performance and separate them from your personal contributions. Numbers in parentheses typically indicate debits - money leaving your account due to fees, losses, or withdrawals. Pay close attention to the "Change in Value of Investments" line, which reflects gains or losses driven by market activity rather than your transactions.
Often, you’ll find a pie chart summarizing your asset allocation, making it easy to see how your investments are distributed. Regularly reviewing this ensures your portfolio stays aligned with your risk tolerance and financial goals.
Next, take a closer look at the holdings section to understand the details of your investments.
Holdings and Asset Breakdown
The holdings section lists every investment you own, showing both its current market value and its cost basis - the original amount you paid. For example, if you bought 100 shares at $50 each (cost basis: $5,000), and they’re now worth $75 each, you’d see an unrealized gain of $2,500. This information is especially useful for tax planning since your cost basis determines your taxable profit when you sell.
This section can also highlight concentration risk. A single security making up more than 5% of your portfolio is considered a concentrated position. Additionally, owning multiple funds doesn’t automatically mean you’re diversified. By examining the top holdings of your mutual funds and ETFs, you might find overlapping exposures. For instance, several large-cap growth funds might heavily invest in companies like Apple or Microsoft. This overlap could mean you’re paying multiple management fees for essentially the same stocks.
Once you’ve reviewed your holdings, move on to the transaction history to verify all account activity.
Transaction History and Activity
This section captures every trade, deposit, withdrawal, dividend payment, and fee during the statement period. It’s your go-to record for verifying fees and spotting unauthorized activity.
Compare each trade to its confirmation, checking details like the security name, quantity, price, and date. Even small price discrepancies can add up over time, especially with larger transactions. Keep a close eye on your cash balance, too. An unexpected increase might indicate unauthorized sales, while a decrease could signal unauthorized purchases or withdrawals. Also, ensure dividends and interest payments match your holdings - income from unfamiliar securities warrants immediate investigation.
If you find errors, act quickly. Many brokerage agreements require you to dispute inaccuracies within 30 to 60 days. Failing to do so could mean you accept the transactions as accurate. As SIPC cautions:
Unless you complain in writing, your eligibility for SIPC protection may be compromised.
How to Find Hidden Fees in Your Statement
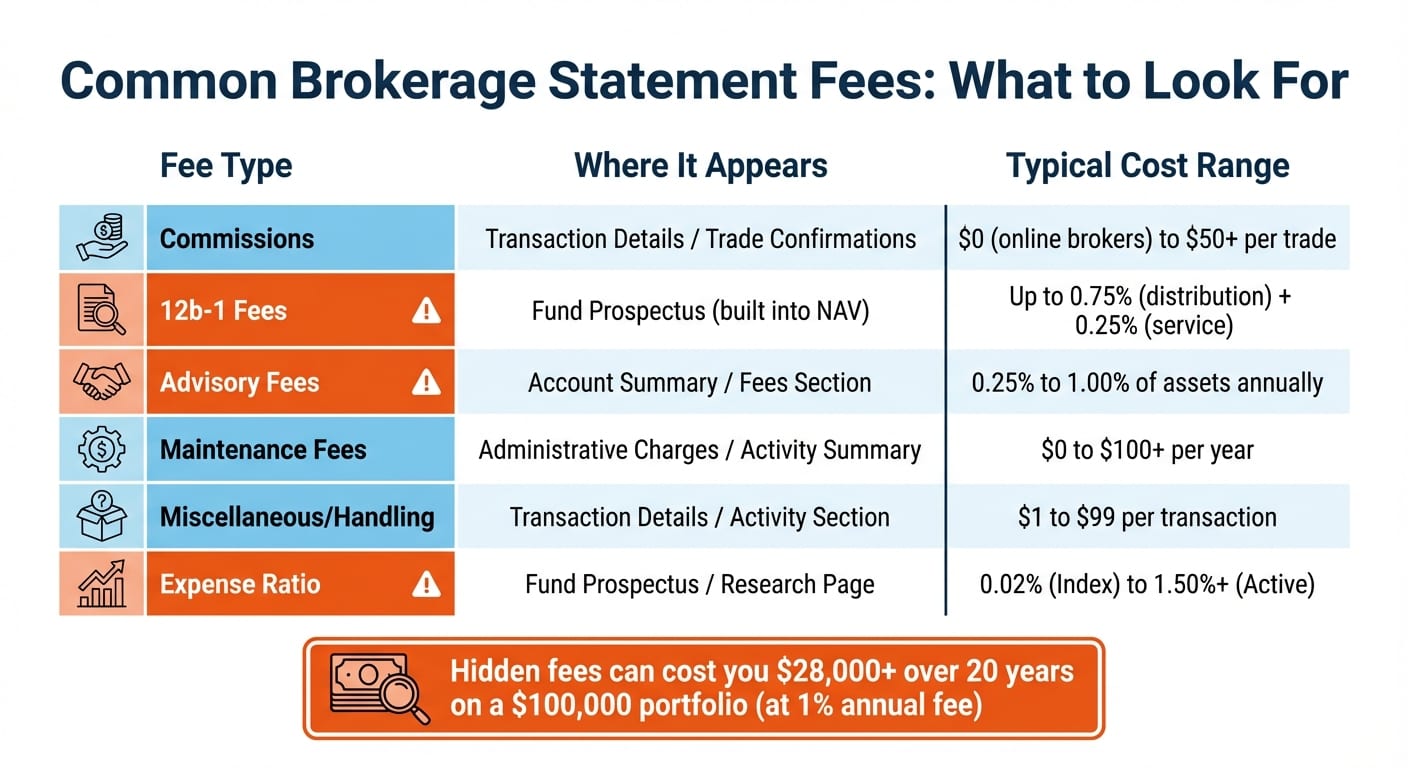
Now that you’ve got a handle on the main sections of your statement, it’s time to dig into the fees that might be quietly eating into your returns. These charges often fly under the radar because they’re not always clearly labeled or easy to spot.
Common Fees That Are Easy to Miss
Fees come in many forms, and some are designed to be less obvious. Sales loads, for instance, are charged when buying or selling mutual funds. Front-end loads apply at the time of purchase, while back-end loads (also called surrender charges) hit you when you sell. Then there are advisory fees, which are typically deducted as a percentage of your assets under management, often on a monthly or quarterly basis.
One particularly elusive fee is the 12b-1 fee. These are marketing and distribution costs baked into a mutual fund’s price, so they won’t show up as a separate line item on your statement. To find them, you’ll need to check the fund’s prospectus. These fees can add up, reaching as much as 1.00% annually (split into 0.75% for distribution and 0.25% for service). Other charges like account maintenance fees or miscellaneous fees - which might include postage, handling, or administrative costs - are often vaguely labeled, making them easy to overlook.
There have been cases of excessive fees being disguised. For example, in 2011, FINRA fined five brokerage firms for charging “handling fees” of $65 to $99 per trade, which were essentially hidden commissions. Similarly, NASAA uncovered a case where a broker charged $500 for physical security certificates, even though the actual cost was only $60.
Where Fees Show Up on Your Statement
Hidden fees tend to surface in three key areas. Start with the "Change in Account Value" section, usually located near the top of your statement. Look for a line labeled "Fees & Charges", often shown in parentheses as a deduction. Next, check the "Activity Summary" or "Cash Flow" section, where fees, commissions, and other charges are grouped under "Subtractions" or "Expenses." This section provides a detailed breakdown of the charges applied to your account.
Finally, review the "Transaction Details" section. Here, you’ll find costs tied to individual trades, such as sales loads, commissions, and handling fees. If you use margin, don’t forget to check the margin section for interest charges.
Recurring charges often appear in the activity section with vague descriptions like "miscellaneous" or "administrative fee." If your statement only shows a total figure for a trade without itemizing fees, you’re entitled to request a detailed breakdown.
By knowing where to look, you can spot and understand these fees before they quietly erode your returns.
How Fees Affect Your Long-Term Returns
Once you’ve identified hidden fees, it’s important to grasp how they can impact your investments over time.
Fees don’t just reduce your returns - they work against you in the long run. Any money lost to fees is money that doesn’t get reinvested, creating a compounding effect that can significantly shrink your wealth. As the SEC explains:
Fees and other costs reduce your return on your investments, and can have a significant impact on the overall return of your investments over time.
The silver lining? Fees have been falling. Between 1996 and 2024, fees on stock mutual funds dropped by 62%. The average expense ratio for all mutual funds and ETFs reached 0.34% in 2024. Index funds now average just 0.05%, while equity mutual funds hover around 0.40%. By opting for lower-cost options and cutting unnecessary charges, you can ensure more of your money stays invested and working for you.
How Mezzi Makes Statement Review Easier
Now that you know how to identify hidden fees in your financial statements, let’s look at how Mezzi simplifies the process. Reviewing multiple brokerage statements can eat up a lot of time, but Mezzi uses advanced AI tools to help interpret and compare your financial data with just a few clicks. It securely connects to thousands of institutions - like Schwab and Chase - using read-only providers such as Plaid and Finicity. This means you can review your data without ever sharing your login credentials.
Here’s how Mezzi helps you stay on top of your finances and uncover hidden fees across all your accounts.
See All Your Accounts in One Place
Instead of logging into separate portals for your 401(k), brokerage accounts, and Roth IRA, Mezzi brings everything together in a single dashboard. This unified view makes it easier to monitor your overall asset allocation, track performance, and identify fees that might otherwise get buried in individual statements. Say goodbye to juggling spreadsheets or switching between multiple apps.
While the dashboard gives a big-picture view, Mezzi’s X-Ray tool dives deeper into the details.
Using the X-Ray Feature to Find Hidden Costs
Mezzi’s X-Ray tool is designed to help uncover hidden costs like high-fee ETFs, excessive expense ratios, and wash sales. For example, it may help identify $10,000 to $20,000 in potential annual tax savings on a $1 million portfolio. The tool also highlights the long-term impact of typical 1% annual fees and flags overlapping stock positions, helping you determine whether your investments are too concentrated. As Shuping, Founder of Summer AI, explained:
Mezzi's X-Ray feature allowed me to uncover exposure to stocks I didn't realize I had.
Get AI-Powered Recommendations
Mezzi doesn’t stop at identifying issues - it also provides personalized recommendations to optimize your portfolio. The AI can suggest tax-loss harvesting opportunities, guide you on whether to contribute to Roth or Traditional accounts, and even recommend adjustments when market conditions change. You can chat directly with the AI to ask questions and make portfolio changes. Tim, CEO of Somnee, shared:
I loved chatting with the AI to make important changes to my portfolio. I have not found another wealth app like Mezzi.
These insights can significantly enhance long-term returns. For instance, reinvesting $10,221 saved on capital gains taxes could grow into $76,123 over 30 years. By combining these tools, Mezzi ensures you catch every cost, empowering you to manage your investments with greater confidence.
Conclusion
Take the time to review your brokerage statements regularly - it’s a simple yet powerful way to safeguard your wealth from unnecessary fees. Aim to go through your full statement every month or quarter, and cross-check it with your trade confirmations. Remember, if you don’t report discrepancies in writing, regulators may assume you’ve approved all fees and transactions.
Here’s a striking example: a 1% annual fee on a $100,000 portfolio can add up to almost $30,000 over 20 years. That’s not pocket change - it could be the difference between achieving your retirement goals or falling short. This highlights how critical it is to stay on top of your statements.
Although fees have been trending downward - stock mutual fund fees dropped by 62% and bond fund fees by 55% from 1996 to 2024 - don’t let your guard down. "Zero-commission" trading doesn’t always mean free. Hidden costs, like administrative fees, margin interest, and high expense ratios, can still chip away at your returns. Stay alert and informed to keep more of what you’ve earned.
FAQs
Which fees should I check first on my statement?
When managing your investments, it's crucial to take a close look at advisory fees, transaction costs, and hidden charges like fund expense ratios and administrative fees. These seemingly small costs can add up and have a noticeable effect on your returns over time. Be especially mindful of fees tied to account management, trading, or fund expenses. These charges are often tucked away in your statements, making them easy to overlook but important to identify.
How can I tell if I’m paying fund fees I can’t see?
Reviewing your brokerage statements, trade confirmations, and fund disclosures can help you pinpoint fees such as advisory charges, maintenance fees, transaction costs, and expense ratios. Be especially mindful of hidden fees like 12b-1 fees, cash drag, and transaction costs, which can be tricky to detect. Tools like Mezzi can make this easier by analyzing your portfolio and uncovering fees that might quietly chip away at your returns.
What should I do if I find an unfamiliar charge?
If you spot a charge on your brokerage statement that you don’t recognize, start by contacting your financial professional to understand its purpose and verify whether it’s legitimate. If the fee still doesn’t make sense or raises concerns, get in touch with your broker’s customer service or compliance department for more information or to challenge the charge. Taking the time to review your statements regularly can help you catch hidden fees and maintain clarity in your investments.
Disclosures:
- This content is for informational purposes only and does not constitute investment advice or a recommendation to buy or sell any security.
- Past performance is not indicative of future results. No guarantee of future performance or outcomes is implied.
- Users should not rely solely on AI-driven tools for financial decision-making.
- Registration does not imply a certain level of skill or that the SEC has approved the company or its services.
- Savings and performance examples are hypothetical and for illustrative purposes only. Actual results will vary based on individual circumstances, portfolio composition, market conditions, and fees.
Related Blog Posts
- 401(k) Fees: How to Identify Hidden Costs
- How to know how much you paid in advisory and account fees across brokerage accounts last year?
- Discover wich accounts are losing the most to fees and poor investment choices
- Finding hidden fees in investment portfolios
When managing your investments, it's crucial to take a close look at advisory fees, transaction costs, and hidden charges like fund expense ratios and administrative fees. These seemingly small costs can add up and have a noticeable effect on your returns over time. Be especially mindful of fees tied to account management, trading, or fund expenses. These charges are often tucked away in your statements, making them easy to overlook but important to identify.
Reviewing your brokerage statements, trade confirmations, and fund disclosures can help you pinpoint fees such as advisory charges, maintenance fees, transaction costs, and expense ratios. Be especially mindful of hidden fees like 12b-1 fees, cash drag, and transaction costs, which can be tricky to detect. Tools like Mezzi can make this easier by analyzing your portfolio and uncovering fees that might quietly chip away at your returns.
If you spot a charge on your brokerage statement that you don’t recognize, start by contacting your financial professional to understand its purpose and verify whether it’s legitimate. If the fee still doesn’t make sense or raises concerns, get in touch with your broker’s customer service or compliance department for more information or to challenge the charge. Taking the time to review your statements regularly can help you catch hidden fees and maintain clarity in your investments.