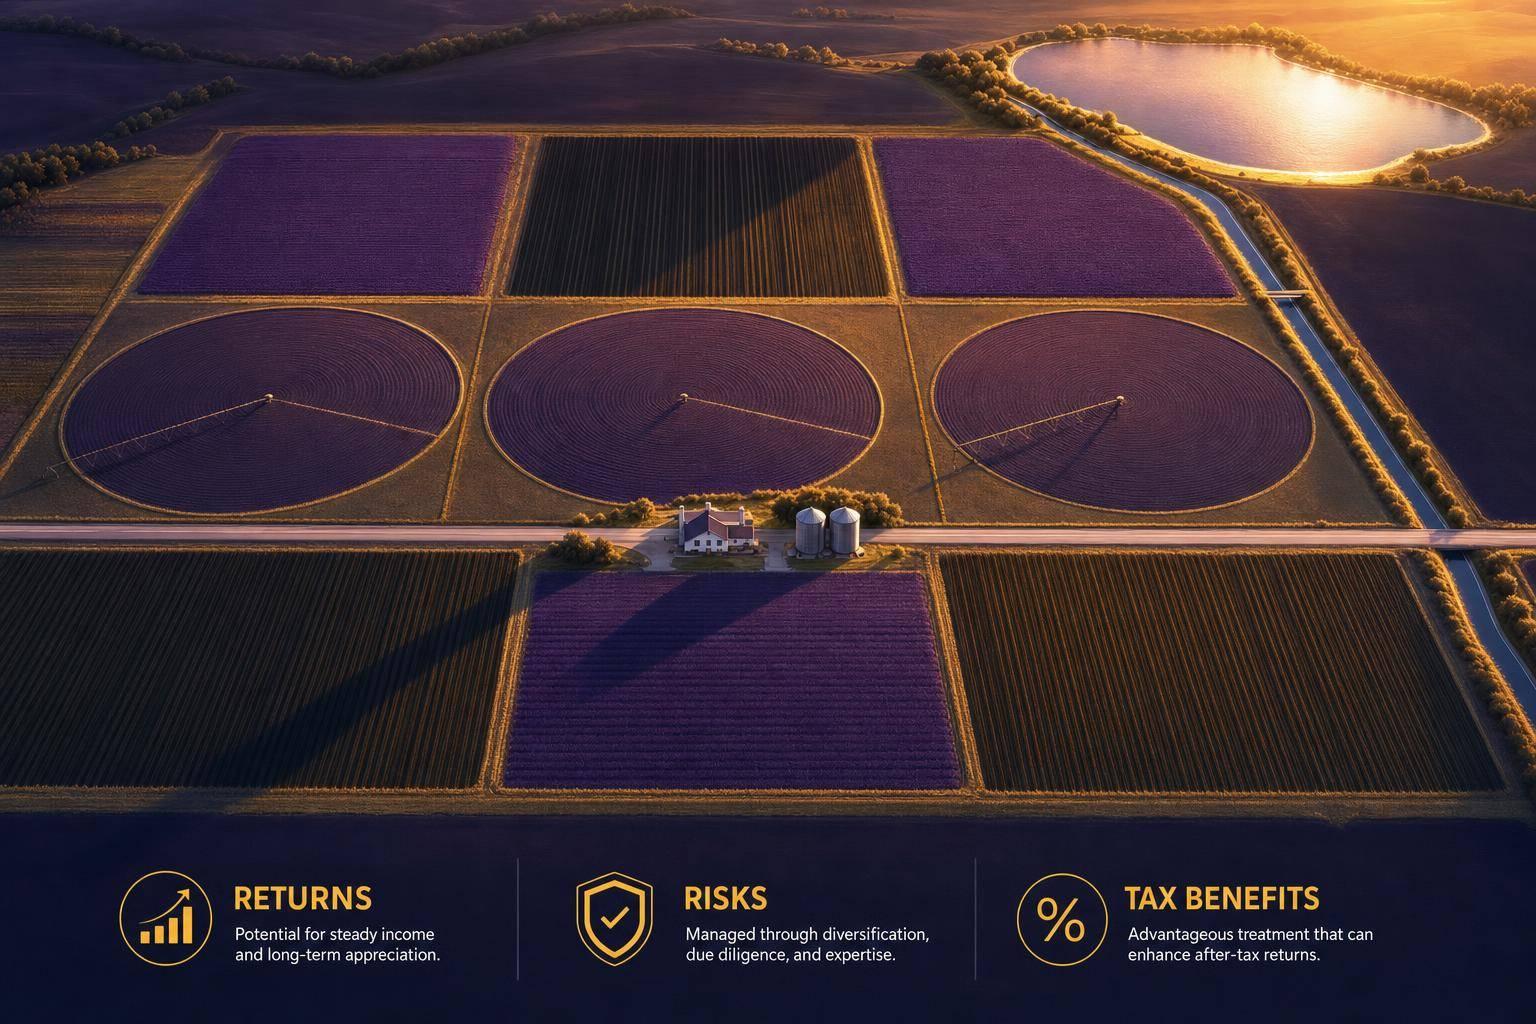
Farmland may offer a mix of income, land value growth, and tax features - but it may also tie up money for years.
If I were sizing it up fast, I’d boil it down like this:
- Returns may come from two places: rent and land price growth
- Cash yields may stay modest: recent rent-based yield figures were around 2.8%
- Long-term returns have looked competitive: the NCREIF Farmland Index returned 10.15% annualized from 1992 to 2024
- Volatility has been lower than stocks: about 6.82% versus much higher equity volatility in the data cited
- The main risks are plain: weather, water, crop prices, tenant quality, leverage, and low liquidity
- Taxes may vary a lot by structure: direct ownership, REITs, private funds, and crowdfunding may all be treated differently
- Access ranges from simple to hands-on: one public REIT share at one end, $500,000+ direct purchases at the other
Here’s the short version: farmland may fit investors with a long time horizon, a tolerance for illiquidity, and an interest in real assets. But the return pattern may depend less on the big idea of “farmland” and more on the details - water rights, crop type, lease terms, debt, fees, and tax setup.
Farmland Returns Aren't What They Look Like | Cannon Michael
Quick comparison
What stood out to me most is simple: farmland may look steady on paper, but the risks may sit below the surface. A farm with weak water access, one tenant, one crop, or stale appraisals may behave very differently from the broad return numbers people quote.
So if I were reading this article for the main takeaway, it would be this: farmland may work as a small part of a portfolio, but the structure, taxes, and exit path may shape the outcome as much as the land itself.
How farmland investments generate returns
Farmland returns may come from two main sources: the income the land produces each year and any increase in land value over time. But that’s not the whole story. Risk and liquidity may shape the outcome just as much as income and appreciation.
Land appreciation: limited supply, water access, and local demand
Farmland values may move up when supply stays tight and local demand remains strong. In the U.S., cropland averaged $5,830 per acre in 2025, up 4.3% from 2024. In Iowa’s Corn Belt, prime ground averaged $14,198 per acre at auction in 2024.
Still, appreciation doesn’t move in a straight line. In 2024, the NCREIF Farmland Index posted its first negative annual return since 1991, at -1.03%.
Water access may also create major value gaps, especially in the West. In California’s San Joaquin Valley, almond orchards with reliable surface water rights trade at $18,000 to $25,000 per acre, while groundwater-only parcels in the same area may trade at a 50% to 80% discount - sometimes as low as $4,000 per acre. That spread between water-secure and water-constrained land may affect both appreciation potential and income stability.
Rental income and crop-based income: cash rent, crop share, and operating profit
Farmland may also produce income in three common ways:
- Cash rent involves a fixed annual payment - often $150 to $400 per acre, depending on soil quality and region - regardless of harvest results.
- Crop-share leases give the landowner 33% to 50% of the actual harvest, so income may move with commodity prices and yields.
- Owner-operated structures keep all crop revenue with the owner, but they may also bring the most exposure to input costs and price swings.
A simple way to frame returns is to divide annual rent by land value. Using $161 per acre in average cropland rent and a land value of $5,830 per acre, the cash yield works out to about 2.8%. Yields have compressed from roughly 6% in the early 1990s to about 3% in 2025.
Specialty crops such as almonds or grapes may generate $2,000 to $5,000 per acre, but that income may be less stable. The upside may look higher on paper, though the ride may be bumpier too.
Total return and how farmland compares to stocks, bonds, and REITs
From 2000 to 2024, U.S. farmland compounded at 8.95% annually versus the S&P 500’s 7.91%, with a standard deviation of 6.82% compared with 16.9% for equities. That mix of similar returns, lower volatility, and a correlation to stocks below 0.3 is a big part of the diversification case.
Public farmland REITs may behave very differently from private farmland holdings. Gladstone Land (LAND) fell roughly 27% in 2024, which shows that publicly traded farmland vehicles may still have stock-market sensitivity and interest-rate risk.
Liquidity may differ just as much as return patterns. Public REITs trade daily, crowdfunding platforms often target a 5- to 10-year hold, and direct ownership is very illiquid.
The next question is what may disrupt those returns. They may depend on weather, tenants, prices, and liquidity.
The main risks: weather, prices, operators, and liquidity
Weather, climate, and commodity price swings can hit both income and land values
Farmland returns may look steady on the surface. But that picture may change fast when weather, water, or crop prices move the wrong way.
A bad season may cut income. If those conditions stick around for years, land values may also come under pressure. Water adds another layer. It’s not just about one dry year. In some places, long-term access to water may shape which farms hold value better than others.
California is a clear example. The Sustainable Groundwater Management Act (SGMA) may affect farmland prices in ways that go beyond simple quality differences between properties.
"We continue to see this divergence between the values of properties that have multiple sources of water and properties that are reliant on wells only. That is SGMA's influence." - Janie Gatzman, San Joaquin Valley Land Appraiser
Commodity prices may add pressure too. If corn, soy, or almond prices fall hard, farm profits may tighten. Tenants may push back on rent, and land values may also soften. The 2024 NCREIF data shows how sharp that split may get: annual cropland returned +5.66%, while permanent cropland returned -10.18%. Same asset class, but very different results based on what was grown.
Tenant, operator, and concentration risk often matter more than investors expect
The person running the farm may matter as much as the land itself.
A weak operator may miss planting windows, neglect soil health, or fall behind on rent. And here’s the tricky part: the damage may not show up right away. A farm may look fine for a while, even as the underlying operation slips.
That risk may be even sharper with permanent crops. Replacing a tenant for almonds or other specialized crops may take time and money, and the next operator may not perform any better.
Concentration risk may make all of this harsher. If someone owns one farm in one county with one crop type, a single bad season, pest issue, or rule change may hit the whole position at once. The same idea applies to a larger portfolio. If it leans too heavily on one region or one crop, one local shock may spread across the full holding.
Some investors try to reduce that exposure by spreading holdings across:
- Different crop types
- Different regions
- Different operators
Liquidity, leverage, and valuation risk can change the investment case
Farmland may also be hard to exit.
Direct ownership often takes 6 to 12 months to sell, and private funds or crowdfunding deals may come with 5- to 12-year lockups and little secondary-market liquidity. In plain English, money may be tied up for longer than expected, especially during periods when flexibility may matter most.
Leverage may add another layer of risk. Debt at the property or fund level may magnify losses if income drops or interest rates move up. Higher rates may also make loan payments harder to cover and refinancing tougher during stress.
Valuation may be another blind spot. Because farmland is often appraised only from time to time, reported values may lag market conditions by 12 to 24 months. So a property may appear steady on paper even if its current economic value has already shifted.
That mix of illiquidity and stale pricing may affect more than the headline return. It may also shape after-tax results and exit outcomes. Some investors model farmland as locked up for the full holding period and test what may happen under lower rents or higher borrowing costs. That kind of pressure test may matter more once taxes and exit rules come into play.
Tax rules, tax drag, and the main ways to get exposure
Key U.S. tax rules: deductions, depreciation, capital gains, and 1031 exchanges
Farmland taxes may look very different depending on how the asset is owned.
Raw land isn't depreciable. But certain improvements may be. That may include irrigation systems, drainage tiles, fencing, grain storage, and mature orchards or trees. In some cases, cost segregation may shift more deductions into the early years of ownership.
Income type matters too. Rental income may often be treated as passive for the owner, and higher earners may also face the 3.8% Net Investment Income Tax (NIIT). Passive loss rules may apply as well, which means depreciation losses may not offset W-2 wages unless the investor qualifies as an active participant.
At sale, farmland held for more than one year may generally fall under long-term capital gains treatment. A Section 1031 exchange may defer those gains if the proceeds are rolled into another qualifying U.S. real property investment. But the timing rules are tight: 45 days to identify the replacement property and 180 days to close. Farmland held at death may also receive a step-up in basis, which may remove embedded capital gains for heirs.
That said, those tax perks may depend heavily on the ownership structure.
Direct ownership, farmland REITs, crowdfunding, and private funds compared
The way you get exposure may shape both taxes and day-to-day experience.
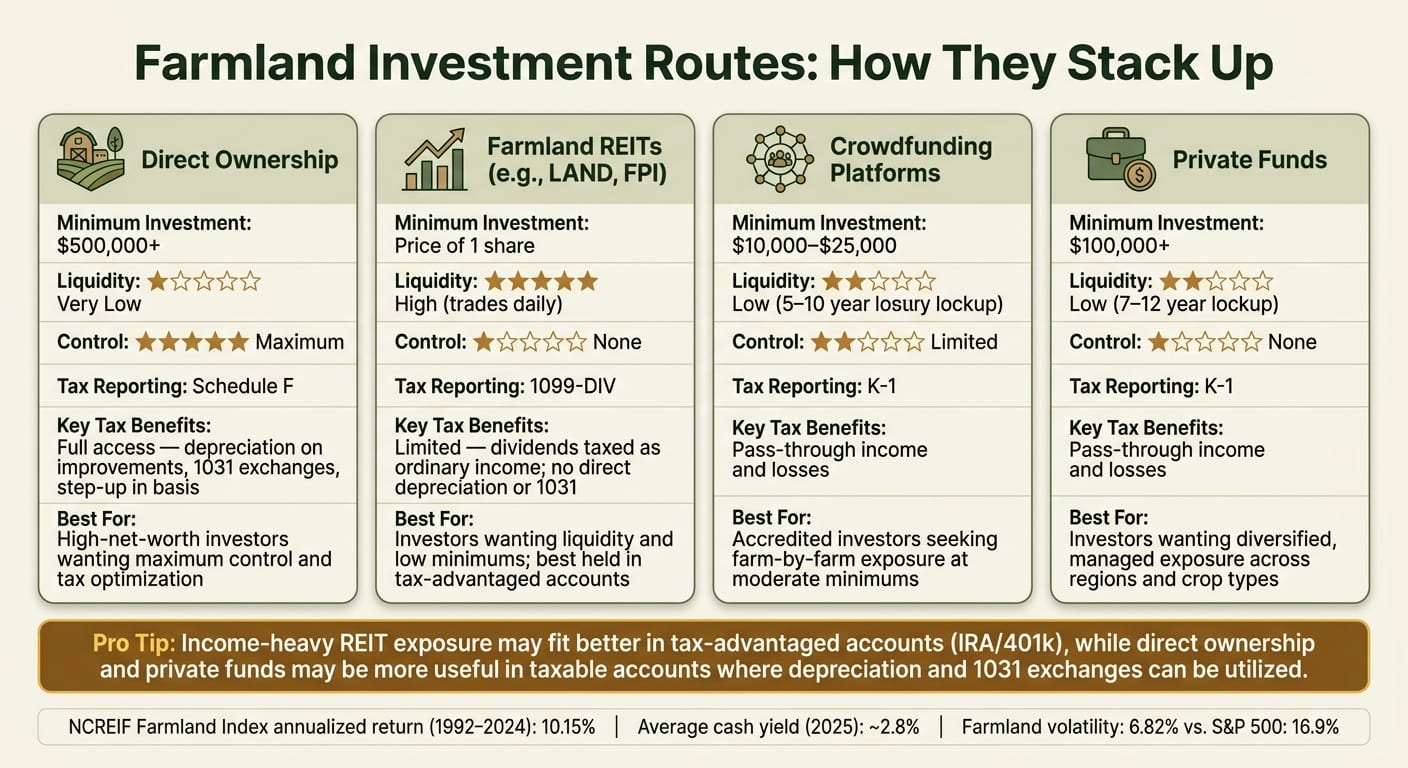
Direct ownership may offer the most control. It may also give the broadest access to tax tools like depreciation and 1031 exchanges. The catch? It often requires $500,000+ in capital and a lot more hands-on involvement.
Publicly traded farmland REITs like Gladstone Land Corp. (NASDAQ: LAND) and Farmland Partners Inc. (NYSE: FPI) may offer daily liquidity and low minimums, sometimes just the cost of one share. But the trade-off may be less favorable tax treatment. REIT dividends may often be taxed as ordinary income, and investors usually don't get the same direct access to depreciation or 1031 treatment. REITs must also distribute at least 90% of taxable income as dividends.
Crowdfunding platforms sit somewhere in the middle. They may offer farm-by-farm exposure with minimums around $10,000 to $25,000, and many deals may be limited to accredited investors. Tax forms often come through a K-1, and lockup periods of 5 to 10 years may be common, with little or no secondary-market liquidity.
Private funds may appeal to people who want management handled for them and exposure across different regions or crops. But they often come with $100,000+ minimums and holding periods of 7 to 12 years. Like crowdfunding deals, they often pass through income and losses on a K-1.
A common rule of thumb: income-heavy REIT exposure may fit better in tax-advantaged accounts, while direct ownership and private funds may be more useful in taxable accounts where depreciation deductions and 1031 exchanges may actually matter.
So the better fit may come down to what matters more to you: control, liquidity, or tax treatment.
How Mezzi helps evaluate after-tax farmland exposure across all accounts
Once you know the structure, the next step may be seeing how it fits across taxable and retirement accounts.
Mezzi lets you view farmland REITs, private deals, and manual holdings in one place. It shows brokerage, retirement, and manually tracked holdings in a single read-only view. Its X-Ray view helps spot overlap across ETFs, mutual funds, and individual positions. That may make it easier to see whether income-heavy assets are sitting in a less favorable account type, or whether your farmland exposure may be more concentrated than expected.
Review depreciation, 1031 timelines, and estate planning with a qualified tax professional.
What to check before investing and the bottom line
A due-diligence checklist for self-directed investors
After looking at returns, risks, and taxes, there’s one more step: checking whether the deal itself may hold up. Before putting money in, review the land, the lease, and the exit path.
Soil and productivity come first. Look at 5–10 years of yield data and local productivity scores such as Corn Suitability Rating (CSR). A CSR of 80+ may point to prime ground. It also makes sense to compare broker materials with local extension data instead of taking marketing claims at face value.
Water access may be the biggest risk in Western states. Check whether the property depends on surface water, groundwater, or both, and review how senior those water rights may be. In places where water is tight, reduced access may lower both income and resale value. In California, groundwater-only almond orchards have traded at a 50% to 80% discount versus similar properties with surface water access.
Operator and lease structure may matter more than many investors expect. Review the tenant’s balance sheet, local reputation, crop insurance practices, and equipment scale. Then verify the lease structure and how risk may shift under cash rent, crop share, or owner-operated setups. Fees also deserve a close read, including setup, annual management, and performance fees.
Downside modeling may help show what happens if things go wrong. Some investors test lower commodity prices, higher input costs, weaker yields, and a slower exit. For crowdfunding deals, it may be worth confirming that each farm sits in a separate SPV. A common sizing rule suggests farmland may account for about 5% to 15% of total investable assets so illiquidity may stay more manageable.
Once the land clears underwriting, the next issue is whether the structure may fit your balance sheet and time horizon.
Conclusion: farmland can work, but only when the structure fits your goals
Farmland may appeal to investors looking for a real asset, but the fit may depend on crop type, geography, water access, and ownership structure. The best access route for one person may not fit another. Direct ownership, crowdfunding, private funds, and public REITs each come with different capital needs, time horizons, and liquidity trade-offs. For some investors, farmland may make the most sense as one part of a broader portfolio plan.
FAQs
Is farmland a good hedge against inflation?
Yes. Farmland is often viewed as a hedge against inflation because higher food prices and farm input costs may support both rental income and long-term land values.
That said, the inflation effect may show up with a delay of 1 to 2 years. Over longer holding periods, farmland has historically done a better job of preserving purchasing power than fixed-rate bonds and has shown a strong positive correlation with the Consumer Price Index.
How much farmland exposure in a portfolio is too much?
A common guideline may be 5% to 15% of your investable portfolio. The idea is to balance farmland’s diversification appeal with the fact that it may be hard to sell on short notice.
Many investors may start closer to 5%, spread across multiple farms or a diversified fund. As they get more familiar with the asset class, some may increase exposure toward 10% or 15%.
For investors looking for a more meaningful allocation, a total investment of $30,000 to $50,000 is often mentioned.
What kind of farmland is usually the least risky?
Generally, the least risky farmland may have high-quality soil - for example, a Corn Suitability Rating of 80 or higher - and reliable water rights.
Disclosures:
- This content is for informational purposes only and does not constitute investment advice or a recommendation to buy or sell any security.
- Past performance is not indicative of future results. No guarantee of future performance or outcomes is implied.
- Savings and performance examples are hypothetical and for illustrative purposes only. Actual results will vary based on individual circumstances, portfolio composition, market conditions, and fees.
Related Blog Posts
- Predictive Tax Analytics: Key Benefits for Investors
- Single-Family Rentals: Long-Term Wealth Strategies
- DBA vs RJA vs MOO - Best agriculture ETF for food commodity exposure
- The Complete Guide to Alternative Investments including farmland, art, pre-ipo, and private credit
Yes. Farmland is often viewed as a hedge against inflation because higher food prices and farm input costs may support both rental income and long-term land values.
That said, the inflation effect may show up with a delay of 1 to 2 years. Over longer holding periods, farmland has historically done a better job of preserving purchasing power than fixed-rate bonds and has shown a strong positive correlation with the Consumer Price Index.
A common guideline may be 5% to 15% of your investable portfolio. The idea is to balance farmland’s diversification appeal with the fact that it may be hard to sell on short notice.
Many investors may start closer to 5%, spread across multiple farms or a diversified fund. As they get more familiar with the asset class, some may increase exposure toward 10% or 15%.
For investors looking for a more meaningful allocation, a total investment of $30,000 to $50,000 is often mentioned.
Generally, the least risky farmland may have high-quality soil - for example, a Corn Suitability Rating of 80 or higher - and reliable water rights.