Updated September 26, 2026.
Archived article dated February 4, 2025. This dated product update has been edited for clarity. Launch details and roadmap statements below refer to the original publication date; screenshots are historical illustrations. See current membership options and the Mezzi help center for today’s product details.
Hey there!
If you’re like me, you wake up, check the markets, then check your own portfolio. Are you doing as well? Are you doing worse? At best, it’s a guess from day-to-day. Forget about long-term insights. You did pretty good, maybe the S&P 500 did better. Who knows why?
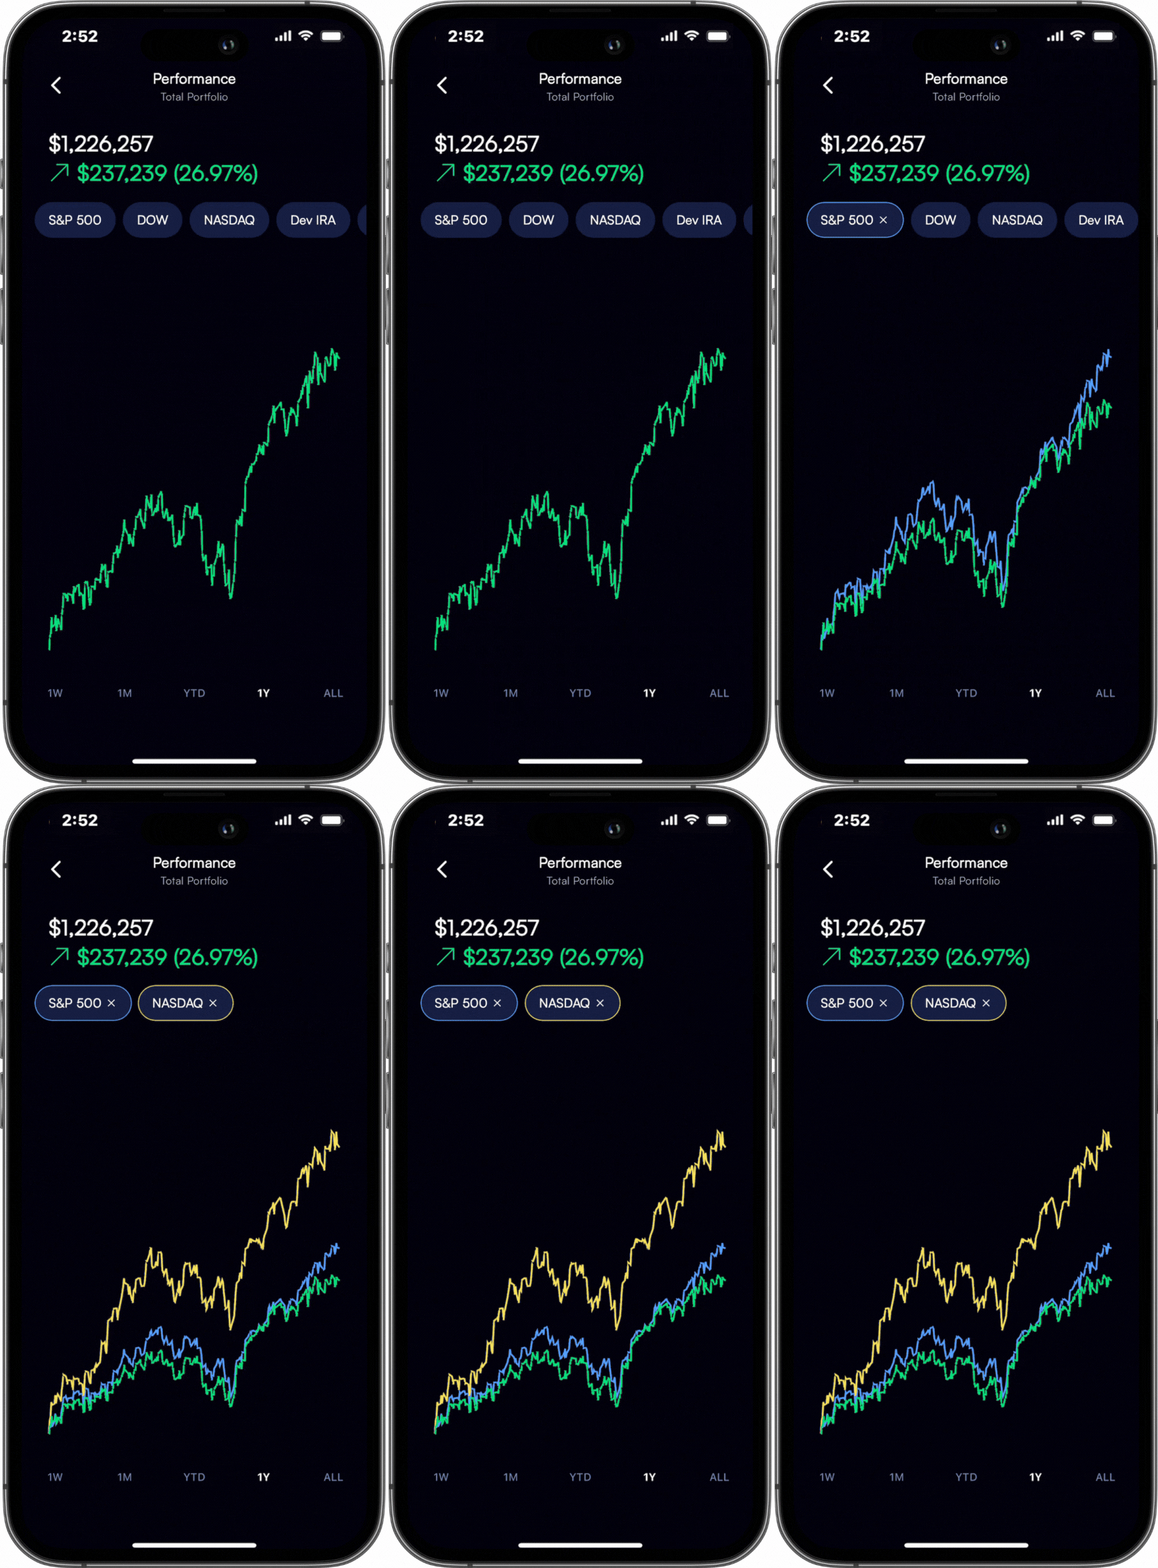
Now, with Performance by Mezzi you can benchmark all your investment accounts against key indices. Compare your taxable E*Trade brokerage account vs. your Schwab IRA vs. your Fidelity 401(k). Then, collectively compare them against the S&P 500, Dow, or Nasdaq.
No more checking CNBC or Google to just get a feeling of how you’re performing against the market each day. Finally get insight across time and across your accounts.
Download the latest version of Mezzi for iOS to explore, or learn more about our updates to Performance 👇.
Benchmark against key indices
Benchmark each of your connected Mezzi accounts against the S&P 500, Dow, and Nasdaq over multiple time horizons.
It may make sense to benchmark one of your accounts against the S&P and another against the NASDAQ.
Now you can do this the way you want.
Compare performance across accounts
Which of your investment accounts are performing the best?
Are your retirement accounts keeping up with your brokerage accounts?
Are they doing better than benchmarks?
Today’s update makes it easier than ever to answer these questions. You can also run these comparisons with your partner’s investment accounts.

Make the comparison fair before judging the result
Pick the same start and end dates and check whether both accounts have complete history. An account opened halfway through the period cannot support the same full-period comparison without additional assumptions.
Then check what is being measured. A hypothetical account that starts at $50,000, receives a $10,000 deposit and ends at $60,000 has a larger balance without any investment gain. Deposit-adjusted performance is the relevant comparison with an index; balance growth answers a different question.
Which benchmark should I use?
Choose a benchmark that helps explain the account's purpose and risk. A diversified portfolio containing bonds and cash should not be expected to behave like an all-stock index. Check whether the displayed series includes dividends and whether fees are treated consistently.
The original release introduced account and index comparisons; the custom comparison update added saved choices. Use a disappointing comparison to ask what drove the difference, rather than treating it as an automatic instruction to replace holdings.
Explore the current experience in your own account, or check the Mezzi help center for current setup and availability.
Open MezziBy Manish Jain, CFA, co-founder of Mezzi. Original publication date retained; editorial clarification September 26, 2026.
This historical product update is for informational purposes. Examples are illustrative, not investment recommendations or promised results. Account coverage and data quality affect analysis. Review assumptions before acting; AI can make mistakes.