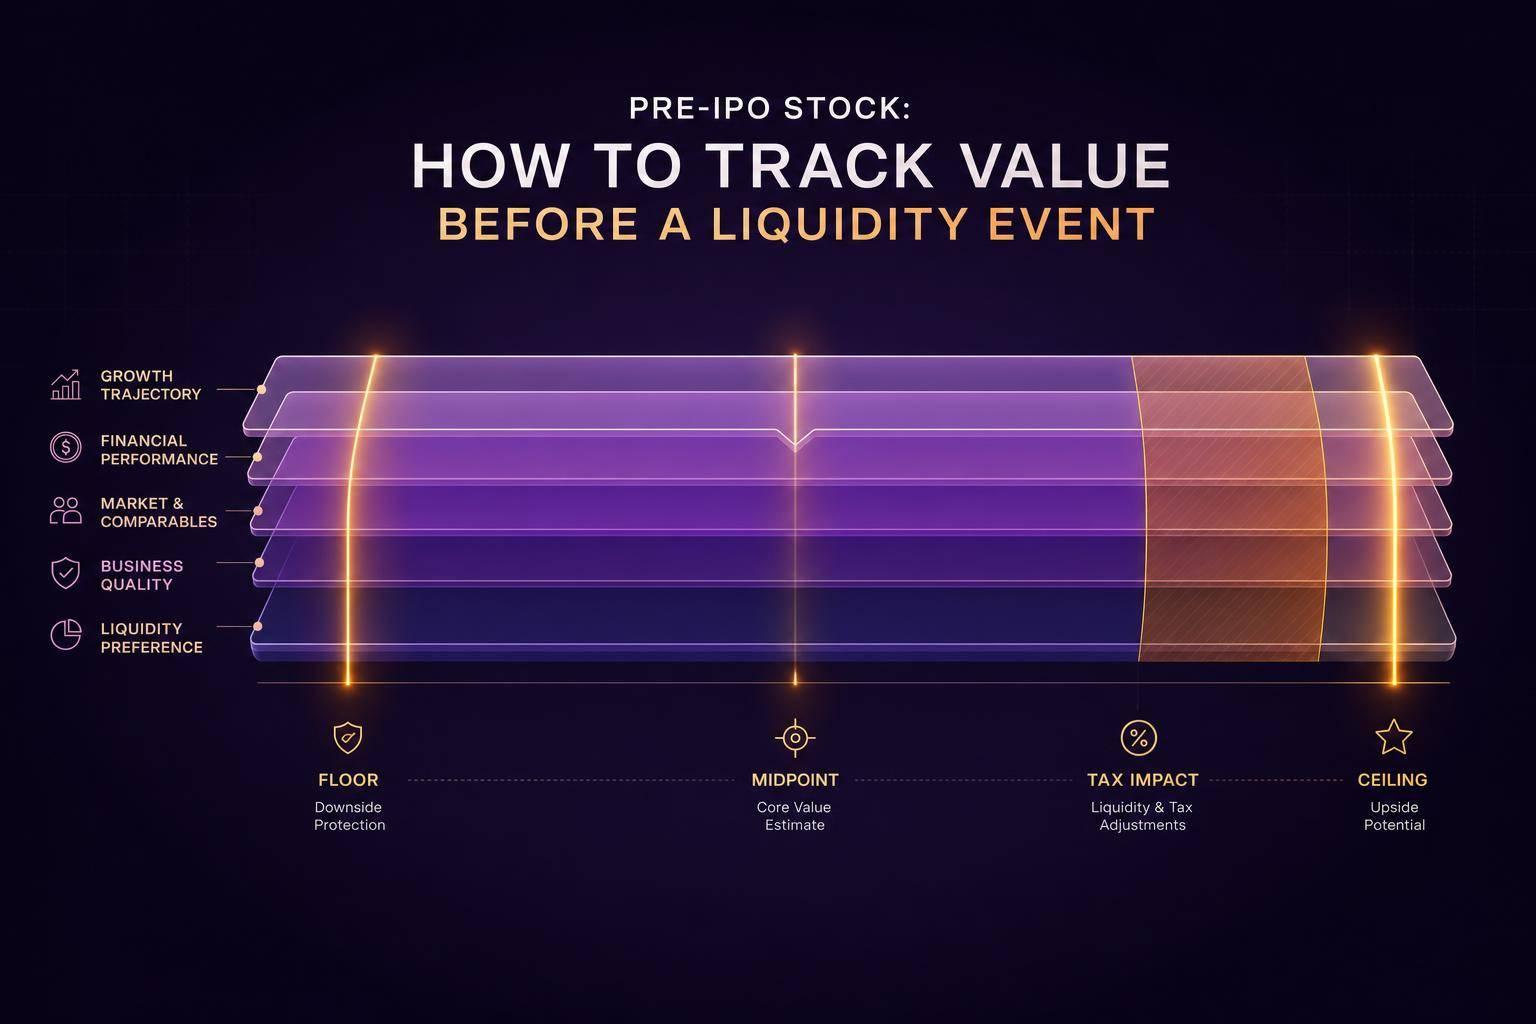
Pre-IPO stock may be best tracked as a range, not one price. If I hold private-company shares or options, I may look at four numbers at once: strike price, 409A value, last preferred round price, and any secondary-sale price.
Here’s the short version:
- 409A may act as the low end
- Preferred round price may act as the high end
- Common stock may sit 20% to 50%+ below preferred because preferred shares may have extra rights
- Dilution may reduce my ownership over time, even if the per-share figure goes up
- Liquidation preferences may change what common stock receives in an exit
- Taxes may show up before liquidity, especially with ISOs, NSOs, and AMT
- Some people also apply a 20% to 35% illiquidity discount for net-worth planning
- If private-company equity is more than 50% of household net worth, concentration risk may be high
A simple way to think about it:
| Price point | What it may tell me |
|---|---|
| Strike price | What I may pay to exercise |
| 409A value | A conservative common-stock FMV used for tax purposes |
| Preferred round price | What outside investors last paid |
| Secondary-sale price | What a private buyer may pay, if a sale is allowed |
So instead of treating pre-IPO equity like a stock app quote, I may track a small dashboard with vesting, exercise cost, fully diluted ownership, liquidation stack, and tax estimate. That may give me a more grounded view for exercise timing, net-worth tracking, and downside planning.
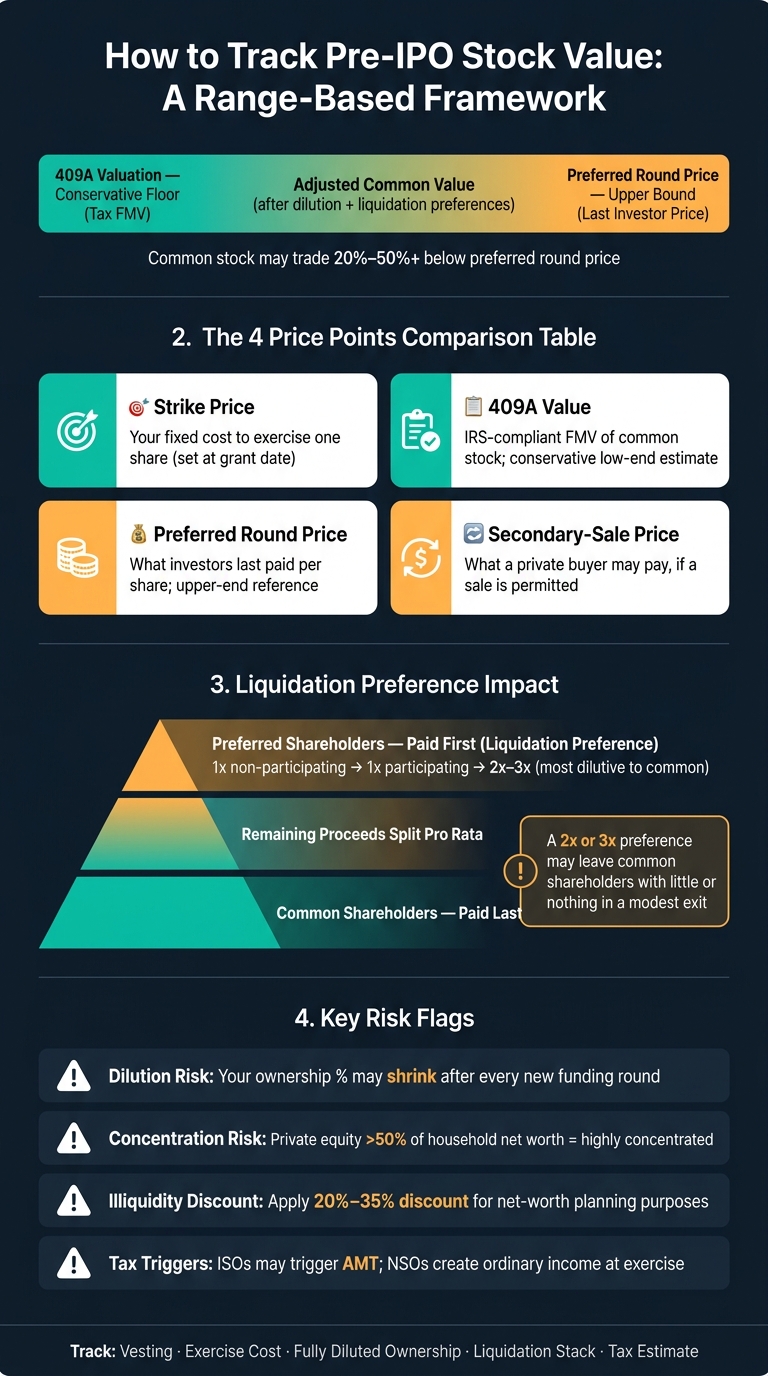
Pre-IPO Stock Value Range: 4 Key Price Points Explained
What a pre-IPO share is actually worth
A practical way to think about pre-IPO share value may be to start with two reference points: the 409A valuation and the last preferred round price. Then adjust from there for liquidation rights and dilution. That may give you a range that better reflects what common stock might be worth.
409A value vs. preferred round price
The 409A valuation is an IRS-compliant appraisal of the fair market value (FMV) of common stock. It is usually set on the conservative side, and its main purpose may be tax compliance, not estimating personal wealth. Because of that, many people treat it as the low end of the range.
The preferred round price is the per-share price investors paid in the most recent funding round. Many people use it as the upper end of the range for common stock, since preferred shares usually come with rights that common shares do not have.
Why common stock is usually worth less than preferred
This gap often comes down to economics and share rights.
Preferred shareholders generally get paid first through the liquidation preference. Common shareholders may receive value only after that preference stack has been covered. A 1x non-participating preference is on the lighter end: investors get their money back first, then may convert to common if that produces a better result. A 1x participating structure tends to favor investors more, because they may collect their full preference and then still share pro rata in what remains. A 2x or 3x preference may leave common shareholders with little or nothing in a modest exit.
Preferred stock also often includes liquidation preference and anti-dilution rights. Because of that, common shares may trade 20% to 50% or more below the last preferred round price. That spread may affect how someone thinks about exercising options, handling taxes, and estimating net worth.
So the headline price from the last round may not tell the whole story. Looking at both endpoints - the 409A as a conservative baseline and the preferred price as an upper bound - may give you a range that is closer to reality. Assuming the preferred price applies straight to common shares is one of the most common mistakes pre-IPO equity holders make. The next step may be to track the inputs that move that range.
Data points to track
Once you have a floor and ceiling, the next step is to track the inputs that may move that range.
Ownership and dilution inputs
Your grant agreement usually lists the grant type, share count, strike price, and vesting schedule. Most startups use four-year vesting with a one-year cliff.
What it often does not include is your fully diluted share count. That means all issued shares, unexercised options, warrants, and convertible instruments such as SAFEs and convertible notes. That number may be the right denominator when you're trying to estimate your ownership percentage. If you don't have it, ask HR or Finance directly. Ownership may shrink after each funding round as new shares are issued, so your per-share value may rise while your share of the company gets smaller in the background.
Then compare your ownership stake with the claims that sit ahead of common stock.
Capital stack and company performance signals
Track the liquidation preference stack in the Certificate of Incorporation. Each new preferred class may push common stock farther down the payout waterfall.
It also may help to watch revenue growth, burn rate, and fundraising activity through all-hands meetings, internal dashboards, and board updates. Those signals may shape how investors price the next round and may shift your implied range.
Here are the main inputs, where people often find them, and how often they may change:
| Input | Why It Matters | Where to Find It | Update Frequency |
|---|---|---|---|
| Latest 409A | Current common-stock FMV | Equity portal (Carta, Shareworks) or Finance team | Annually or after a material event |
| Preferred round price | Most recent preferred-share issue price | Press releases, Crunchbase, or Finance team | Only when the company raises a new round |
| Strike price | Your fixed cost to exercise one share | Stock option grant agreement | Fixed at grant date |
| Fully diluted share count | All shares, options, warrants, and convertibles outstanding | Cap table (request from HR or Finance) | With every new round or option pool expansion |
| Liquidation preferences | Investor payout priority before common shareholders receive anything | Certificate of Incorporation | When new preferred share classes are created |
| Vesting status | How many shares you've actually earned to date | Equity management portal or grant notice | Monthly (after the one-year cliff) |
| Operating signals | Revenue, growth rate, burn rate, and key milestones | All-hands meetings, internal dashboards | Monthly or quarterly |
Also check your post-termination exercise window. Many companies give you 90 days to exercise vested options after you leave.
Keeping these inputs in one place may make updates easier after each financing event.
Use cap table records to build a simple tracking dashboard
Put the key inputs in one dashboard, then update that same file after each financing event. That way, one change may update the whole picture at once. Over time, the dashboard may show how 409A, preferred price, dilution, and vesting shift your value range.
Where to pull the numbers
Your grant agreement includes the fixed details:
- strike price
- total shares granted
- vesting commencement date
- post-termination exercise window
Log into your equity portal - such as Carta or Shareworks - to confirm your current vested share count and latest 409A value. These portals also include exercise calculators for ISO AMT or NSO withholding.
Request the fully diluted share count from HR or Finance. Without it, your ownership percentage may be off. It also makes sense to cross-check that number against your grant notice to reduce the chance of exercise or tax mistakes.
How to structure the dashboard
Track your low, midpoint, and high estimate in one place. Use the same dashboard each time so shifts in valuation, dilution, and vesting appear side by side.
| Dashboard Field | Source | Update Frequency |
|---|---|---|
| Valuation Date | Manual entry | Quarterly or after a material event |
| Low Estimate (409A) | Carta / Shareworks / Finance team | Annually or after a new funding round |
| Adjusted Common Value | Modeled common-stock value after dilution and liquidation preferences | Quarterly |
| High Estimate (Preferred Price) | Financing documents / company updates | After each new funding round |
| Vested Shares | Equity portal | Monthly or quarterly |
| Unvested Shares | Grant agreement / equity portal | Monthly or quarterly |
| Exercise Cost | Vested shares × strike price | When vested share count changes |
| Fully Diluted Ownership % | Cap table from Finance team | After each new round |
| Estimated Net Value | (Vested shares × adjusted value) − exercise cost − estimated tax | Quarterly |
| Event Notes | Personal tracking | Ongoing |
Use Event Notes to mark things like upcoming vesting cliffs, tender windows, or IPO timelines. Those dates may shape when decisions come up.
Update the dashboard quarterly and after any material event. That range may give you a clearer way to think about whether you may exercise, hold, or wait.
Translate the value range into planning decisions
Once your dashboard shows a range, you may use it to think through whether to exercise, hold, or wait. The low, midpoint, and high estimates may serve as planning anchors for exercise timing, taxes, and concentration risk.
Exercise and tax planning before liquidity
Start with the bear case, then test the exercise cost and tax exposure against that lower estimate. A higher 409A may increase the taxable spread at exercise. ISOs may trigger AMT, and NSOs may create ordinary income on the spread. If your company qualifies as QSBS under Section 1202, holding shares for five years after exercise may exclude up to 100% of federal capital gains on up to $10 million in gains. That five-year clock starts at exercise. It also makes sense to check your post-termination exercise deadline before taking action.
Use these three estimates as planning anchors:
- Bear: 409A or lower for downside planning
- Base: adjusted common value for exercise timing
- Bull: last preferred price for upside only
That’s why common stock may be valued after preferred claims, not at the last round price.
Net worth and concentration risk
Pre-IPO equity may belong in its own category on your net worth statement, separate from investable assets. When illiquid equity gets mixed in with investable assets, your financial picture may look stronger than it actually may be.
If private equity represents more than 50% of your household net worth, the position may be considered highly concentrated. For household planning, some people use the bear-case estimate instead of the midpoint. A 20%–35% illiquidity discount may be applied on top of any common-stock estimate. That adjusted figure may be the number used for planning.
Conclusion: Track a range, not a single number
Pre-IPO equity may not have one exact value. It may make more sense to think in terms of a range.
The 409A may serve as a conservative floor, and the latest preferred price may act as the ceiling. But those numbers may work best as bounds, not as a final answer, because dilution and liquidation rights may shift what the shares are worth in practice.
Between those two anchors, dilution and liquidation rights may do most of the heavy lifting. After each material event, some people update the dashboard again. That range may be the one that's more useful for planning.
The point may be to build a usable range for exercise, tax, and net-worth planning, not a made-up unrealized value. Pre-IPO equity may be more useful to model as a range, not a quote.
FAQs
How do I estimate common stock value between 409A and preferred price?
Treat the 409A as a conservative floor for common stock, and the preferred price as a higher value that may reflect investor rights. Common stock often trades at a 30% to 70% discount to the latest preferred price.
A practical starting point may be the latest 409A. From there, some people track that discount over time, watch any secondary activity, and factor in where they sit in the capital structure. The result may be more useful as a planning estimate, not a guaranteed cash value.
What should I ask HR or Finance for to track my pre-IPO equity?
Ask HR or Finance for the key records that may let you match your own notes to the company’s official numbers:
- Fully diluted share count
- Most recent 409A valuation report
- Your grant details and current vesting status
- Historical fair market value (FMV) data
If there’s no equity management portal, these documents may be even more useful for tracking your equity over time.
When does it make sense to exercise pre-IPO stock options?
Exercising may make sense when you have a clear plan for the costs and risks involved. That may include the exercise price, possible taxes, and the company’s outlook. Common trigger points may include major life events or getting close to the end of your exercise window after leaving the company.
It may rarely make sense to exercise if your strike price is above the current 409A valuation. Before making a decision, some people model different exit scenarios and speak with a tax professional, especially about AMT on ISOs.
Related Blog Posts
Table of Contents
Book Free Consultation
Walk through Mezzi with our team, review your current situation, and ask any questions you may have.