
If I boil this down, here’s the short version: Bill Bengen’s updated number is 4.7%, Morningstar’s current estimate is 3.9%, and your own rate may land somewhere else once taxes, fees, account mix, time horizon, and spending flexibility are added in. On a $1,000,000 portfolio, that may mean $47,000 vs. $39,000 in year-one withdrawals - a gap of $8,000 before tax.
Here’s what I’d want to know at a glance:
- 4.7% = a historical worst-case floor from Bengen’s backtests
- 3.9% = a forward-looking estimate from Morningstar’s market models
- Your number = a personal figure tied to taxes, fees, portfolio mix, and how much spending may change in weak markets
- Same portfolio, different result = net spending may vary a lot based on whether money comes from Roth, taxable, or tax-deferred accounts
- Fixed spending vs. flexible spending = people open to small cuts in bad years may start higher than people who want the same inflation-adjusted amount every year
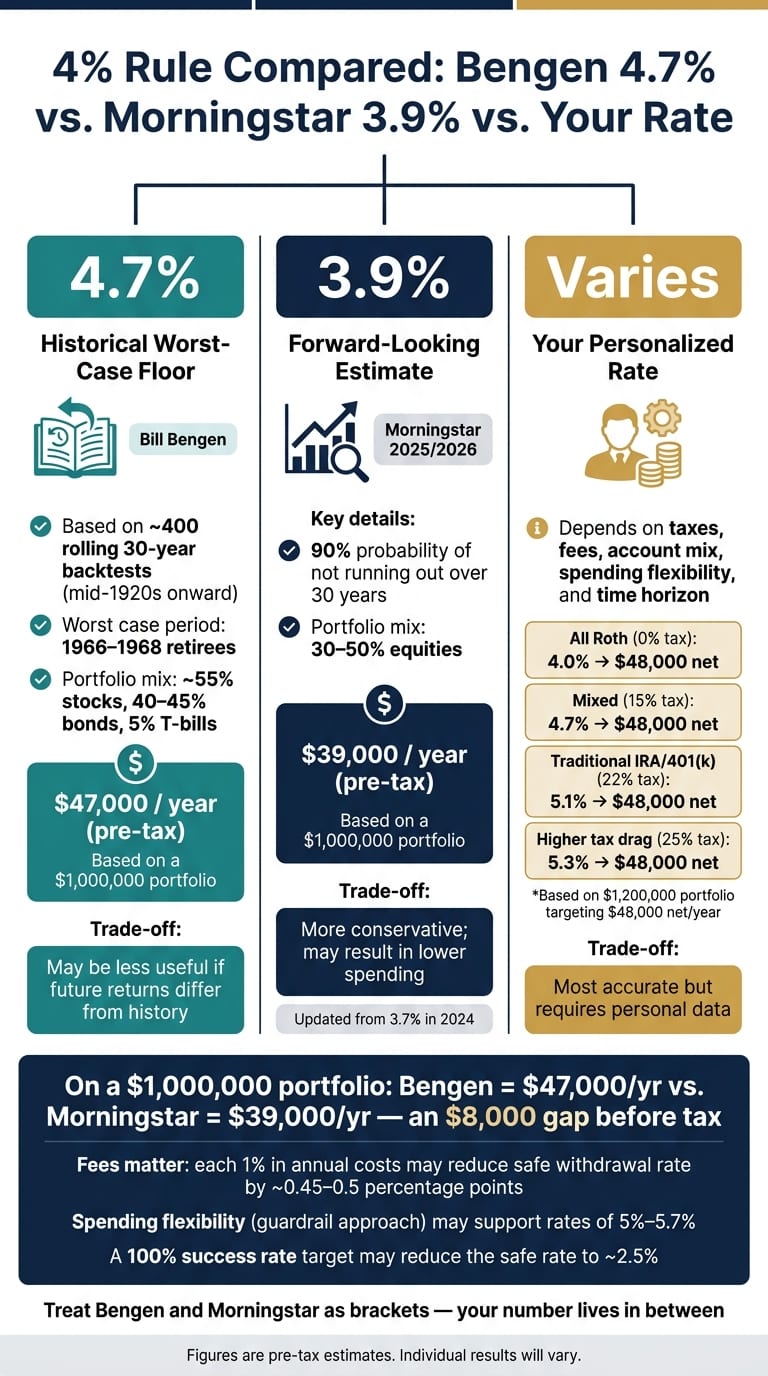
Safe Withdrawal Rates for Retirement in 2026
Quick Comparison
So the takeaway may be simple: 4%, 4.7%, and 3.9% are not direct substitutes. They answer different questions. I’d treat them as bookends, then test what fits my own plan.
1. Bill Bengen's 4.7% Safemax
Bengen later expanded his original 1994 model. That first version used a two-asset mix of U.S. large-cap stocks and intermediate-term U.S. Treasuries. In the updated version, he widened the portfolio to seven asset classes by adding mid-, small-, and micro-cap U.S. stocks, international stocks, and T-bills. With that broader mix, the historical safe rate moved up.
To get there, Bengen backtested about 400 rolling 30-year retirement periods starting in the mid-1920s. He looked for the highest inflation-adjusted withdrawal rate that lasted through each period. Then he took the lowest result from the full set - the worst case - and labeled that result SAFEMAX. That worst case goes back to retirees who started around 1966–1968, when weak early returns and high inflation showed up together.
One detail matters here: only one scenario needed a 4.7% withdrawal rate to make it through 30 years, while the cohort average was about 7%. So 4.7% may be better viewed as a floor from a historical stress test, not as a spending suggestion. Bengen has also said that, in more typical conditions, a starting rate of about 5% to 5.5% may be reasonable. In this comparison, 4.7% stands as the historical high-water mark.
The 4.7% figure assumes:
- A 30-year retirement horizon
- A diversified portfolio with about 55% stocks, 40%–45% bonds, and 5% cash or T-bills
- Annual rebalancing
- Inflation-adjusted withdrawals after year one
In dollar terms, a 4.7% starting withdrawal may look like this across common U.S. portfolio sizes.
These figures are pre-tax, so spendable income may be lower for money coming from tax-deferred accounts. And for retirees planning around a longer time frame or a more conservative mix, 4.7% may make more sense as an upper limit to scale down from, not a number to aim for directly.
Morningstar's 3.9% looks at the same core problem, but through a different lens: forward-looking instead of historical.
2. Morningstar's 3.9% Starting Withdrawal Rate
Morningstar uses forward-looking capital market assumptions rather than historical backtests. That approach may make its estimate more conservative than Bengen's historical stress-test method.
Morningstar defines 3.9% as the highest first-year withdrawal a new retiree may take while keeping a fixed, inflation-adjusted withdrawal for 30 years, with a 90% probability of still having money left at the end of that period. Put another way, the portfolio may need to survive 9 out of 10 simulations. The framework assumes a diversified portfolio with about 30%–50% in equities.
Morningstar revised the rate from 3.7% in 2024 to 3.9% in its latest 2025/2026 research. So 3.9% may be better viewed as a snapshot of the current market setting, not a permanent rule.
In dollar terms, here's what 3.9% may look like across common U.S. portfolio sizes in year one:
These figures are pre-tax gross amounts. After taxes, especially for withdrawals from traditional IRAs or 401(k)s, spendable income may be lower.
The 3.9% rate may fit retirees who want a predictable, inflation-adjusted income stream and who may be comfortable with a small chance of running short later in life. Retirees looking for a 100% success rate may see the safe rate fall to about 2.5%, while those open to cutting spending in weak market years may be able to support higher withdrawals with flexible methods. Morningstar notes that guardrail-style approaches may support rates closer to 5% to 5.7%. Once taxes, fees, asset mix, and spending flexibility are added in, a person's own rate may look different.
3. Your Personalized Withdrawal Rate
Neither benchmark reflects your account mix, tax situation, or how much flexibility you may have in your spending. Your withdrawal rate may come from a mix of portfolio allocation, taxes, spending needs, time horizon, and risk tolerance, and it may end up well above or below either reference point.
The main variables include asset allocation, sequence risk, fees, taxes, and spending flexibility. Income sources like pensions or Social Security may also shape the picture. So may your mix of taxable, tax-deferred, and Roth accounts, along with whether you may be willing to spend less during a rough market year. Two households with the same $1,000,000 portfolio may still land on very different withdrawal rates based on how those assets are structured. Here’s a simple illustration:
Illustration based on a $1,200,000 portfolio targeting $48,000 in net annual spending. Figures are estimates and will vary by household.
Taxes may move the gross withdrawal rate from 4.0% to 5.3% even when the underlying $48,000 spending target stays the same. That’s why a gross withdrawal rate and net spending amount are not the same thing. And it’s also why broad planning ranges may say more than one fixed number.
Vanguard's research offers a practical frame: a prudent initial withdrawal range of roughly 3.5%–5.5% per year may be reasonable depending on time horizon, asset allocation, and willingness to use dynamic spending rules. Retirees who may accept guardrail-style adjustments - spending a bit less when markets are weak - may support a higher starting rate than those who may need the same predictable income each year.
This may matter more for early retirees, uneven spending patterns, mixed account types, and uncertain Social Security timing. A tool like Mezzi may connect to your accounts and stress-test your withdrawal rate against taxes, fees, and asset mix. Those are the variables most closely associated with where your withdrawal rate may land.
What Actually Changes Your Withdrawal Rate
These numbers vary because each model is trying to answer a different question. Bengen looks at historical worst-case periods. Morningstar looks ahead with simulations. And your own withdrawal rate may depend on things like taxes, fees, spending flexibility, and how long the money may need to last. So the big shift usually isn't the headline number. It's the assumptions underneath it.
Fees matter. Each 1% in annual costs may reduce a safe withdrawal rate by about 0.45 to 0.5 percentage points. Put another way, a 1% cost load may move a plan from 4.7% down toward the low 4% range.
Sequence risk matters most early in retirement. If the market drops in the first few years, the portfolio may end up supporting less over time. That's because withdrawals during a downturn may lock in losses before the portfolio has much time to recover. This is why withdrawal rules may matter just as much as portfolio returns.
Spending flexibility changes the math. Guardrail plans allow small spending cuts in weak markets, which may support a higher starting rate than a fixed, inflation-adjusted withdrawal. Dynamic guardrails set a target rate with upper and lower spending bands, then trigger modest adjustments when either limit is crossed. On a $1,000,000 portfolio, the gap between a fixed approach and a flexible one may reach $14,000 per year.
Social Security timing adds another layer. Say a couple may need $80,000 per year but may receive $40,000 from Social Security and a pension. In that case, the portfolio may only need to cover the other $40,000. On a $1,000,000 portfolio, that works out to a 4% withdrawal rate instead of 8%. Delaying Social Security may reduce pressure on the portfolio later, even if it means higher withdrawals before benefits begin. That bridge period may need to be part of the plan.
The next step is figuring out which of these levers may have the biggest effect on your situation.
Pros, Cons, and How to Choose
Each option answers a different question: historical safety, forward-looking caution, or personal fit.
Some people may prefer the historical floor. Others may lean toward the more conservative estimate. And some may want a rate shaped around their own tax picture, account mix, and portfolio details.
Your starting point may depend on a few practical things:
- How much certainty your plan may call for
- How much spending flexibility you may have
- How much tax drag your withdrawals may create
A personalized rate may reflect the inputs covered earlier in a way a generic rule may not. Mezzi may analyze your full account picture - taxable, traditional, and Roth - so your withdrawal rate may reflect actual taxes, fees, and holdings, not just a one-size-fits-all number.
That leaves the last question: which number belongs to your plan?
Conclusion
The 4% rule may no longer be just one number. Today, the range may start with Bengen's 4.7%, Morningstar's 3.9%, and then move to your own rate. The main question may not be which number looks right in theory, but which one may fit your retirement plan.
Those gaps may compound over time.
It may make more sense to treat Bengen and Morningstar as brackets, not fixed rules. Your number may depend on taxes, fees, asset mix, spending flexibility, and how long retirement may last. That’s why a range may be a more useful starting point, followed by a stress test built around your own situation.
If your spending may flex during weak markets, your starting rate may be higher.
Mezzi may let you stress-test your withdrawal rate against your actual accounts, taxes, and allocation, with the goal of turning a rule of thumb into a plan. A common approach may be to start with the published benchmarks, then refine them using your own data.
FAQs
Which number should I start with?
Start with a personalized withdrawal rate, not a one-size-fits-all benchmark. Static rules like the 4% guideline may miss details that shape the picture, like your age, tax bracket, retirement timeline, and how much flexibility you may have in your spending.
AI-driven analysis may let you test different withdrawal rates against your actual finances and market conditions. That may give you a plan that feels more tailored, more flexible over time, and more tax-aware.
How do taxes change my withdrawal rate?
Taxes may raise the gross withdrawal needed to cover an after-tax spending goal. If money comes from a traditional tax-deferred account, that withdrawal may be taxed as ordinary income, so a larger amount may be needed. Roth withdrawals may cover the same spending need without adding taxable income.
A tax-efficient withdrawal plan lines up different account types with the goal of keeping income within target tax brackets and limiting spikes that may increase taxes, Medicare surcharges, or Social Security taxation.
Can flexible spending let me withdraw more?
Yes. A more flexible spending approach may let some retirees withdraw more than they might under a rigid fixed rule.
Here’s the basic idea: instead of sticking to one set withdrawal rate every year no matter what the market does, withdrawals shift with market performance.
When markets are strong, you may be able to take out more - for example, moving toward a 5% withdrawal rate. When markets fall, you may reduce withdrawals with the goal of helping protect your portfolio for a longer period.
Disclosures:
- This content is for informational purposes only and does not constitute investment advice or a recommendation to buy or sell any security.
- Past performance is not indicative of future results. No guarantee of future performance or outcomes is implied.
- Savings and performance examples are hypothetical and for illustrative purposes only. Actual results will vary based on individual circumstances, portfolio composition, market conditions, and fees.
Related Blog Posts
- What portfolio value and withdrawal strategy would generate a specific monthly after-tax income?
- Retirement Planning at 50: How to Assess If You Have Enough
- Chubby FIRE: Comfortable Early Retirement Between Lean and Fat
- Guardrails Withdrawals: How to Spend 5%+ Without Running Out
Start with a personalized withdrawal rate, not a one-size-fits-all benchmark. Static rules like the 4% guideline may miss details that shape the picture, like your age, tax bracket, retirement timeline, and how much flexibility you may have in your spending.
AI-driven analysis may let you test different withdrawal rates against your actual finances and market conditions. That may give you a plan that feels more tailored, more flexible over time, and more tax-aware.
Taxes may raise the gross withdrawal needed to cover an after-tax spending goal. If money comes from a traditional tax-deferred account, that withdrawal may be taxed as ordinary income, so a larger amount may be needed. Roth withdrawals may cover the same spending need without adding taxable income.
A tax-efficient withdrawal plan lines up different account types with the goal of keeping income within target tax brackets and limiting spikes that may increase taxes, Medicare surcharges, or Social Security taxation.
Yes. A more flexible spending approach may let some retirees withdraw more than they might under a rigid fixed rule.
Here’s the basic idea: instead of sticking to one set withdrawal rate every year no matter what the market does, withdrawals shift with market performance.
When markets are strong, you may be able to take out more - for example, moving toward a 5% withdrawal rate. When markets fall, you may reduce withdrawals with the goal of helping protect your portfolio for a longer period.