When it comes to dividend-focused ETFs, COWZ, SCHD, and VTV each cater to different investment goals. Here’s what you need to know:
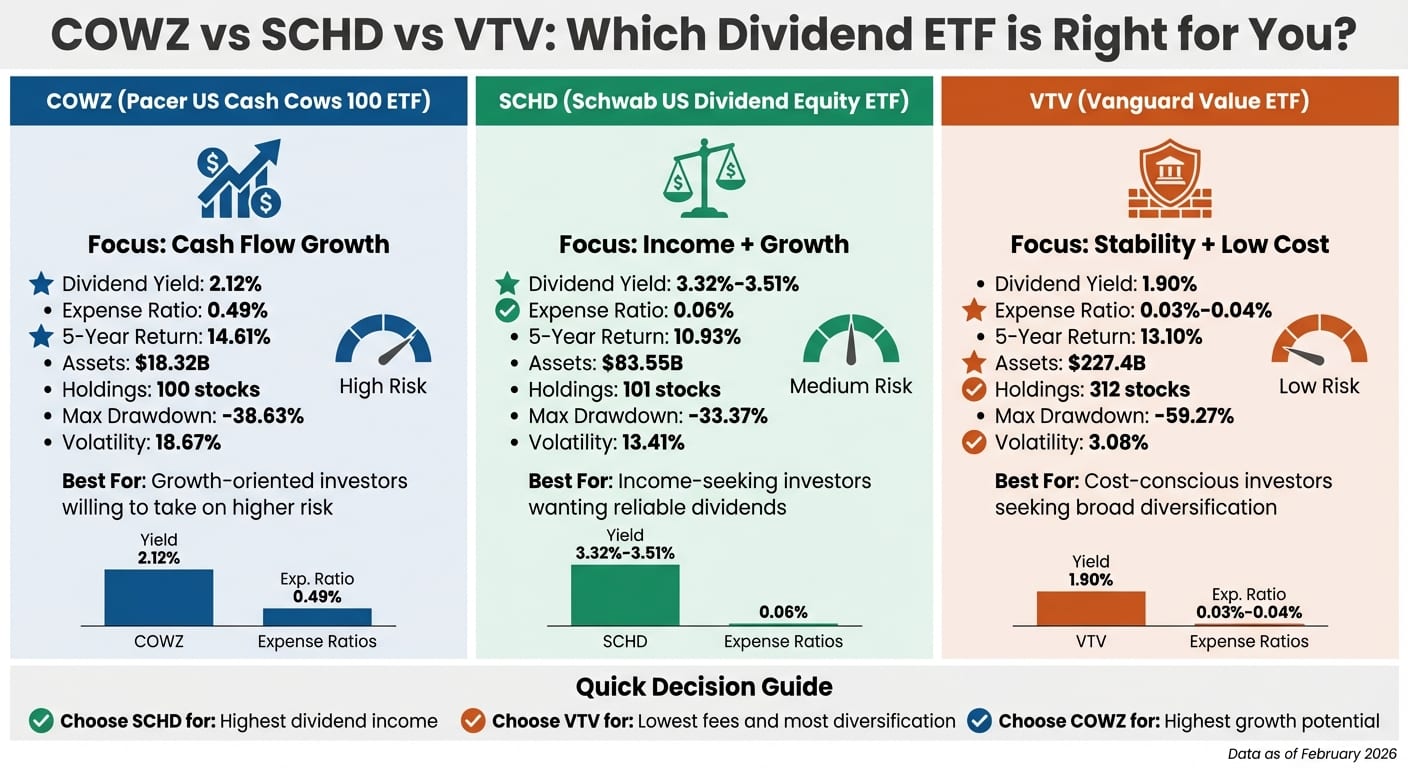
- COWZ: Focuses on free cash flow, targeting companies with strong cash generation. It offers higher growth potential but comes with higher fees (0.49%) and volatility. Dividend yield: ~2.12%.
- SCHD: A top pick for income-seeking investors. It prioritizes companies with strong dividend histories, offering a 3.32%–3.51% yield and low fees (0.06% expense ratio). Balanced between income and growth.
- VTV: Best for cost-conscious investors looking for stability. It has the lowest fees (0.03%) and broad diversification across 312 holdings. Dividend yield: ~1.90%, with a focus on steady, long-term growth.
Quick Comparison
SCHD is ideal for reliable income, VTV for low-cost diversification, and COWZ for growth-oriented investors willing to take on more risk. Choose based on your priorities: income, cost, or growth potential.
COWZ: Pacer US Cash Cows 100 ETF
What COWZ Offers
COWZ focuses on free cash flow as a key metric, rather than traditional measures like the price-to-earnings ratio. It identifies the top 100 companies within the Russell 1000 Index that generate the highest cash flow relative to their enterprise value, using trailing twelve-month free cash flow for weighting.
The selection process starts with the 400 largest companies in the Russell 1000, excluding financial firms (except real estate) and companies with projected negative cash flow over the next two years. This approach zeroes in on "cash cows" - businesses producing more cash than they need for operations, enabling them to pay dividends, repurchase shares, or fund acquisitions.
"Free cash flow is the cash remaining after a company has paid expenses, interest, taxes, and long-term investments. It can be used to buy back stock, pay dividends, or participate in mergers and acquisitions." – Pacer ETFs
As of February 18, 2026, the fund's largest sector allocations include Health Care (23.09%) and Energy (18.45%), emphasizing industries known for generating strong cash flow. Some of its top holdings are Newmont Corp (2.54%), Exxon Mobil Corp (2.43%), Gilead Sciences Inc (2.34%), Chevron Corp (2.31%), and Merck & Co Inc (2.29%). The ETF rebalances quarterly, with an annual portfolio turnover rate ranging from 77% to 151%. For investors seeking long-term growth with a focus on financial strength, COWZ's emphasis on cash flow provides a distinct investment strategy.
COWZ Performance Numbers
COWZ's free cash flow strategy is reflected in its performance metrics. The ETF has an expense ratio of 0.49%, manages approximately $18.32 billion in assets as of February 2026, and offers a dividend yield of around 2.12%. Its underlying index boasts a free cash flow yield of 6.08% as of December 31, 2025, which is more than double the 3.01% yield of the Russell 1000 Value Index. Additionally, COWZ's price-to-earnings ratio is 16.30, significantly lower than the Russell 1000 Value Index's 21.08.
Over the past five years, COWZ has achieved an annualized return of 14.61% as of December 31, 2025. However, this performance comes with higher volatility, reflected in an 18.67% annualized volatility rate and a maximum drawdown of –38.63% since its inception. The ETF's 1-year Sharpe ratio of 0.65 highlights its relatively lower risk-adjusted returns compared to some alternatives.
Who COWZ Works Best For
COWZ is designed for investors who prioritize long-term cash flow growth over immediate income. With a dividend yield of 2.12%, which is lower than SCHD's yield of 3.32%–3.51%, it may not appeal to those seeking maximum current income.
"COWZ's strategy appeals to investors prioritizing long-term value creation over immediate income." – Victor Hale, AI Writing Agent, AInvest
This ETF is particularly suitable for risk-tolerant investors with long investment horizons who can handle higher volatility and more significant drawdowns. Analysts often suggest using COWZ as a satellite holding alongside lower-volatility core ETFs to capture growth opportunities in cyclical, cash flow–focused sectors like energy and healthcare.
SCHD: Schwab US Dividend Equity ETF
What SCHD Offers
SCHD follows the Dow Jones U.S. Dividend 100 Index, focusing on companies with a strong dividend track record and solid financial health. By analyzing financial ratios, the fund ensures that dividends are sustainable, steering clear of speculative companies whose high yields might result from falling stock prices.
"The underlying index methodology requires a long track record of distributions, meaning that this product is unlikely to include small, speculative firms that are offering an attractive distribution yield because their stock price has been depressed." – Analyst Report, ETFdb
As of February 13, 2026, SCHD's portfolio includes 101 stocks. Its top holdings feature well-known companies like Lockheed Martin Corp (4.72%), Texas Instruments Inc (4.33%), Verizon Communications Inc (4.31%), ConocoPhillips (4.28%), and Chevron Corp (4.26%). The fund leans heavily into sectors such as Energy (19.88%), Consumer Staples (18.50%), and Health Care (16.20%). With a portfolio turnover rate of 28.56% (as of January 31, 2026), SCHD maintains a stable structure. Notably, it executed a 3-for-1 share split on October 10, 2024, increasing the number of shares while keeping total investment value unchanged.
These selection criteria and a focus on quality companies contribute to SCHD's consistent performance.
SCHD Performance Numbers
SCHD's disciplined approach translates into strong performance metrics. The fund boasts an exceptionally low expense ratio of 0.06% and manages $83.55 billion in assets as of February 12, 2026, making it one of the largest dividend-focused ETFs. Investors benefit from a 30-Day SEC Yield of 3.40% and a trailing 12-month distribution yield of 3.51%.
The ETF's fundamentals are equally impressive, with a return on equity of 24.66% and a price-to-earnings ratio of 18.66x. Risk metrics show moderate volatility, with a 3-year standard deviation of 13.41% and a beta of 1.00, aligning closely with its benchmark. Over the one-year period ending January 31, 2026, SCHD delivered an 11.31% total return, while its five-year annualized return stood at 10.93%. The fund started 2026 on a strong note, achieving a 15.24% total return as falling interest rates prompted investors to shift toward value and high-yield equity funds.
Who SCHD Works Best For
SCHD's combination of income and stability makes it an excellent choice for income-oriented investors seeking reliable cash flow along with long-term growth. Morningstar highlights it as one of the top dividend funds, praising its straightforward, risk-aware strategy. Its low 0.06% expense ratio and focus on companies with a long history of dividends make it particularly attractive to retirees and cost-conscious investors.
"Schwab US Dividend Equity ETF stands out for its sensible, transparent, and risk‑conscious approach that should generate better long‑term risk‑adjusted returns than the Russell 1000 Value Index." – Ryan Jackson, Senior Analyst, Morningstar
This ETF fits well as a core holding for U.S. equity exposure or as a high-yield addition to a broader market portfolio. However, investors should be mindful of tax considerations, as its emphasis on qualified dividends may influence whether it's better suited for taxable brokerage accounts or tax-deferred retirement accounts. SCHD's mix of steady income and growth potential aligns well with strategies that prioritize value-focused ETFs for consistent dividend returns and long-term financial goals.
VTV: Vanguard Value ETF
What VTV Offers
VTV takes a distinct approach among value ETFs, focusing on large-cap U.S. companies that are considered undervalued. It passively tracks the CRSP US Large Cap Value Index, selecting stocks based on five key value factors, such as price-to-earnings and price-to-book ratios. As of January 31, 2026, the fund holds 312 stocks with a median market cap of $154.7 billion.
The ETF leans on defensive sectors like Financials (22.10%), Industrials (16.70%), and Health Care (14.30%). Its top holdings include major players such as JPMorgan Chase & Co. (3.24%), Berkshire Hathaway Inc. (3.03%), and Exxon Mobil Corporation (2.41%). With a portfolio turnover rate of just 8.8%, VTV minimizes internal trading costs, ensuring a stable investment structure.
"VTV offers low-cost, diversified exposure to U.S. large-cap value stocks, excelling in downside risk management and consistent, middle-of-the-road performance." – Seeking Alpha
Designed for long-term investors, VTV emphasizes capital growth and moderate income over aggressive price gains. Its high liquidity, with an average daily trading volume of 4.2 million shares, makes it easy to buy and sell.
VTV Performance Numbers
One of VTV’s standout features is its expense ratio, which is just 0.03% as of February 2, 2026 - much lower than the 0.86% average for similar funds. This reduction was part of Vanguard’s fee cuts in February 2026, saving investors an estimated $250 million across 84 share classes. The fund currently manages $227.4 billion in total net assets.
VTV provides a 30-day SEC yield of 1.95% (as of January 31, 2026) and an annualized forward yield of 1.91%. While its yield is lower than SCHD's 3.32%, VTV makes up for it with stronger capital appreciation, delivering a one-year return of 18.09% and an annualized 10-year return of 13.10%.
From a risk perspective, VTV shines with a beta of 0.80 compared to the Dow Jones U.S. Total Stock Market Index, making it about 20% less volatile than the overall market. Its one-month rolling volatility of 3.08% is also lower than SCHD's 3.69%, reflecting steadier price movements. The fund’s price-to-earnings ratio currently stands at 19.61.
Who VTV Works Best For
VTV is ideal for investors who prioritize stability and are cautious about risk, making it particularly appealing to retirees or those looking for dependable earnings with less exposure to high-growth sectors. Its broad diversification across 312 stocks reduces the risk tied to individual holdings, a key advantage over more concentrated dividend ETFs. The ultra-low 0.03% expense ratio is a major draw for cost-conscious, long-term investors.
For those seeking higher immediate income, VTV can be paired with funds offering better yields, as its yield of around 1.95% is lower than options like SCHD, which offers approximately 3.32%. The ETF Research Center assigns VTV an "OVERWEIGHT" rating, with an ALTAR Score of 6.3, placing it in the 68th percentile of its category due to its attractive valuations and solid fundamentals.
Side-by-Side Comparison
Comparison Table: Yields, Fees, and Returns
When comparing SCHD, VTV, and COWZ, each ETF stands out in specific ways. SCHD offers a solid 3.32% yield, which is almost double the 1.90% yield of VTV. To put this into perspective, a $100,000 investment in SCHD generates about $3,320 annually, compared to $1,900 from VTV. On the other hand, VTV excels in cost efficiency with an expense ratio ranging from 0.03% to 0.04%, narrowly beating SCHD's 0.06%. Meanwhile, COWZ has a much higher expense ratio at 0.49%, translating to $490 annually on a $100,000 portfolio - over 8 times SCHD's cost and 12 times VTV's, which range from $30 to $40.
Looking at growth, VTV shines with a 5-year annualized return of 13.30% and a stronger Sharpe ratio, showcasing better risk-adjusted returns. While COWZ has higher fees, its performance remains competitive. SCHD sits in the middle, offering a blend of a strong 3.32% yield and solid total returns, appealing to those seeking a balance between income and growth.
Here's a quick breakdown of the key metrics:
Each ETF caters to different investor priorities, whether it's generating immediate cash flow, achieving long-term growth, or minimizing costs.
Sector Exposure and Risk Profiles
Sector Allocation Breakdown
The sector allocation of each ETF plays a key role in shaping its performance, risk level, and income consistency. VTV takes a diversified approach, with Financials making up the largest share at 22.10% (as of January 31, 2026). Industrials follow at 16.70%, and Health Care rounds out the top three at 14.30%. This broad allocation spans over 300 holdings, making VTV the most diversified among the three ETFs. Such diversification aligns with its large-cap value strategy, creating a distinct risk profile.
SCHD, on the other hand, leans toward defensive sectors known for stable dividend payouts. As of December 31, 2025, Energy leads its portfolio at 19.88%, followed by Consumer Staples at 18.50% and Health Care at 16.20%. Notably, SCHD limits its exposure to Technology stocks, with only 8.20% of its portfolio allocated to this sector. This approach helps reduce the volatility often associated with high-valuation tech companies.
COWZ takes a different route, focusing on firms with strong free cash flow. This strategy often results in greater exposure to cyclical sectors like Information Technology, Energy, and Consumer Discretionary.
While VTV and SCHD share 36% of their holdings by weight, their sector emphasis differs significantly. VTV is heavily weighted in Financials, holding major positions in companies like JPMorgan Chase and Bank of America, areas where SCHD is underweight. Both ETFs maintain minimal Technology exposure, reinforcing their focus on traditional value sectors. As ecconomi.com highlights, "The low technology exposure in both ETFs is crucial. When looking for a true value ETF, the whole point is to protect yourself from higher tech or AI-heavy ETFs."
These allocation choices directly influence the unique risk profiles of each ETF, as explored in the following breakdown.
Risk Metrics Breakdown
The sector allocation strategies translate into varied risk characteristics for each ETF. VTV leads in risk-adjusted performance, with a Sharpe ratio of 1.16 and a Sortino ratio of 1.67. It also has the lowest volatility at 3.08%, compared to 3.69% for both SCHD and COWZ. However, its long history includes a maximum drawdown of -59.27%, largely due to the 2008 financial crisis.
SCHD offers a balanced risk profile, with a Sharpe ratio of 1.02 and a Sortino ratio of 1.50. Its maximum drawdown is significantly smaller than VTV's, at -33.37%, and it boasts the lowest average drawdown of -3.35% among the three ETFs.
COWZ, with its cyclical sector focus, carries the highest risk. It has a Sharpe ratio of 0.65 and a Sortino ratio of 1.02. Its maximum drawdown stands at -38.63%, and it has the highest Ulcer Index (5.58%), which measures both the depth and duration of price declines.
Here’s a summary of the risk metrics:
Historical Performance Comparison
Historical Returns Table
Looking at long-term performance offers valuable insights into how these ETFs have navigated different market environments. Over the past five years, COWZ has led the pack with an annualized return of 13.87%, while SCHD and VTV followed with 10.75% and 13.23%, respectively. For the 10-year horizon, SCHD posted a 13.21% return, slightly edging out VTV at 12.97%. However, it’s worth noting that only VTV has a full 15-year performance record, as it launched in 2004. SCHD began trading in 2011, and COWZ entered the market in 2016. These differences in history provide context for their year-to-date and downturn performances.
Fast forward to February 20, 2026, SCHD has taken the lead with a 15.09% year-to-date return, outpacing VTV at 7.92% and COWZ at 6.56%. This shift highlights how changing market conditions can favor certain investment strategies over others.
When it comes to resilience during market downturns, each fund tells a different story. During the 2022 market decline, VTV fared better with a return of -2.09%, compared to SCHD, which posted -3.26%. However, looking at the bigger picture, VTV experienced a maximum drawdown of -59.27% since its inception in 2004, the steepest among the three funds. These metrics give dividend-focused investors a clearer picture of each ETF’s ability to weather market volatility while maintaining long-term viability.
Here’s a summary of the key performance and drawdown figures for easy comparison:
*VTV's maximum drawdown is calculated from its inception in 2004.
Add VTV Value ETF with SCHD for more gains
Which ETF Should You Choose?
Based on the analysis above, here are some ETF options tailored to different investment goals.
For Income-Focused Investors
If your main goal is generating reliable dividend income, SCHD stands out as a strong option. Its dividend yield is nearly double that of VTV's, making it particularly appealing for income-driven strategies. SCHD tracks the Dow Jones US Dividend 100 Index, focusing on companies with a history of consistent dividend payouts. This approach ensures you're investing in firms with a proven ability to maintain and grow their dividends. With a low expense ratio of 0.06% and an annualized return of 13.31%, SCHD offers a well-balanced mix of income and growth. It’s a solid choice for investors prioritizing steady dividend income.
For Stability and Low Costs
For those who value low expenses and reduced volatility, VTV is a great pick. Its expense ratio of just 0.03% makes it the most cost-efficient option among the three ETFs. Additionally, VTV’s volatility is lower at 3.08%, compared to SCHD’s 3.69%, which offers a smoother experience during market swings. With a portfolio of 312 stocks, VTV provides broad diversification, reducing concentration risk. Its 10-year annualized return of 13.10% proves that stability and affordability can still deliver strong long-term growth. This makes VTV an excellent option for conservative investors.
For Growth-Oriented Dividend Investors
If you're open to taking on more risk for greater growth potential, COWZ might be the right fit. This ETF focuses on companies with strong free cash flow, a strategy that supports both dividend sustainability and reinvestment for future growth. Its emphasis on cyclical sectors enables it to capture gains during economic upswings, but it also comes with higher volatility. COWZ is best suited for investors who are comfortable with sector rotation and the ups and downs that come with pursuing higher returns.
Using Mezzi to Improve Your ETF Strategy
Mezzi’s X-Ray feature can help you fine-tune your ETF portfolio by identifying hidden overlaps. For example, SCHD and VTV share a 0.94 correlation, meaning their price movements are closely linked, which could lead to unintended duplication. The X-Ray tool highlights such overlaps, enabling you to adjust allocations for better diversification. Additionally, Mezzi’s tax-efficient ETF investing tools can assist active ETF investors by preventing wash sales and maximizing tax-loss harvesting opportunities while maintaining market exposure.
Conclusion
Each ETF - COWZ, SCHD, and VTV - offers something distinct, catering to different investment goals. Whether you're prioritizing yield, cost efficiency, or growth potential, the right choice depends on what matters most to you. For investors focused on dependable dividend income, SCHD shines with its trailing twelve-month yield of 3.32% and a strong history of payouts from high-quality companies. If low costs and broad market exposure are your priorities, VTV stands out with its ultra-low expense ratio of 0.03% and a portfolio of over 300 stocks for maximum diversification. On the other hand, COWZ appeals to those seeking higher growth potential and are comfortable with added volatility due to its cash-flow-focused strategy.
Looking at performance, SCHD and VTV delivered nearly identical annualized returns of 13% over the past decade. However, SCHD's concentrated portfolio of around 100 stocks provided stronger downside protection, with a maximum drawdown of -33.37%, compared to VTV's -59.27%. This makes SCHD particularly appealing for retirees or anyone looking for a cushion during market downturns.
Interestingly, with a correlation of 0.94, SCHD and VTV tend to move together. This moderate overlap means they can complement each other in a portfolio - using SCHD for income and VTV for broader value exposure.
Lastly, tools like Mezzi's X-Ray feature can help uncover hidden overlaps between ETFs. Combined with its tax optimization tools, it can guide smarter allocation decisions and help reduce unnecessary tax liabilities, making your investment strategy even more efficient.
FAQs
How often do these ETFs pay dividends?
These ETFs issue dividends on a quarterly basis. For example, COWZ usually distributes dividends in March, June, September, and December. This predictable schedule aligns with other value-focused ETFs, offering a steady option for dividend investors looking for consistent income streams.
Which ETF is best for a taxable account vs an IRA?
For taxable accounts, COWZ could be a better option because it emphasizes companies with strong cash flow, often leading to higher dividend payouts that are taxed annually. On the other hand, SCHD tends to work well in IRAs, thanks to its focus on dividend growth and a low expense ratio, which make it more tax-efficient within tax-advantaged accounts. Essentially, COWZ fits taxable accounts, while SCHD is a solid choice for IRAs aimed at long-term growth and stability.
Can I hold SCHD and VTV without too much overlap?
Yes, you can hold SCHD and VTV together with minimal overlap. Only about 11.3% of SCHD’s holdings overlap with VTV, and their correlation is fairly high at 0.85. The key difference lies in their focus: SCHD targets dividend-paying stocks, applying quality and yield filters, while VTV tracks the broader CRSP US Large Cap Value Index. This distinction makes them a good pair, combining dividend income with broader value exposure in large-cap stocks.
Disclosures:
- This content is for informational purposes only and does not constitute investment advice or a recommendation to buy or sell any security.
- Past performance is not indicative of future results. No guarantee of future performance or outcomes is implied.
- Savings and performance examples are hypothetical and for illustrative purposes only. Actual results will vary based on individual circumstances, portfolio composition, market conditions, and fees.
- All links to external sources are provided for reference only.
Related Blog Posts
- SCHD vs VYM: dividend growth vs current yield for retirees.
- SCHD/VYM/DGRO head-to-head: dividend yields, 5/10-year dividend growth, fees, and top-10 overlap.
- SCHD vs VYM vs DGRO vs DIVO - Best dividend ETF for income + dividend growth
- SCHD vs DGRO: Dividend Growth ETF for Long-Term Compounders
These ETFs issue dividends on a quarterly basis. For example, COWZ usually distributes dividends in March, June, September, and December. This predictable schedule aligns with other value-focused ETFs, offering a steady option for dividend investors looking for consistent income streams.
For taxable accounts, COWZ could be a better option because it emphasizes companies with strong cash flow, often leading to higher dividend payouts that are taxed annually. On the other hand, SCHD tends to work well in IRAs, thanks to its focus on dividend growth and a low expense ratio, which make it more tax-efficient within tax-advantaged accounts. Essentially, COWZ fits taxable accounts, while SCHD is a solid choice for IRAs aimed at long-term growth and stability.
Yes, you can hold SCHD and VTV together with minimal overlap. Only about 11.3% of SCHD’s holdings overlap with VTV, and their correlation is fairly high at 0.85. The key difference lies in their focus: SCHD targets dividend-paying stocks, applying quality and yield filters, while VTV tracks the broader CRSP US Large Cap Value Index. This distinction makes them a good pair, combining dividend income with broader value exposure in large-cap stocks.