
A read-only tracker may show your portfolio. It may not show your next move.
If I connect my accounts to a tracker, I may get balances, returns, and allocation charts in one place. But that view may stop short when I want answers about wash sale risk, tax-loss harvesting, fund overlap, fee drag, or which account may be the better place for a holding.
Here’s the short version:
- A tracker may show what I own
- It may show how much I’m up or down
- It may show how my allocation looks today
- But it may not show whether a sale may trigger a wash sale
- It may not show whether an unrealized loss may have tax use
- It may not show how much overlap sits under similar funds
- It may not show the dollar cost of higher-fee holdings across the whole household
- And it may not show which moves may rebalance the portfolio with less tax impact
A few numbers make the gap easier to see:
- A -$3,600 loss may lose its tax use if a same-fund purchase happens within the 61-day wash sale window
- A $500,000 position in a 0.75% fund may cost about $3,750 per year, while a 0.03% ETF may cost about $150
- A portfolio that looks spread across several U.S. stock funds may still have a large share of its money tied to many of the same stocks
That’s the difference: a dashboard may report data, while read-only guidance may connect the data to a possible decision.
The #1 Investing Mistake High-Net-Worth Investors Make (Tax-Aware Investing Guide)
Quick comparison
If I want more than a portfolio snapshot, tracking alone may not be enough. This article explains where that gap may show up and how a read-only tool like Mezzi may focus on analysis rather than trade execution.
Where a Read-Only Tracker Falls Short for Real Portfolio Decisions
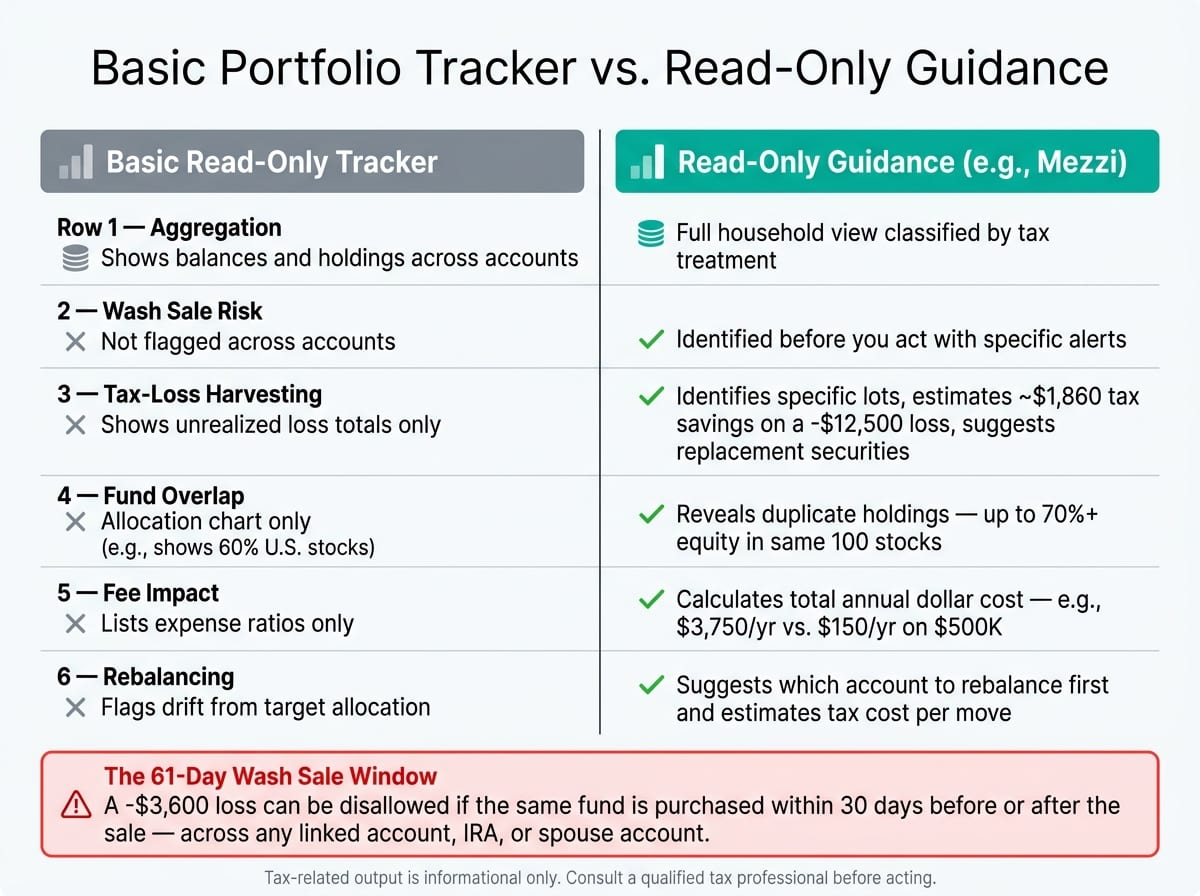
A read-only tracker may give you a clean snapshot of balances, holdings, and recent trades. What it may not do is point out tax mistakes, hidden concentration, or whether a paper loss has any tax use at all. The first gap tends to show up with taxes, where account-level details may matter more than a simple balance view.
Wash sale risk across accounts is easy to miss
The IRS wash sale rule disallows a realized loss if you, your spouse, or an IRA you control buys the same or a substantially identical fund within 30 days before or after the sale. That's a 61-day window total.
Here’s how that may play out in practice.
On 09/01/2026, Alex sells 300 shares of ABC Growth Fund in a taxable brokerage account, realizing a -$3,600 loss. On 09/10/2026, a pre-set automatic investment in Alex's traditional IRA buys 300 shares of the same fund. On 09/20/2026, Alex's spouse Sam buys 200 more shares of ABC Growth Fund in their own taxable account, hoping to buy the dip.
The tracker may show all three trades. But it may not flag that the IRA and spouse purchases trigger a wash sale and disallow the $3,600 loss.
Even when no wash sale gets triggered, a loss still may need more context before it has any use.
Seeing an unrealized loss is not the same as knowing what to do with it
A -$12,500 unrealized loss may only matter if it can be harvested. To figure that out, you may need to confirm a few things:
- Whether the shares have been held for more than one year
- Whether the position sits in a taxable account
- Whether any account in your household is already buying a substantially identical fund
A basic tracker may show the -$12,500. It may not tell you whether that loss may translate into about $1,860 in tax savings, or what replacement holding may keep your market exposure in place.
The same blind spot may show up in diversification and fee analysis.
Allocation charts miss overlap, fee drag, and what to do next
An allocation chart that shows 60% U.S. stocks may look nicely spread out. But the headline number may hide a lot.
Say your funds are an S&P 500 ETF, a total U.S. market index fund, and an active large-cap growth mutual fund. On paper, that may look like three different holdings. Under the hood, they may all lean hard on the same mega-cap names - Apple, Microsoft, and Amazon near the top. In some cases, 70% or more of your equity exposure may still sit in the same 100 stocks.
Fees may add another layer. A 0.75% fund costs far more than a 0.03% ETF. On a $500,000 allocation, that works out to about $3,750 per year versus $150 - a $3,600 annual gap that may add up over time. Most trackers show the expense ratio. They may not show lifetime cost, better-fit substitutes, or which account may fit each fund best.
That’s the core issue: a tracker may show the data, but it may not turn the data into a decision.
What Decision-Ready Guidance Looks Like
The missing piece may not be more data. It may be guidance that reads tax impact, overlap, and rebalancing together. A tracker may show the problem. Action-ready guidance may show the next move.
From aggregated data to tax-aware actions
Decision-ready guidance may start with a full household view, not one account in isolation. Account type may change the tax result of the same trade.
Lot-level analysis may show which shares are at a loss, whether that loss may be short-term or long-term, and whether another linked account may trigger a wash sale. It may also suggest a same or similar security as a replacement so market exposure may stay in place.
The same idea may apply to asset location. If a tax-inefficient holding, such as a high-turnover active fund or high-yield bond fund, sits in a taxable account, action-ready guidance may flag it and may suggest shifting that exposure into a traditional IRA or 401(k) over time. At the same time, it may place more tax-efficient index funds in taxable accounts.
Tracker display vs. read-only guidance: a side-by-side comparison
The table below shows the difference between a standard read-only tracker and read-only guidance.
The difference may come down to action.
That may be the gap between a dashboard and a read-only system built to produce tax-aware guidance.
How Mezzi Goes Beyond Tracking While Staying Read-Only
Here’s what that may look like in Mezzi.
What Mezzi can analyze that a basic tracker cannot
Mezzi connects to your existing accounts with read-only access. That means no transfers and no new accounts. The focus may be on analysis, not account control.
A basic tracker may show balances and performance. Mezzi goes further by looking at portfolio signals that a simple tracker may miss. It may flag cross-account wash sale risk before you act. It may point out tax-loss harvesting openings and possible replacement holdings. Its Portfolio X-Ray breaks funds into underlying holdings, spots overlap, and shows blended fees. It may also flag tax-inefficient holdings in the wrong account type and highlight account placement ideas over time.
Just as important, Mezzi may tell you what to do with those findings without taking control of your accounts.
What Mezzi does not do: guidance, not trade execution
Mezzi surfaces guidance only; you place the trades. If Mezzi identifies a tax-loss harvesting opening and you sell, it may notify you when the wash-sale window closes. Mezzi is guidance only, not execution.
Tax-related output is informational, not individualized tax advice; consult a qualified tax professional before acting.
Mezzi turns portfolio data into decisions without taking over your accounts.
Conclusion: If You Need Answers, Not Just Account Views, Tracking Alone Is Not Enough
A read-only tracker may work well for simple portfolios. But it usually stops at display, not decision.
The gap may show up once accounts start interacting. If cross-account trades erase a loss, the tracker may record each transaction without linking them to a tax risk. It may not flag that issue at all.
The same pattern may appear with tax-loss harvesting, overlap, and hidden fee drag.
That’s why monitoring alone may not be enough. A tracker shows the data. Guidance may turn that data into action. That’s the difference between seeing your portfolio and having a clearer sense of what to do next.
FAQs
What makes guidance different from simple tracking?
Guidance goes beyond simple tracking. Instead of only showing account balances, it looks across your full financial picture to surface risks and opportunities that may otherwise stay buried.
For example, it may flag cross-account wash sale risks, spot tax-loss harvesting opportunities, and uncover hidden portfolio overlap. Then it turns those signals into real-time suggestions you may choose to act on.
Which accounts can trigger a wash sale?
The wash sale rule may apply across investment accounts tied to your tax ID. That may include taxable brokerage accounts, traditional IRAs, Roth IRAs, 401(k)s, 403(b)s, and HSAs. In some cases, joint accounts and a spouse’s accounts may also be part of the picture.
A wash sale may be triggered if you buy back a substantially identical security in any of those accounts during the 61-day window tied to a loss sale: 30 days before the sale, the sale date itself, or 30 days after.
How can I tell if fund overlap is a problem?
Fund overlap may become a problem when it leads to concentration you didn’t mean to take on and duplicate fees you may not notice at first glance. That may be hard to spot when account statements show holdings only at the account level.
A fuller check may involve looking across all accounts - including 401(k)s, IRAs, and spousal accounts - and reviewing the underlying stocks inside your ETFs and mutual funds. If several funds hold the same major positions, you may end up with more exposure to one company or sector than you intended, while also paying multiple fees for similar exposure.
Disclosures:
- This content is for informational purposes only and does not constitute investment advice or a recommendation to buy or sell any security.
- Past performance is not indicative of future results. No guarantee of future performance or outcomes is implied.
Related Blog Posts
- Portfolio X-Ray Tool for ETFs and Mutual Funds
- How to track RSUs, options, and a brokerage portfolio in one place
- Sharesight vs Mezzi: Performance Tracking vs Tax + Overlap
- Tiller Spreadsheet Users: When to Graduate to an AI Wealth Platform
Guidance goes beyond simple tracking. Instead of only showing account balances, it looks across your full financial picture to surface risks and opportunities that may otherwise stay buried.
For example, it may flag cross-account wash sale risks, spot tax-loss harvesting opportunities, and uncover hidden portfolio overlap. Then it turns those signals into real-time suggestions you may choose to act on.
The wash sale rule may apply across investment accounts tied to your tax ID. That may include taxable brokerage accounts, traditional IRAs, Roth IRAs, 401(k)s, 403(b)s, and HSAs. In some cases, joint accounts and a spouse’s accounts may also be part of the picture.
A wash sale may be triggered if you buy back a substantially identical security in any of those accounts during the 61-day window tied to a loss sale: 30 days before the sale, the sale date itself, or 30 days after.
Fund overlap may become a problem when it leads to concentration you didn’t mean to take on and duplicate fees you may not notice at first glance. That may be hard to spot when account statements show holdings only at the account level.
A fuller check may involve looking across all accounts - including 401(k)s, IRAs, and spousal accounts - and reviewing the underlying stocks inside your ETFs and mutual funds. If several funds hold the same major positions, you may end up with more exposure to one company or sector than you intended, while also paying multiple fees for similar exposure.