
When deciding between VEA and VWO for international exposure, here's what you need to know:
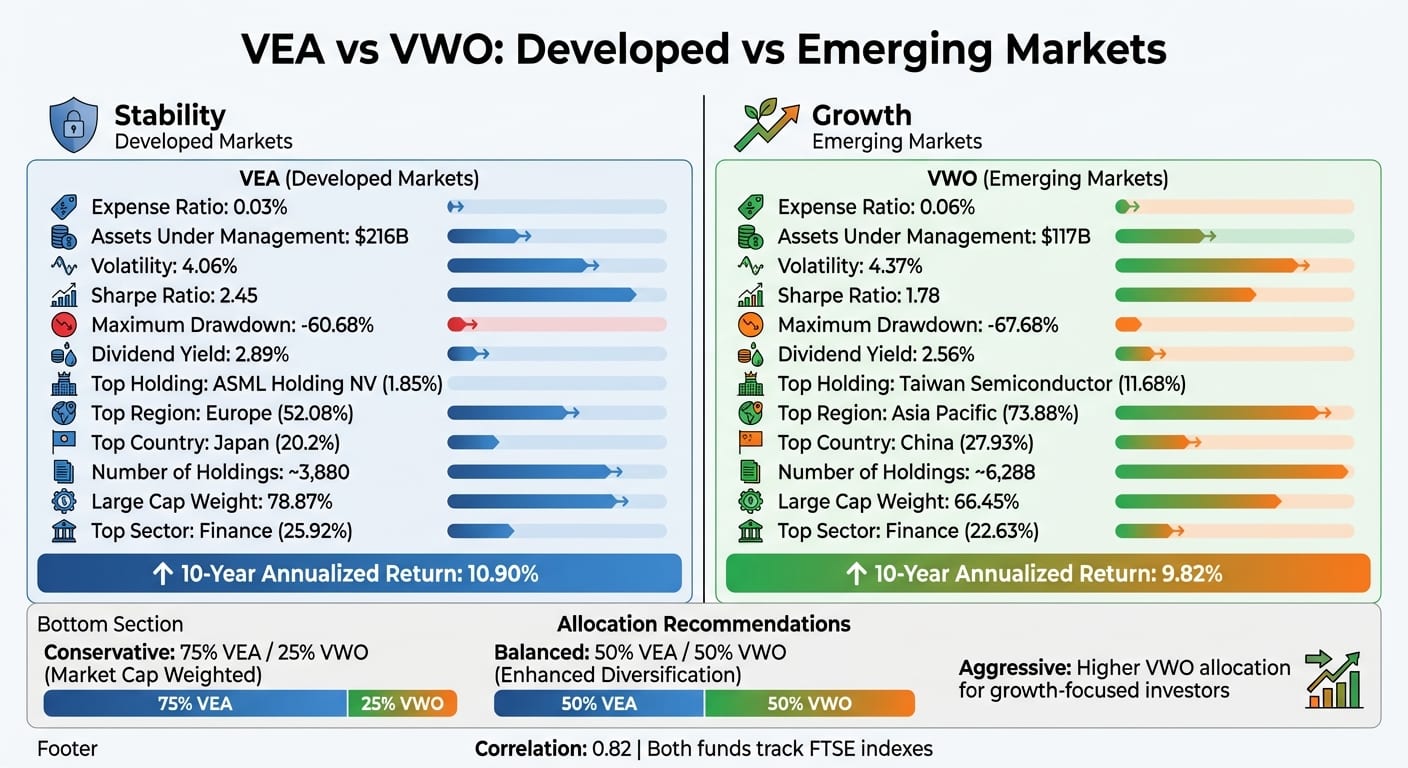
- VEA (Vanguard FTSE Developed Markets ETF): Focuses on developed markets like Japan, the UK, and Canada. It offers stability, lower volatility (4.06%), and a low expense ratio (0.03%). Its top holding is ASML Holding NV (1.85% of the fund).
- VWO (Vanguard FTSE Emerging Markets ETF): Targets emerging markets like China, Taiwan, and India. It has higher growth potential but comes with more risk (volatility of 4.37%) and a slightly higher expense ratio (0.06%). Taiwan Semiconductor (TSMC) makes up 11.68% of the fund.
Quick Comparison
Key Takeaways:
- Stability vs. Growth: VEA is better for stability, while VWO offers higher growth potential with increased risk.
- Diversification: Combining both can balance stability and growth. A 75% VEA / 25% VWO split aligns with global market capitalization.
- Risk Tolerance: VWO suits long-term, risk-tolerant investors; VEA is ideal for those prioritizing steady returns.
Your choice depends on your risk tolerance, time horizon, and portfolio goals.
VEA vs VWO Comparison 2025! (Which One is Better?)
Key Differences Between VEA and VWO
When deciding between VEA and VWO for international investments, understanding their differences is key. These ETFs focus on distinct markets, offering diverse opportunities to align with your portfolio goals.
Expense Ratios and Fees
VEA stands out with an expense ratio of 0.03%, making it one of the least expensive international ETFs. Meanwhile, VWO’s expense ratio is 0.06%, still far below the 1.13% average for emerging market funds. To put it into perspective, a $10,000 investment in VEA costs only $3 annually, while VWO costs $6 annually. Both funds remain well below the 0.22% industry average for ETFs. Vanguard also reduced expense ratios across 84 share classes, including VWO, in February 2026, reaffirming their commitment to keeping costs low. But beyond fees, their differences in holdings and market focus are even more telling.
Holdings and Indexes Tracked
VEA tracks the FTSE Developed ex US All Cap Net Tax (US RIC) Index, covering about 3,880 stocks in developed markets. On the other hand, VWO follows the FTSE Emerging Markets All Cap China A Inclusion Index, with a broader scope of around 6,288 stocks. Despite its larger pool, VWO is more concentrated in its top holdings. For instance, Taiwan Semiconductor Manufacturing Co. (TSMC) makes up 11.68% of the fund, with Tencent Holdings and Alibaba Group comprising 4.13% and 3.31%, respectively. In contrast, VEA’s largest holding, ASML Holding NV, accounts for just 1.85%, followed by Samsung Electronics at 1.70% and Roche Holding at 1.04%. Additionally, VEA leans heavily toward large-cap stocks, with a 78.87% allocation, compared to VWO’s 66.45%.
Geographic and Sector Exposure
The regional focus of these funds highlights their contrasting strategies. VEA allocates 52.08% of its assets to Europe, with notable exposure to Japan (20.2%), the United Kingdom (11.23%), and Canada (10.26%). In contrast, VWO dedicates 73.88% of its assets to the Asia Pacific region, with China (27.93%), Taiwan (22.96%), and India (16.86%) leading the way.
Sector-wise, both funds are heavily weighted in Finance - VEA at 25.92% and VWO at 22.63%. However, VWO has nearly double the exposure to Electronic Technology at 21.0%, thanks to its semiconductor holdings, compared to VEA’s 10.96%. On the flip side, VEA allocates more to Health Technology, with an 8.5% weight. These differences shape their risk and return profiles, giving investors distinct choices based on their market outlook.
Risk Profiles and Historical Performance
Risk and Volatility
When it comes to volatility, VEA takes the lead with lower figures. Its one-month rolling volatility stands at 4.06%, while VWO comes in slightly higher at 4.37%. Over a longer stretch - 200 days - the difference becomes more pronounced: VEA's volatility is 11.81%, compared to VWO's 13.76%. The maximum drawdowns also reveal a similar trend: VEA experienced a -60.68% drop at its worst, whereas VWO's maximum drawdown hit -67.68%.
Looking at risk-adjusted returns, VEA outperforms with a Sharpe ratio of 2.45 and a Sortino ratio of 3.33, compared to VWO's 1.78 and 2.47, respectively. These figures highlight VEA's stability, driven by its exposure to developed markets beyond the S&P 500 like Japan, the UK, and Canada. On the other hand, VWO's focus on emerging markets - such as China, Taiwan, and India - offers higher growth potential but comes with increased uncertainty. These differences make it clear that choosing the right ETF depends on your personal risk tolerance and investment strategy.
Although both funds often move in similar directions, their contrasting risk profiles reveal the unique roles they can play in a diversified portfolio.
Historical Returns and Correlations
Over the last ten years, VEA has delivered slightly better returns, with an annualized return of 10.90%, compared to VWO's 9.82%. In standout years like 2025, VEA surged 35.18%, leaving VWO's 25.61% gain behind. Year-to-date through February 2026, VEA has climbed 11.29%, while VWO trails at 8.87%.
That said, VWO has had its moments during strong growth cycles. For instance, in 2017, emerging markets boomed, and VWO delivered a 31.49% return, outpacing VEA's 26.42%. Similarly, in 2020, VWO rose 15.18%, while VEA posted a more modest 9.71%. During the market downturn in 2022, VEA again showed its resilience, falling -15.34%, a smaller drop compared to VWO's -17.98%.
Another factor to consider is the dividend yield. VEA currently offers a higher yield of 2.89% over the trailing twelve months, compared to VWO's 2.56%. For those prioritizing stability and steady returns, VEA stands out as a solid core holding. Meanwhile, investors with a higher risk appetite and a focus on growth may find VWO's exposure to fast-growing economies worth the added volatility. These performance trends provide valuable context for making informed allocation choices, which we’ll explore further in the next section.
How to Allocate Between VEA and VWO
Portfolio Allocation Examples
When deciding how to split your portfolio between VEA and VWO, it’s essential to align with your investment goals. A common approach is allocating 75% to VEA and 25% to VWO, which reflects global market capitalization. This ratio mimics the natural weighting of developed and emerging markets in international indexes, giving you broad exposure without favoring either category.
If you’re looking for broader diversification, consider a 50/50 split. A backtest by John Williamson, APMA at Optimized Portfolio, examined various international allocations from 1995 to 2021. The results showed that a balanced 50% developed/50% emerging strategy achieved a 6.81% compound annual growth rate (CAGR) with a 0.35 Sharpe ratio, outperforming the market-weighted 75/25 approach, which delivered a 5.76% CAGR and a 0.31 Sharpe ratio over 26 years. The increased allocation to emerging markets boosted both returns and risk-adjusted performance during that period.
"Emerging Markets offer a consistently lower correlation to the U.S. market and are thus the superior diversifier." - John Williamson, APMA, Optimized Portfolio
For those with a higher risk tolerance and a focus on aggressive growth, you might consider overweighting VWO, possibly equaling or exceeding your VEA allocation. This approach works best for long-term investors who can handle larger drawdowns. For instance, during the 2000–2009 "lost decade", while the S&P 500 returned -10%, developed markets gained 13%, and emerging markets soared 155%. However, it’s worth noting that VWO also experienced a steep -67.68% drawdown during this time, highlighting its higher risk profile.
Factors to Consider for Allocation
Your time horizon plays a critical role in determining the right allocation. If you’re investing for 20 years or more, you can typically handle the higher volatility of emerging markets. On the other hand, for shorter horizons - five years or less - it’s safer to lean toward VEA to reduce the impact of potential downturns.
Risk tolerance is another key factor. VWO comes with greater political, regulatory, and liquidity risks, so investors who prefer stability should favor VEA. However, if you’re comfortable with VWO’s higher volatility, allocating more to it could align better with your goals.
Diversification needs should also guide your decision. While VEA and VWO have a high correlation of 0.82, VWO tends to provide better protection during U.S. market downturns. If your portfolio is heavily weighted toward U.S. stocks, increasing your VWO allocation might serve as a more effective hedge. Ultimately, your allocation should strike the right balance between the stability of developed markets and the growth potential of emerging markets. Be sure to rebalance annually to maintain your desired allocation.
Using Mezzi for VEA and VWO Analysis
Mezzi provides a suite of tools that can fine-tune your approach to VEA and VWO investments, offering deeper insights into portfolio exposure, tax strategies, and allocation efficiency.
X-Ray Feature for Portfolio Exposure
Mezzi's X-Ray tool uncovers hidden risks when combining VEA and VWO in a portfolio. While these funds focus on different markets, their correlation of 0.82 suggests that holding both may not deliver the diversification you expect.
For instance, the tool highlights regional overlaps that might not be immediately apparent. VEA allocates 35.64% of its portfolio to the Asia-Pacific region, while VWO has an even higher concentration, dedicating 73.88% of its holdings there. If you own both, you might unintentionally overexpose your portfolio to Asian markets. Additionally, the X-Ray feature identifies sector overlaps, such as VWO's 21.0% allocation to Electronic Technology compared to VEA's 10.96%. For a portfolio already heavy in tech, this could signal a need for rebalancing.
Country-specific risks also become more transparent through the tool, helping you make informed decisions about allocation adjustments.
AI-Driven Tax Optimization
Mezzi's AI tools build on exposure data to refine your tax strategy. One standout feature is its ability to help you avoid wash sales when rebalancing between VEA and VWO. Since VEA tracks the FTSE Developed ex US Index and VWO follows the FTSE Emerging Index, the IRS may not view them as "substantially identical". This distinction allows you to use these funds for tax-loss harvesting while keeping your international exposure intact.
The platform continuously monitors all connected accounts in real time, flagging potential wash sale violations before they occur. This proactive approach is particularly useful for investors actively adjusting their developed and emerging market allocations, helping to preserve tax benefits.
Financial Calculator for Allocation Decisions
Mezzi's Financial Calculator allows you to simulate various VEA/VWO allocation strategies using key risk and return metrics. For example, VEA boasts a Sharpe Ratio of 2.45 compared to VWO's 1.78, indicating a higher return per unit of risk. The calculator also considers volatility - VEA's is 4.06%, slightly lower than VWO's 4.37% - to demonstrate how different weightings impact portfolio stability.
It also projects worst-case scenarios, showing that VEA experienced a −60.68% drop at its worst, while VWO saw a steeper −67.68%. Over time, the calculator factors in expense ratio differences (VEA at 0.03%-0.05% vs. VWO at 0.06%-0.08%) to illustrate how costs affect total returns. These insights provide a clear picture of how to balance risk, return, and expenses effectively.
Conclusion
Choosing between VEA and VWO depends on your investment goals and risk tolerance. VEA offers a more stable option with exposure to developed markets like Japan, the UK, and France, featuring a 4.06% volatility and a Sharpe ratio of 2.45. On the other hand, VWO targets emerging economies such as China, Taiwan, and India, presenting higher growth potential but with greater risk, including a maximum drawdown of -67.68% compared to VEA's -60.68%. Both funds are cost-effective, with expense ratios of 0.03% for VEA and 0.06% for VWO.
Your choice should align with your financial objectives. If you prefer stability and a 2.89% dividend yield, VEA might be the better fit. For those willing to embrace higher risk in pursuit of long-term growth, VWO could be more appealing. Keep in mind their 0.82 correlation, which indicates they often move in tandem despite focusing on different regions.
Experts highlight this trade-off between risk and reward:
"VWO provides exposure to the high-growth potential of emerging markets, albeit with increased volatility. VEA, on the other hand, offers stability through investments in developed markets." – Ron Koren, ETF Insider
Geographic concentration is another factor to consider. VWO allocates 73% of its holdings to the Asia-Pacific region, whereas VEA spreads its investments across various developed markets. Overlapping these funds without proper planning could inadvertently skew your portfolio's balance.
FAQs
Should I hold VEA and VWO together or just one?
Investing in both VEA (developed markets) and VWO (emerging markets) can help diversify your portfolio by covering distinct global regions. VEA leans toward stability, offering exposure to developed economies, while VWO taps into emerging markets, which often come with higher growth opportunities but also increased risk.
The choice ultimately comes down to your personal risk tolerance and investment goals. Holding both funds provides broader market exposure, but focusing on just one might better suit your specific strategy or preferences.
How much emerging markets is too much for my risk level?
The amount of exposure to emerging markets in your investment portfolio should align with your risk tolerance and financial goals. While emerging markets can offer strong growth opportunities, they often come with increased volatility.
For those with a more conservative approach, allocating 10-20% of your equity exposure to emerging markets might feel more comfortable. On the other hand, investors with a higher risk appetite may choose to allocate 30% or more.
One way to manage risk while still benefiting from growth opportunities is to balance investments in emerging markets (like VWO) with those in developed markets (such as VEA). Keeping an eye on market trends and consulting with a financial advisor can also help ensure your strategy aligns with your goals.
How often should I rebalance my VEA/VWO split?
The best rebalancing schedule for your VEA/VWO allocation hinges on your investment strategy and comfort with risk. Popular methods include rebalancing annually, semi-annually, or when your portfolio drifts by a specific percentage (like 5% or 10%). If you opt for more frequent adjustments, such as quarterly, it can help keep your risk exposure in check but might lead to higher costs. On the flip side, less frequent rebalancing lowers expenses while still keeping your portfolio aligned with your objectives.
Disclosures:
- This content is for informational purposes only and does not constitute investment advice or a recommendation to buy or sell any security.
- Past performance is not indicative of future results. No guarantee of future performance or outcomes is implied.
- Savings and performance examples are hypothetical and for illustrative purposes only. Actual results will vary based on individual circumstances, portfolio composition, market conditions, and fees.
- Registration does not imply a certain level of skill or that the SEC has approved the company or its services.
Related Blog Posts
- How does VXUS’ risk/return profile compare to holding VEA + VWO separately?
- VXUS vs VEA+VWO: 5-year total return and overlap analysis (country/sector/holding overlap).
- VWO vs IEMG vs SPEM - Best emerging markets ETF for cost and breadth
- VXUS vs IXUS: Which International ETF for a Three-Fund Portfolio
Investing in both VEA (developed markets) and VWO (emerging markets) can help diversify your portfolio by covering distinct global regions. VEA leans toward stability, offering exposure to developed economies, while VWO taps into emerging markets, which often come with higher growth opportunities but also increased risk.
The choice ultimately comes down to your personal risk tolerance and investment goals. Holding both funds provides broader market exposure, but focusing on just one might better suit your specific strategy or preferences.
The amount of exposure to emerging markets in your investment portfolio should align with your risk tolerance and financial goals. While emerging markets can offer strong growth opportunities, they often come with increased volatility.
For those with a more conservative approach, allocating 10-20% of your equity exposure to emerging markets might feel more comfortable. On the other hand, investors with a higher risk appetite may choose to allocate 30% or more.
One way to manage risk while still benefiting from growth opportunities is to balance investments in emerging markets (like VWO) with those in developed markets (such as VEA). Keeping an eye on market trends and consulting with a financial advisor can also help ensure your strategy aligns with your goals.
The best rebalancing schedule for your VEA/VWO allocation hinges on your investment strategy and comfort with risk. Popular methods include rebalancing annually, semi-annually, or when your portfolio drifts by a specific percentage (like 5% or 10%). If you opt for more frequent adjustments, such as quarterly, it can help keep your risk exposure in check but might lead to higher costs. On the flip side, less frequent rebalancing lowers expenses while still keeping your portfolio aligned with your objectives.