
One stock at more than 10% of my total investable assets may be a risk line worth pausing at. For some people, a lower cap - like 5% to 7% - may make more sense, especially if employer stock, near-term spending, or a thin cash buffer are part of the picture.
Here’s the short version:
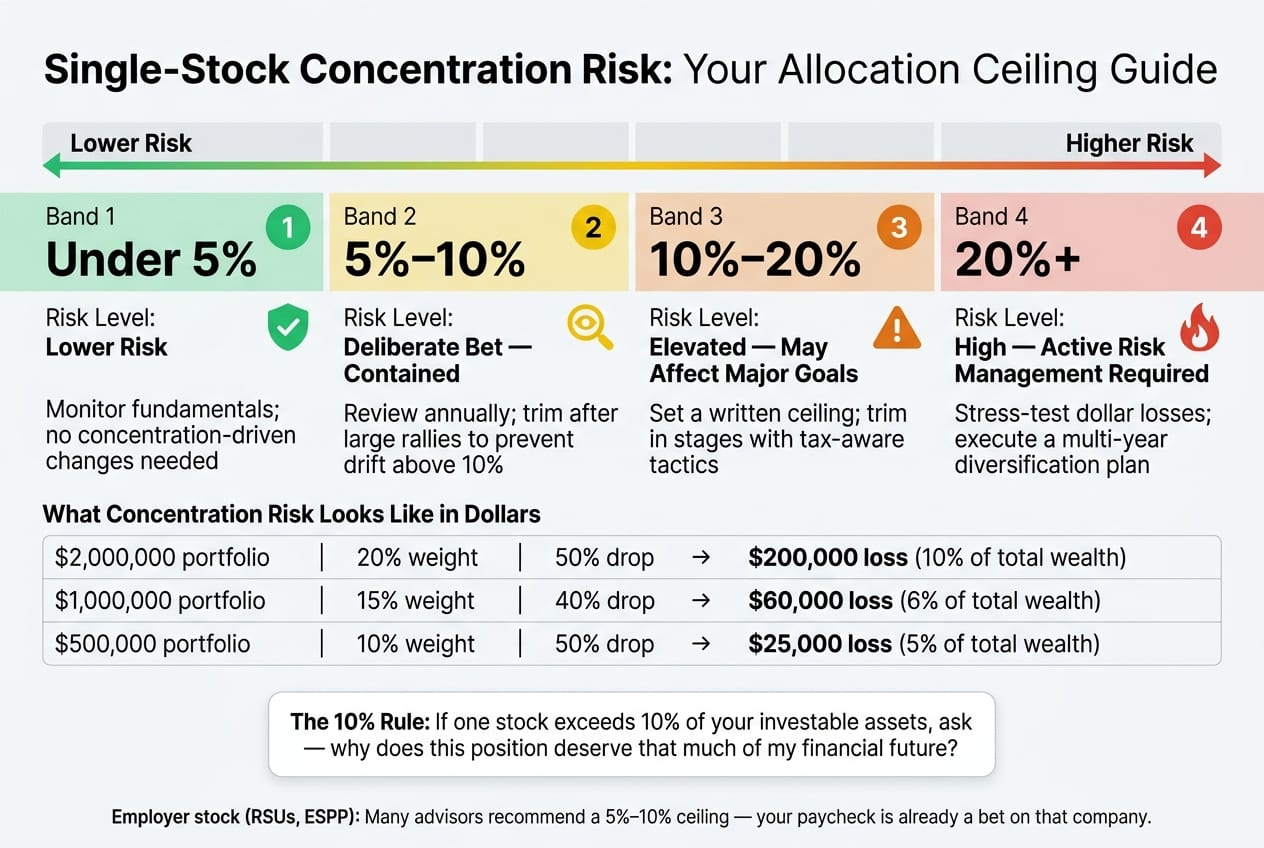
- Under 5% may be a lower-risk single-stock position
- 5% to 10% may be a deliberate bet that still stays contained
- 10% to 20% may start to affect major financial goals
- 20%+ may mean one company has too much control over total portfolio results
A simple way to look at it: if a stock makes up 15% of a $1,000,000 portfolio and falls 40%, the paper loss may be about $60,000. That may be fine for one household and too much for another.
This piece boils the issue down to four things:
- measuring total exposure across all accounts
- setting a personal ceiling
- checking dollar-loss risk
- trimming in a tax-aware way if the position gets too large
If I own RSUs, ESPP shares, or stock in a company that also pays my salary, the limit may need to be lower.
Concentrated Stock Is More Dangerous Than You Think
The Concentration Ceiling: What Allocation Range Is Reasonable
These bands may offer a useful starting point for setting a ceiling on any single stock.
Under 5%, 5%–10%, 10%–20%, and 20%+: What Each Range Means
That said, these bands are just a first pass. The right ceiling may depend on your balance sheet, income, time horizon, and tax setup.
The 10% mark may be a useful pause point. At that level, some investors ask a simple question: Why does this one position deserve that much of my financial future? Charles Schwab flags more than 10% as a point where concentration risks may be mounting.
A Dollar-Loss Test That Makes the Risk Concrete
Percentages may feel a little slippery. Dollars usually don't.
One simple way to frame the risk is to multiply your portfolio value by the stock's weight, then by the size of the drop you're testing. Here's what that may look like:
A single stock may fall 30%, 50%, or more over a market cycle. And once you see the loss in dollar terms, the risk tends to feel a lot more concrete.
Compare that number to something tangible: your annual retirement withdrawal target, your emergency fund, or a big planned cost like college tuition.
If a worst-case loss in one stock may wipe out two or more years of planned withdrawals, your ceiling may be too high.
Some investors use the dollar-loss test to set a first-pass ceiling, then adjust from there based on net worth, income, time horizon, and taxes.
How Net Worth, Time Horizon, Income, and Taxes Change Your Personal Ceiling
Now compare that dollar loss to your full balance sheet. The same loss may feel manageable for one household and deeply disruptive for another.
Net Worth, Liquidity, and Time Horizon
Use liquid, investable assets as the denominator: brokerage accounts, retirement accounts, and cash equivalents. Home equity and future pay may not absorb a market drop today.
More liquid wealth and a flexible timeline may support a higher ceiling. Limited savings and near-term goals may point to a lower one.
Time horizon makes the picture sharper. If you're within 3–5 years of a major goal, like retirement, college tuition, or a home purchase, many planners may lean toward ceilings of 5% or less, especially for money set aside for that goal.
Income stability matters too. Households with steady, diversified income may tolerate a bit more concentration than households whose pay is cyclical, commission-based, or tied to the same sector as the stock. If your job may already be volatile, keeping single-stock exposure closer to 5%–10% may line up better with that risk.
Here’s a plain-language test: if this stock fell 50%, would it change your plans over the next 5–10 years? If yes, the ceiling may already be too high.
Employer Stock and the Double Risk of Paycheck and Portfolio
Employer stock calls for extra care because your paycheck may already depend on the same company.
A worker with a large RSU balance may end up with more than 30% in one company without meaning to. Many advisors place employer stock ceilings around 5%–10% of total investable assets.
The idea is simple: your future earnings may already be a large bet on that business. Your portfolio may not need to mirror that same risk.
Tax Constraints: Taxable Accounts vs. IRAs and 401(k)s
Taxes may shape how fast you reduce concentration, not just whether you do it.
Some investors sell first in IRAs and 401(k)s, where rebalancing usually may not create an immediate tax cost, and then handle taxable shares more gradually. Large unrealized gains in a taxable account mean a one-time sale may create a large tax bill - federal long-term capital gains rates may go up to 20%, plus a 3.8% net investment income tax for higher-income households.
A common approach may look like this:
- Trim IRAs and 401(k)s first
- Use lot selection, loss harvesting, or appreciated-share gifts for taxable shares
- Start with the least-taxed account and then work through the rest
That setup may give you more room to lower concentration without turning one portfolio issue into a tax issue too.
What to Do When One Stock Is Already Too Large
If your holding sits above your limit, some investors cut it down in stages. The cleanest version of that plan may be selling over time instead of all at once.
Sell in Stages, Not All at Once
Break the reduction into fixed steps. Say an investor has a $1,000,000 portfolio, and $400,000 of it - 40% - sits in one tech stock. They might aim to get that down to 20% over two years by selling about $50,000 each quarter for eight quarters, then reinvesting each piece into a more diversified mix.
Spreading sales across two tax years may smooth the gain. It may also reduce concentration without creating one large taxable event.
For new RSUs, some people sell at vest until the position moves back under the target.
Tax-Aware Reduction: Lot Selection, Loss Offsets, and Charitable Giving
Once the sale plan is set, taxes may shape the order and pace of trimming. Some investors use higher-basis lots, loss offsets, and donations of appreciated shares to reduce the tax bill while they trim.
If you already give to charity, donating appreciated shares instead of cash may be one route worth looking at. Transferring long-term appreciated stock directly to a qualified charity or donor-advised fund may avoid capital gains tax on those shares entirely.
Write a Simple Policy Before the Stock Moves Again
The hard part may be sticking to the plan. A written rule may take some emotion out of the decision.
One simple policy might look like this:
- No single stock above 10% of total investable assets
- Review at 8%
- Trim at 12%
- Stop reinvesting dividends or new RSUs once the position sits above target
After each sale, recalculate total exposure across every account so the position keeps moving toward your limit.
Conclusion: Measure Full Exposure, Pick a Limit, and Monitor It
After you set a limit, the main job may be simple: keep exposure below it. For many investors, 10% may be a common starting point. But employer stock, near-term spending needs, and a thin cash buffer may justify something closer to 5%–7%. The exact number may matter less than choosing one and sticking with it.
True concentration may be a household-level number, not an account-level one. A single account may look fine on its own, while total exposure across brokerage accounts, retirement accounts, and RSU holdings may be much higher.
And that number may shift fast. Even after you trim, the position may drift back up. RSU vesting, new grants, and dividend reinvestment may all push exposure above your limit again.
Use Mezzi to See Single-Stock Exposure Across Your Entire Portfolio
A live view of exposure may make that monitoring more practical. Mezzi connects taxable accounts, 401(k)s, IRAs, and RSUs with read-only access and uses its X-Ray analysis to show how much of your total investable assets may sit in any single stock, including stock exposure inside ETFs and mutual funds. If a position drifts back above your chosen ceiling, Mezzi flags that drift so you may respond - giving you ongoing, whole-portfolio visibility that may turn a written policy into something you may actually enforce.
FAQs
How do I calculate my total single-stock exposure across all accounts?
Add up your holdings across all accounts, including 401(k)s, IRAs, and taxable brokerage accounts. Include both direct shares and indirect ownership through ETFs, mutual funds, and target-date funds.
Doing that by hand may be tough. Funds may hide overlap, so the same stock may show up in more than one place without standing out. Mezzi combines accounts into one view, and its X-Ray feature shows your total percentage exposure to any single stock.
Should my limit be lower if I own employer stock or RSUs?
Yes. Your concentration limit may be lower if you own employer stock, including RSUs.
When your paycheck and your investments are both linked to the same company, a downturn may affect both your income and your savings at the same time. That added overlap may make a single-stock position feel riskier than it would otherwise.
Many experts suggest keeping total exposure to any one stock, including company equity, in the 5% to 10% range. If part of that position comes from RSUs, some people sell at vesting to keep that exposure in check.
What is the most tax-efficient way to trim a concentrated stock position?
Start with tax-advantaged accounts like 401(k)s and IRAs. In those accounts, sales generally may not trigger capital gains taxes the way they may in a taxable brokerage account.
For taxable accounts, some investors use tax-loss harvesting to offset realized gains. In some cases, that may also offset up to $3,000 per year of ordinary income.
It may also make sense to trim positions gradually instead of all at once. Some people time sales so they may qualify for lower long-term capital gains rates when that applies. Others sell specific tax lots rather than using a default method, which may reduce gains that would otherwise be realized.
Disclosures:
- This content is for informational purposes only and does not constitute investment advice or a recommendation to buy or sell any security.
- Past performance is not indicative of future results. No guarantee of future performance or outcomes is implied.
Related Blog Posts
- Concentrated stock position monitoring
- Concentrated stock position: when and how to diversify
- How to manage wealth after a company acquisition or IPO exit
- How to avoid a concentrated position in your own employer's stock
Add up your holdings across all accounts, including 401(k)s, IRAs, and taxable brokerage accounts. Include both direct shares and indirect ownership through ETFs, mutual funds, and target-date funds.
Doing that by hand may be tough. Funds may hide overlap, so the same stock may show up in more than one place without standing out. Mezzi combines accounts into one view, and its X-Ray feature shows your total percentage exposure to any single stock.
Yes. Your concentration limit may be lower if you own employer stock, including RSUs.
When your paycheck and your investments are both linked to the same company, a downturn may affect both your income and your savings at the same time. That added overlap may make a single-stock position feel riskier than it would otherwise.
Many experts suggest keeping total exposure to any one stock, including company equity, in the 5% to 10% range. If part of that position comes from RSUs, some people sell at vesting to keep that exposure in check.
Start with tax-advantaged accounts like 401(k)s and IRAs. In those accounts, sales generally may not trigger capital gains taxes the way they may in a taxable brokerage account.
For taxable accounts, some investors use tax-loss harvesting to offset realized gains. In some cases, that may also offset up to $3,000 per year of ordinary income.
It may also make sense to trim positions gradually instead of all at once. Some people time sales so they may qualify for lower long-term capital gains rates when that applies. Others sell specific tax lots rather than using a default method, which may reduce gains that would otherwise be realized.