
A high income may still lead to average wealth if spending keeps moving up with pay. At $200,000+ a year, the problem may not be one big splurge. It may be a stack of fixed bills, autopay charges, and higher day-to-day habits that leave too little for investing.
Here’s the short version:
- More income doesn’t always mean more wealth
- Housing, cars, private school, travel, and services may lock in a higher spending floor
- Even small monthly charges may add up fast on autopay
- A household may earn more each year but still save less than 10% to 15%
- Three numbers may show the problem fast: savings rate, net worth, and fixed-expense ratio
- Some people deal with this by sending part of each bonus, RSU vest, or pay increase to investing before it reaches checking
A few numbers from the article stand out:
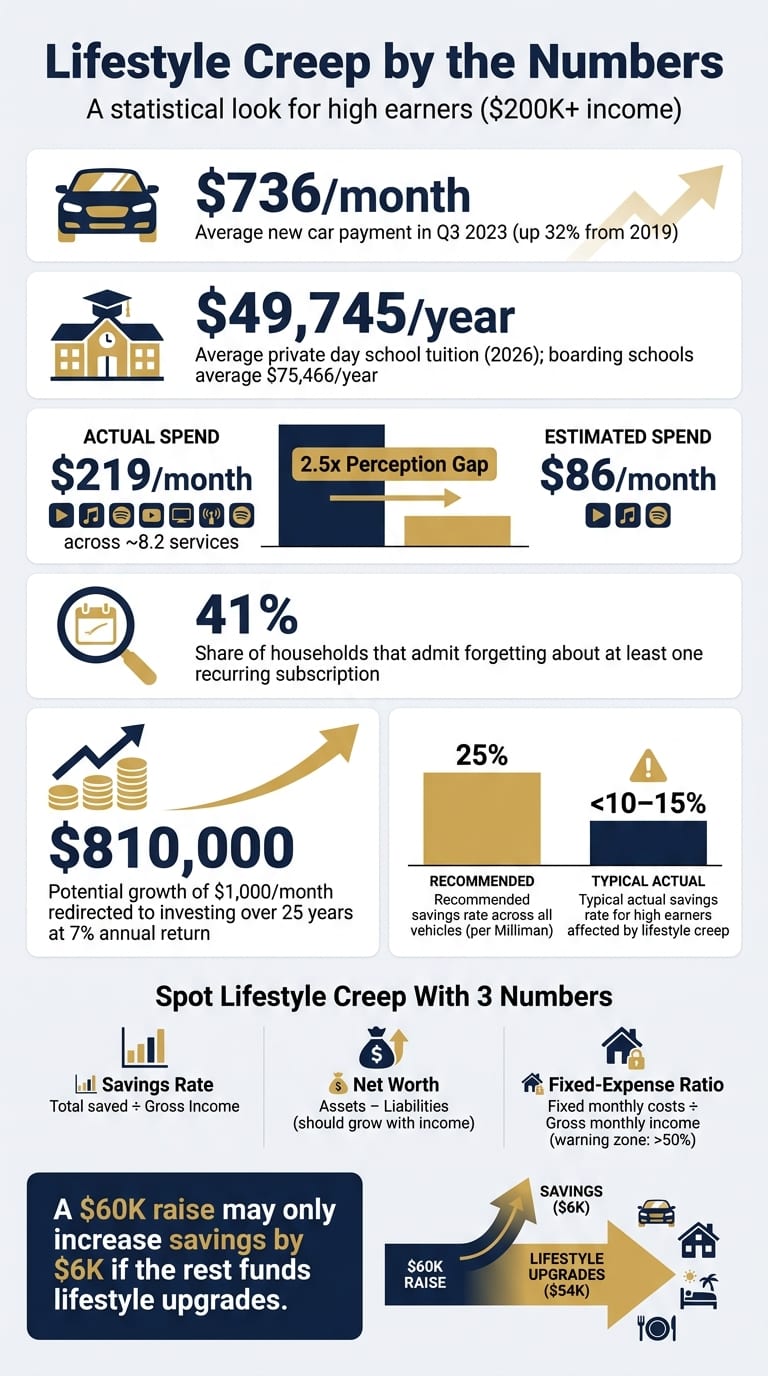
- New car payments reached $736/month in Q3 2023
- Average private day school tuition sits near $49,745/year
- Average subscription spending reached $219/month, while many people guessed only $86
- Redirecting $1,000/month to investing may grow to about $810,000 over 25 years at a 7% annual return
Put another way: lifestyle creep may turn a top-tier income into a middle-of-the-road outcome. I’d read this piece as a simple warning that wealth may depend less on what I earn and more on what I lock myself into spending.
Why Even High Earners Are Living Paycheck To Paycheck
How High Earners Spend Their Way to Mediocrity
Each raise may turn into a new spending floor. Fixed costs go up, recurring services pile on, and investing may stay about the same. The result may be a household that looks affluent on the surface but builds wealth at a slow pace.
The Fixed-Cost Trap: Housing, Cars, School, and Travel
The biggest driver may be permanent upgrades that lock in higher monthly bills for years. A bigger home doesn’t just mean a larger mortgage. It may also bring higher property taxes, insurance, utilities, and maintenance.
Then cars and schooling get added to the mix. The average new car payment reached $736 per month in Q3 2023, up 32% from 2019. If a household swaps two reliable paid-off cars for luxury SUVs, monthly costs may climb fast through payments, insurance, and upkeep. Private K–12 tuition may add even more pressure. It averages $49,745 per year at private day schools and $75,466 at boarding schools as of 2026, so a family with two children in private school may spend more than $100,000 a year on education before extracurriculars or donations. Travel may follow the same pattern. A budget that once sat at a few thousand dollars a year may drift past $20,000 when business-class flights and five-star hotels become the norm.
Once those costs settle in, the next drain may come from the smaller charges that are easy to ignore.
The Quiet Leak: Subscriptions, Services, and Convenience Spending
Beyond the big upgrades, there’s a second layer of spending that often slips by: autopay spending. Streaming bundles, meal delivery memberships, weekly house cleaning, boutique fitness, app subscriptions, and concierge services may each look minor on their own.
A 2026 subscription-spending analysis found that the average American spends $219 per month across 8.2 active services but estimates spending at only $86, a 2.5x perception gap. A separate 2026 FinanceBuzz survey found that 41% of households admit to forgetting about at least one recurring subscription. For high earners who have added premium tiers across several categories, total subscription and service costs of $500–$1,500 per month may build up fast. That may become another fixed bill running on autopay, with little review.
The issue tends to show up most clearly when those quiet leaks start taking space away from investing.
Underinvesting Even as Income Rises
Maxing a 401(k) may not be enough. If fixed costs and autopay spending take up most of the remaining take-home pay, contributions to taxable brokerage accounts, HSAs, and IRAs may stay irregular or may not happen at all. High income may turn into average wealth when spending grows faster than investable cash.
A $60,000 raise may disappear faster than many people expect. A jump from $220,000 to $280,000 may increase savings from $44,000 to only $50,000 if the rest goes to housing, cars, school, and travel. In that case, the savings rate may fall from 20% to 17.9%. Milliman strongly recommends saving at least 25% of pay across all vehicles, ideally using tax-advantaged accounts. Over time, that gap may be associated with a net worth that looks average relative to the household’s income.
The fix may start with measuring the gap before it starts to feel normal.
How to Diagnose Lifestyle Creep With Numbers
Feelings may not tell you much here. If spending starts growing faster than investing, the gap may show up in three numbers.
Track Savings Rate, Net Worth, and Fixed-Expense Ratio
Savings rate may be the clearest signal. Take everything you save and invest in a year, then divide it by your gross income. For example, a household earning $350,000 that puts $23,000 into a 401(k), $6,500 into a backdoor Roth IRA, and $14,000 into a brokerage account would save $43,500 total, or about 12.4% of gross income. At that income level, a number like that may point to lifestyle creep. It's one way high income may turn into average wealth.
Net worth may show whether the big picture is moving in the right direction. Add your assets and subtract your liabilities. If that number is barely changing even with strong income, higher fixed costs and extra discretionary spending may be absorbing the surplus. Flat net worth alongside rising income may be a warning sign.
Fixed-expense ratio may show how much of your lifestyle is locked in. Add up monthly non-negotiable costs like your mortgage, car payments, insurance, tuition, and utilities. Then divide that total by gross monthly income. If a household earning $350,000 has $10,500 a month in fixed obligations, about 36% of gross income may already be committed before any discretionary spending happens. If fixed costs move above 50% of gross income, they may crowd out savings and may reduce flexibility.
Run a 90-Day Spending Audit
Pull the last three months of statements from every checking account and credit card you use often. Group transactions into the categories where lifestyle creep tends to show up:
- Housing
- Cars
- School
- Travel
- Subscriptions
Then look for two things: new recurring charges that showed up after a raise or bonus, and category upgrades where spending is meaningfully higher than it was before your last promotion or windfall.
Look for company names like Netflix, Spotify, or Amazon alongside terms like "RECURRING", "SUBSCRIPTION", or "MONTHLY". Multiply each three-month total by four to annualize it. If annual travel has climbed to $40,000 while total annual investments sit at $35,000, that gap may be a numeric sign of lifestyle creep.
Get a Full Balance-Sheet View Before Making Cuts
Fragmented accounts may make the problem harder to see. A high earner may focus on a large credit card bill while missing a bigger issue, like an oversized mortgage, underfunded retirement accounts, or idle cash spread across several bank accounts.
Once the spending categories are clear, it may help to pull everything into one view. Mezzi's read-only account aggregation connects to existing bank, brokerage, and retirement accounts through secure APIs and pulls balances and transactions into a single dashboard - without moving any assets. That dashboard may make it easier to spot underused tax-advantaged accounts, concentrated positions, and drops in savings rate after a raise.
Rules That Reverse Lifestyle Inflation
Once the numbers show creep, the fix may come from rules, not willpower. The goal may be to route new income before it reaches checking.
Pre-Commit Raises, Bonuses, and RSU Vesting Proceeds
One simple rule may do a lot of the work: decide where new money goes before it arrives. Some people route at least 50% of every raise, bonus, or RSU vesting to investing, debt paydown, or reserves before it hits checking.
Here’s what that may look like in practice. Say you receive a $25,000 raise. Only $12,500 may be available for lifestyle upgrades, like a slightly nicer vacation, better childcare, or a modest apartment move. The other $12,500 may go straight to a 401(k) contribution, a taxable brokerage transfer, or extra mortgage principal. That kind of cap may still leave room for a nicer day-to-day life, while making it less likely that the full raise gets absorbed into a bigger fixed-cost base.
The same logic may apply to bonuses and vesting events. A bonus, for example, may be split 70% to investing, 20% to cash reserves, and 10% to debt reduction - set ahead of time, not after the deposit clears. RSU proceeds may also call for tax withholding and concentration-risk choices before any spending happens.
Set Hard Caps on the Biggest Spending Categories
Another rule some households use: put fixed caps on housing, vehicles, travel, and subscriptions. Those are often the first areas to expand when income goes up.
Subscriptions deserve extra attention because they tend to pile up quietly. One simple rule may help: add one service only if you cancel one. That may limit the slow buildup a 90-day audit often uncovers. Consumers with active subscriptions spend about $219 per month across roughly 8.2 services, while estimating only $86 per month on average. A hard cap may make that gap easier to see and easier to control.
After those caps are in place, the next step may be automation.
Automate Investing and Optimize Where Money Goes
Automation may make saving feel almost automatic. Some people schedule 401(k) contributions through payroll so the money never lands in the discretionary spending bucket. For 2026, the elective deferral limit is $24,500. That may be paired with an HSA contribution of $4,400 for self-only coverage or $8,750 for family coverage. After tax-advantaged accounts are maxed, an automatic transfer to a taxable brokerage account may capture any leftover surplus.
Automation may handle the amount and timing, but account placement still matters. Mezzi is designed to map assets to the right account type, flag tax-loss opportunities and wash-sale risk, and surface overlapping holdings that may reduce after-tax returns.
Conclusion: Replace Status Spending With Measurable Wealth Building
Once this pattern becomes easier to spot, the choice may look pretty plain: keep sending more cash toward lifestyle inflation, or send more of it toward assets. Lifestyle creep may be best viewed as a cash-flow issue. Each upgrade may add another fixed cost, and over time those costs may stack up until spending starts to outpace saving. When that happens, an income above $200,000 may look strong on paper while wealth may move very little in practice.
A few numbers may make that drift easier to see: savings rate, net worth, and fixed expenses. If savings stay flat while fixed costs keep climbing, wealth may be stalling. Measurement may show where the leak is. Rules may make it less likely to open again.
Some higher earners route most new income to investing before it lands in checking. That setup may make overspending less likely simply because the money is moved first. Hard caps on housing, transportation, and travel may also protect the savings rate, since those categories may be the ones most likely to expand. Automation may then keep those choices in place month after month.
The long-term trade-off may be bigger than it first appears. Redirecting even $1,000 per month from lifestyle upgrades to investing may grow to roughly $810,000 over 25 years at a 7% annual return. That figure may offer a clean way to think about the cost of lifestyle creep over time.
That’s the trade-off many high earners may face: visible status spending now, or more wealth later. Mezzi connects your accounts, surfaces drift in savings and spending, and shows how each change affects long-term wealth.
FAQs
How do I know if lifestyle creep is hurting me?
Lifestyle creep often shows up in small spending bumps that start to feel normal as income goes up. That may not seem like a big deal at first. But if your net worth stops growing, fixed costs keep inching up, or spending on travel, home upgrades, and subscriptions grows faster than your savings, lifestyle creep may be part of the picture.
A clear view across your accounts may make these patterns easier to spot. You may notice things like overlooked subscriptions, uneven transfers, or impulse purchases that were easy to miss when everything sat in separate places. And if your savings rate falls below 10% to 15%, lifestyle creep may be starting to take hold.
What savings rate should a high earner aim for?
A common starting point for high earners may be saving 10% to 15% of income. People who are more focused on aggressive wealth building may save much more. In some cases, high-net-worth investors may save 50%+ of post-tax income.
The right target may depend on your goals and circumstances. Because of that, many people look for a savings rate that feels personal and sustainable - one that may shift over time as income, career, and life change.
What should I cut first without feeling deprived?
Start with invisible leaks that may add little to your day-to-day happiness. A look back at the last three months of transactions may reveal forgotten subscriptions, unused memberships, and high-fee services that offer limited day-to-day use.Automating those cuts may make them easier to keep in place over time. From there, some people redirect the extra cash into high-yield accounts while still keeping the lifestyle choices they value most.Disclosures:
- This content is for informational purposes only and does not constitute investment advice or a recommendation to buy or sell any security.
- Past performance is not indicative of future results. No guarantee of future performance or outcomes is implied.
- Savings and performance examples are hypothetical and for illustrative purposes only. Actual results will vary based on individual circumstances, portfolio composition, market conditions, and fees.
Disclosures:
- This content is for informational purposes only and does not constitute investment advice or a recommendation to buy or sell any security.
- Past performance is not indicative of future results. No guarantee of future performance or outcomes is implied.
- Savings and performance examples are hypothetical and for illustrative purposes only. Actual results will vary based on individual circumstances, portfolio composition, market conditions, and fees.
Related Blog Posts
- Impact of Fees on Long-Term Investment Growth
- How to track net worth when you have real estate, equity, and cash
- Average net worth by age - and what it actually means for your goals
- Chubby FIRE: Comfortable Early Retirement Between Lean and Fat
Lifestyle creep often shows up in small spending bumps that start to feel normal as income goes up. That may not seem like a big deal at first. But if your net worth stops growing, fixed costs keep inching up, or spending on travel, home upgrades, and subscriptions grows faster than your savings, lifestyle creep may be part of the picture.
A clear view across your accounts may make these patterns easier to spot. You may notice things like overlooked subscriptions, uneven transfers, or impulse purchases that were easy to miss when everything sat in separate places. And if your savings rate falls below 10% to 15%, lifestyle creep may be starting to take hold.
A common starting point for high earners may be saving 10% to 15% of income. People who are more focused on aggressive wealth building may save much more. In some cases, high-net-worth investors may save 50%+ of post-tax income.
The right target may depend on your goals and circumstances. Because of that, many people look for a savings rate that feels personal and sustainable - one that may shift over time as income, career, and life change.
Start with invisible leaks that may add little to your day-to-day happiness. A look back at the last three months of transactions may reveal forgotten subscriptions, unused memberships, and high-fee services that offer limited day-to-day use.Automating those cuts may make them easier to keep in place over time. From there, some people redirect the extra cash into high-yield accounts while still keeping the lifestyle choices they value most.Disclosures:
- This content is for informational purposes only and does not constitute investment advice or a recommendation to buy or sell any security.
- Past performance is not indicative of future results. No guarantee of future performance or outcomes is implied.
- Savings and performance examples are hypothetical and for illustrative purposes only. Actual results will vary based on individual circumstances, portfolio composition, market conditions, and fees.