
A “good” net worth by age may have less to do with rank and more to do with whether your money setup fits your goals.
That’s the short answer.
A percentile table may give you a rough benchmark. But by itself, it may miss the stuff that affects daily life and long-term planning: savings rate, monthly surplus, debt pressure, and how much of your wealth is actually investable.
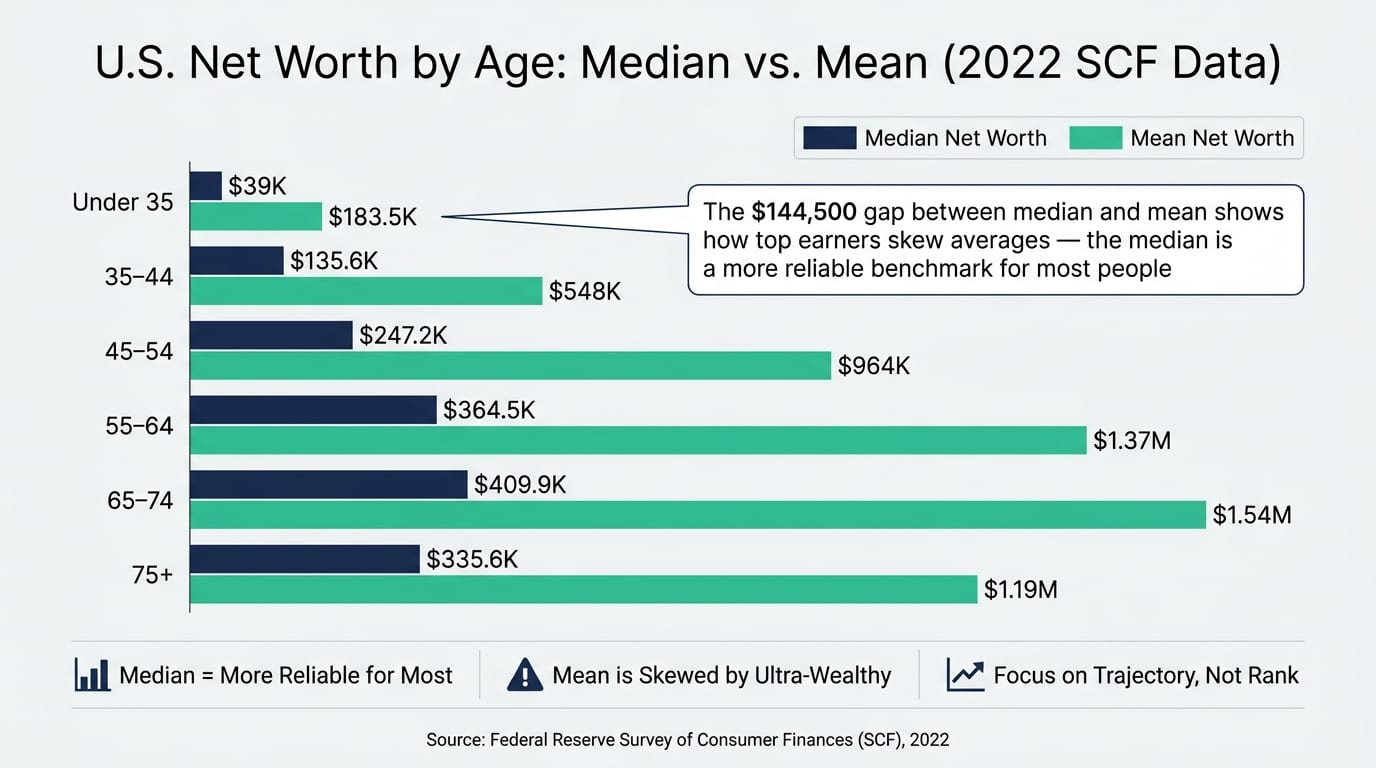
One stat shows why this matters: for U.S. households under 35, the median net worth is about $39,000, while the mean is about $183,500. That gap may make many people look behind when they may simply be closer to normal.
Here’s the simple version:
- Percentiles may show how you compare with others your age
- Savings rate and cash flow may show whether wealth is still building
- Debt load may show how much flexibility you may have
- Investable assets may show how much of your net worth may support future goals
If I were reading this article for one answer, it would be this: a lower net worth with strong savings, lower debt, and liquid assets may put someone in a better spot than a higher net worth tied up in a house, business, or one stock position.
So instead of asking only, “Is my net worth good for my age?”, I’d also ask:
- Am I saving enough each year?
- Do I have a monthly surplus?
- Is my debt under control?
- How much of my net worth may actually be invested or used if needed?
Quick comparison
This article argues that net worth is a snapshot, not the whole picture. The better test may be whether the number is moving in the right direction and whether the balance sheet behind it is strong enough for the life you may want.
1. Age-based net worth percentiles
What they measure
A net worth percentile shows where you may stand compared with same-age U.S. households. It does not show retirement readiness, debt burden, or investment quality.
Based on 2022 SCF data, the median and mean net worth by age look like this:
These numbers may be useful as a baseline. But the bigger test may be whether your balance sheet is moving in the right direction. The wide gap between median and mean in every row may reflect how a small group of very wealthy households pulls the average higher. That may make the median a more dependable benchmark for many people.
How to track your percentile
Add your assets, subtract your debts, and compare the result with SCF-based age tables for a rough percentile estimate. For many people, checking once or twice a year may be enough.
Where percentiles fall short
A percentile ranking doesn't explain why your net worth lands where it does. A physician who started earning later, a startup founder with illiquid equity, and someone with a concentrated employer stock position may all show up in spots that don't say much about their actual financial picture.
Percentiles also leave out a few things that may matter a lot:
- Family size
- Regional cost of living
- Income stability
How well they align with personal goals
Only weakly. Being at the 75th percentile means you may have more than 75% of same-age households. It does not mean you're on track for retirement. A household at the 90th percentile with high fixed expenses may still be financially fragile. A household at the 50th percentile with a high savings rate, low debt, and a clear retirement target may be in very strong shape.
Use percentiles as a checkpoint, not a verdict.
The bigger question may be whether your cash flow is still pushing that number higher.
2. Savings rate and cash flow strength
What they measure
If percentiles show where you stand, savings rate shows whether that number may still be moving up.
Your savings rate refers to the share of income you consistently set aside for future use - retirement accounts, brokerage accounts, and extra debt payments - instead of spending it. Cash flow strength refers to how reliably your inflows exceed your outflows each month, leaving a surplus after bills and day-to-day expenses are paid. Put together, these metrics may show whether your wealth is still building over time. A high net worth may still hide weak cash flow.
How to track them
Track your savings rate the same way every time: divide annual savings by either gross income or take-home pay, and stick with that method so your numbers stay comparable. Include:
- 401(k) contributions
- IRA contributions
- Employer match
- Any automated transfers to investment accounts
For cash flow, subtract monthly expenses from monthly income. What’s left is your surplus.
If your income jumps around - freelance work, commissions, or equity compensation - a rolling 12-month average may give you a steadier read by smoothing out spikes and dips.
How useful they are for financial decisions
These two metrics may be more usable day to day than a percentile ranking. If your savings rate is 8% and your goal is 20%, you may see right away how a new car lease or a rent increase may affect your timeline. You can ask, “Does this expense change my savings rate?” An age-based table may not answer that in real time.
Fidelity recommends saving at least 15% of pre-tax income, including employer match. Vanguard cites 12% to 15% as a reasonable target. Recent U.S. personal savings rates have hovered around 3% to 5% of disposable income.
How well they align with personal goals
Savings rate and cash flow may line up well with personal goals because they translate into timelines. A household earning $120,000 that wants to retire at 60 instead of 67 may aim for 20% to 25% savings for many years to build assets at a faster pace. Someone saving for an $80,000 down payment in five years may need about $16,000 per year set aside for that goal. That equals 16% of a $100,000 income before any retirement contributions.
Run those numbers against your actual monthly surplus, and you may get a quick read on whether the goal looks realistic under current conditions or whether some part of the plan may need to shift.
The next test is whether debt load may be slowing that progress.
3. Debt load and balance-sheet quality
What they measure
If savings rate shows how fast wealth may be growing, debt load shows how much of that wealth may already be spoken for.
That matters because age percentiles don't show whether your net worth may be tied up in illiquid assets or offset by heavy debt. Two households may post the same net worth and still have very different day-to-day flexibility.
Balance-sheet quality refers to how liquid your assets may be and how much debt may reduce them. A high net worth built mostly on home equity plus a large mortgage may look very different from one built on a diversified investment portfolio with little debt.
How to track them
A practical place to start may be tracking debt load with a few simple ratios:
- Debt-to-income
- Housing-cost-to-income
- Debt ranked by interest rate
- Liquid net worth
It may also help to look at debt by interest cost, since not all debt carries the same urgency.
Some people focus on high-interest debt first, since each dollar repaid may act like a risk-free return equal to that rate. Lower-rate debt may rank lower if expected after-tax investment returns may be higher.
How useful they are for financial decisions
Debt load may be a direct input into how much flexibility you have.
A heavy monthly debt obligation may increase the minimum income needed to cover basic expenses. That may make career changes or early retirement harder to pull off, even if net worth looks solid on paper.
Low fixed debt, liquid assets, and a 3- to 6-month emergency fund may create more room to change jobs, absorb shocks, and avoid forced sales.
How well they align with personal goals
If the goal may be early retirement, a high debt load may work against it directly. It may increase the monthly gap that would need to be closed before work stops.
If the goal may be career flexibility, illiquid assets and high fixed payments may reduce your options fast. And if you're targeting homeownership, there's another wrinkle: home equity counts toward net worth, but it may be excluded from liquid asset calculations used by the SEC or wealth managers.
Debt is only part of balance-sheet quality; the next question is whether your assets are diversified, investable, and tax-efficient.
4. Investable assets, diversification, and tax efficiency
What they measure
Once debt may stop being the main drag, the next question may be how much of your net worth is actually investable.
Investable assets are the part of net worth that may stay invested and compound without selling a home or business. Two people may have the same net worth and still have very different levels of flexibility. One person may have most of their wealth tied up in home equity. Another may have a larger share in retirement and brokerage accounts. The second person may have more flexibility and a cleaner path to compounding. That’s why investable assets may be more useful than raw net worth when you’re judging progress toward a goal.
This is also where percentile rankings may point in the wrong direction. A high earner with concentrated equity compensation, a late starter with most wealth in a primary residence, or a founder with illiquid business equity may all rank well on a net worth table while having far less working capital than the headline number may suggest.
Diversification means spreading investable assets across asset classes, sectors, and account types so no single holding dominates the portfolio. Tax efficiency refers to how much of your return you may keep after taxes.
How to track them
Split net worth into investable assets and illiquid assets, then track the investable share over time. Investable assets may matter more than total net worth for retirement readiness, so tracking them on their own may give a clearer picture.
For diversification, watch for concentration. If a large share of your investable assets sits in a single stock - especially employer stock or equity compensation - that may deserve attention. High earners with RSUs or stock options may model the tax impact of selling concentrated positions into broad index funds. Concentration may also show up in real estate or in holding too much cash.
For tax efficiency, focus on asset location, unrealized capital gains exposure, and tax drag. Putting the right investments in the right account types may improve after-tax results over time.
How useful they are for financial decisions
A "good" net worth by age may matter less than whether that net worth may support the goal you want. Investable assets are a direct input into retirement math, so they may be more useful than total net worth for judging retirement progress. If a large share of your wealth is tied up in illiquid assets, your retirement runway may be shorter than a simple net worth number may suggest.
Tax drag may compound over time. Smarter asset location and more intentional account management may preserve more of your returns. Mezzi may flag tax-loss harvesting, Roth conversion timing, and wash-sale risk across accounts.
How well they align with personal goals
If your goal is early retirement, investable assets may be the most relevant number to watch - not total net worth. If your goal is financial flexibility, diversification may reduce the risk that one bad outcome, like an employer stock drop or a real estate downturn, knocks a large hole in your balance sheet.
Tax efficiency may line up with almost every financial goal because keeping more of what you earn may leave more capital working for you. Asset location and other tax-aware habits may compound in your favor over time.
Pros and Cons of Using Net Worth by Age as a Scorecard
If the real issue is whether your net worth looks good for your age, a better test may be what that number actually lets you do.
Net worth by age may work as a quick benchmark. But it doesn't show liquidity, debt burden, or progress toward a specific goal. So the better yardstick may have less to do with rank and more to do with how much of your wealth is liquid, diversified, and still growing.
The table below shows where each measure may help most and where it may fall short.
The next question isn't whether the number looks good. It's whether the balance sheet may be strong enough to support the goal.
Percentiles may mislead when wealth is concentrated, illiquid, or tied to a business or employer stock. What a percentile table never shows is quality. Two people may have the same net worth, but those numbers may mean very different things depending on how the assets are held.
For example, one person may hold liquid, diversified, tax-efficient assets. Another may have most of their wealth locked in a business, a house, or employer stock. Same paper net worth. Very different financial flexibility.
Used alongside savings rate, cash flow, debt quality, and investable assets, net worth by age may be a starting point, not the answer.
Conclusion
A good net worth by age may not be about percentile rank. It may be more about a balance sheet that’s growing, resilient, and tied to a clear goal.
Percentile tables may be skewed by a small group of very wealthy households. That’s why the better test may not be rank, but trajectory.
A more useful check may be whether your net worth is rising, your debt may be manageable, your assets may be diversified and tax-efficient, and your money may be moving you toward a specific goal. A modest net worth with strong savings and diversified assets may put someone in a better spot than a larger balance sheet that may be concentrated or illiquid.
Percentiles are a snapshot. Savings rate, debt quality, investable assets, and progress toward a goal may show the trend.
FAQs
Should I use median or average net worth by age?
Neither one may make sense as your main yardstick. Median or average net worth by age may be a decent starting point, but those numbers are generic. They may miss the stuff that shapes your actual situation, like career shifts, cost of living, debt, and concentrated equity compensation.
A more useful focus for some people may be savings rate, investment efficiency, tax-aware strategies, and steady progress toward personal goals.
How much of my net worth should be investable?
Treat investable as the part of your net worth you may actually put to work: cash, stocks, bonds, and retirement accounts like a 401(k) or IRA. Illiquid assets, such as your primary home, are often left out.
When people make investment decisions, they often focus on investable assets instead of total net worth. For high-net-worth benchmarks, the SEC uses $750,000 in investable assets or $1.5 million in total net worth.
Can I still be on track with a low net worth?
Yes. A low net worth - or even a negative one - does not automatically mean you're off track. What may matter more is whether your finances are moving in the right direction: your savings rate, debt load, investing efficiency, and progress toward your goals.
It may make sense to update your net worth at least twice a year, include assets like your 401(k), and keep an eye on cash flow while working to reduce liabilities over time.
Disclosures:
- This content is for informational purposes only and does not constitute investment advice or a recommendation to buy or sell any security.
- Past performance is not indicative of future results. No guarantee of future performance or outcomes is implied.
Related Blog Posts
- Income vs net worth: why high earners are often still asset-poor
- Average net worth by age - and what it actually means for your goals
- How to build a personal balance sheet (and why you should)
- How to calculate your lifetime wealth ratio
Neither one may make sense as your main yardstick. Median or average net worth by age may be a decent starting point, but those numbers are generic. They may miss the stuff that shapes your actual situation, like career shifts, cost of living, debt, and concentrated equity compensation.
A more useful focus for some people may be savings rate, investment efficiency, tax-aware strategies, and steady progress toward personal goals.
Treat investable as the part of your net worth you may actually put to work: cash, stocks, bonds, and retirement accounts like a 401(k) or IRA. Illiquid assets, such as your primary home, are often left out.
When people make investment decisions, they often focus on investable assets instead of total net worth. For high-net-worth benchmarks, the SEC uses $750,000 in investable assets or $1.5 million in total net worth.
Yes. A low net worth - or even a negative one - does not automatically mean you're off track. What may matter more is whether your finances are moving in the right direction: your savings rate, debt load, investing efficiency, and progress toward your goals.
It may make sense to update your net worth at least twice a year, include assets like your 401(k), and keep an eye on cash flow while working to reduce liabilities over time.