The Boost · Mezzi’s Sunday email
I spoke to a lot of Mezzi members this week who are feeling uneasy about the sell-off—and wondering if now is the time to buy. Before putting new cash to work, the first step is checking what you can actually afford to invest and how it fits your broader plan.
What drove the selloff?
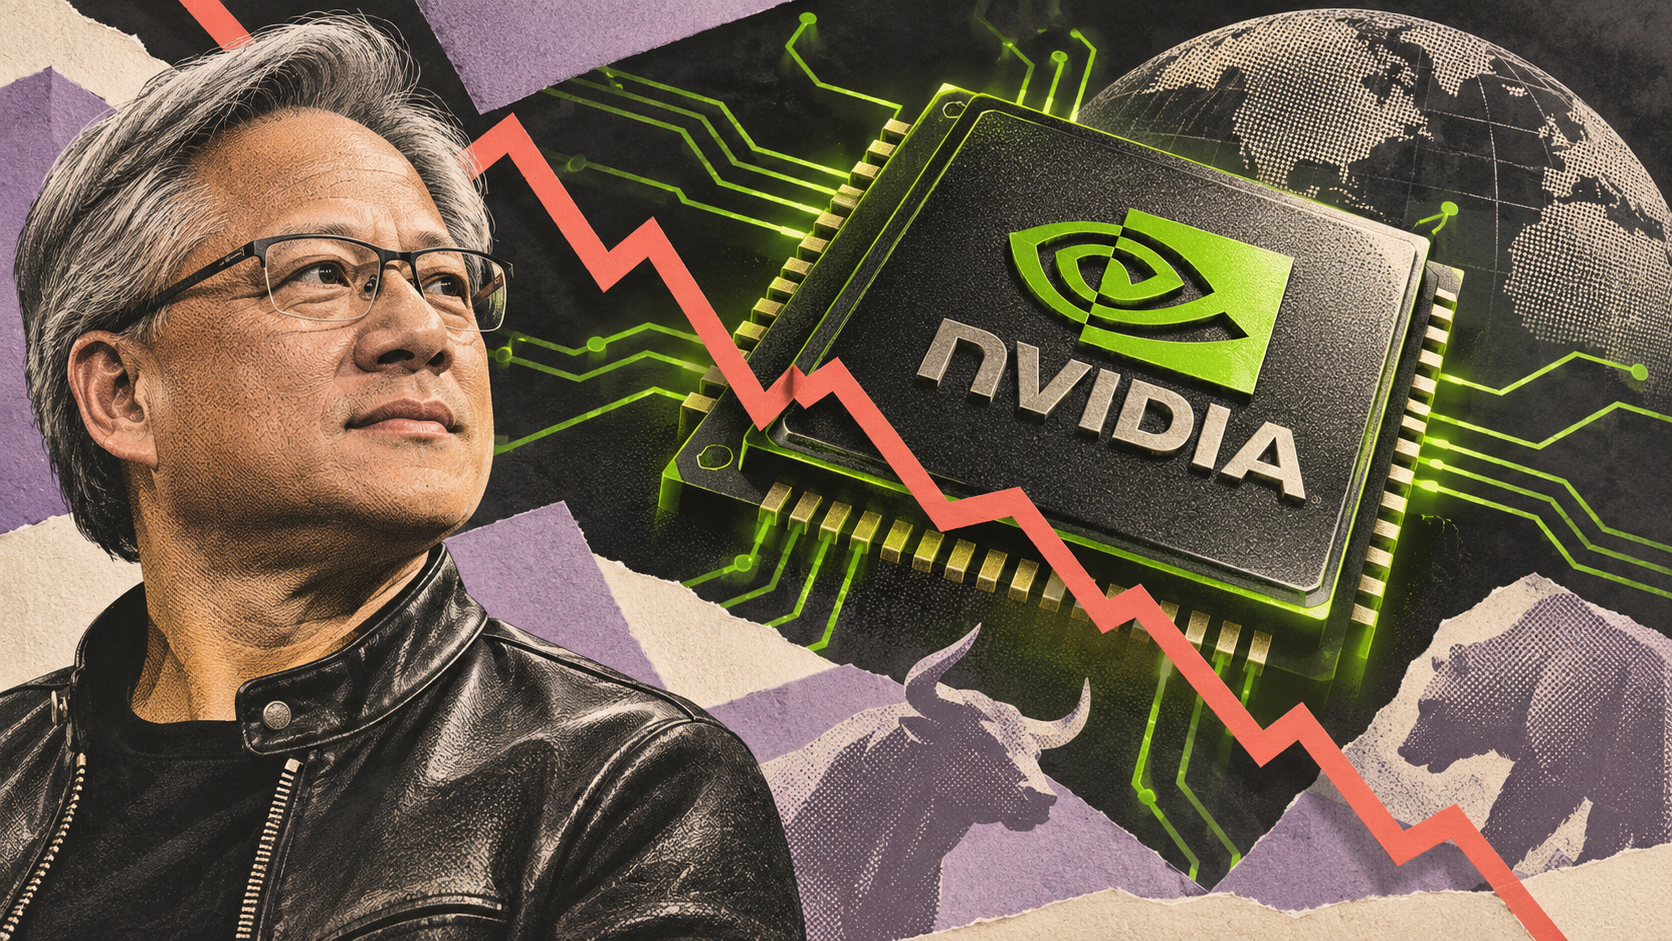
Jensen Huang’s departure from Nvidia, announced November 12, shook confidence in a company central to the AI boom. This week, the board ruled out his return—and ongoing regulatory investigations only added to the uncertainty. Anthropic’s volatile IPO late in the week further rattled sentiment across AI and chip stocks.
Nvidia alone accounted for an estimated 16.1% of the S&P 500’s decline this week. That’s how much one company can affect a broad index fund—even if you never bought its shares directly.
The selling also reflected broader worries about massive AI spending, Democratic wins in Congress raising the prospect of tighter tech oversight and fiscal standoffs, and stubborn inflation keeping interest rates higher for longer. The S&P 500 and Nasdaq Composite give larger companies more influence, so declines across the biggest technology names can pull both indexes down sharply.
This has been a tech-led selloff, but it hasn’t stayed in tech. For the week, the Nasdaq fell 10.02% and the S&P 500 dropped 8.61%, while the Dow fell 8.02% and the small-company Russell 2000 lost 7.48%.
Zoom out beyond this week
Both the S&P 500 and Nasdaq Composite are in correction territory: down at least 10% from a recent high. This is the S&P 500’s fourth correction in five years, after pullbacks in 2022, 2023, and 2025. The 2022 decline became a bear market, with a loss exceeding 20%. Corrections are a recurring part of investing, but crossing 10% doesn’t tell us where the decline will end. Here’s the longer view.
| Price change | S&P 500 | Nasdaq Composite |
|---|---|---|
| Past week | −8.61% | −10.02% |
| From Oct. 6 closing high | −11.6% | −18.1% |
| Past year | +5.7% | +2.4% |
| Past 2 years | +16.8% | +19.3% |
| Past 3 years | +52.0% | +58.3% |
| Past 5 years | +47.1% | +40.9% |
| Past 10 years | +216.7% | +325.0% |
Through Nov. 20, 2026 · Table: cumulative returns. Annual averages below: compounded. All exclude dividends.
Even after this week’s drop, the S&P 500 has averaged 8.02% a year over the past five years and 12.22% over the past ten.
Those long-term averages matter less if you need to sell investments now to pay your bills. Lower prices mean selling more shares to fund the same spending, leaving fewer shares to benefit from a recovery. That’s why a correction deserves a closer look when you’re approaching retirement.
Does your retirement plan still hold up?
Suppose you’re retiring with $3 million and plan to withdraw $120,000 a year, keeping up with inflation. A 6% portfolio drop takes $180,000 off your balance. Would you need to spend less or retire later?
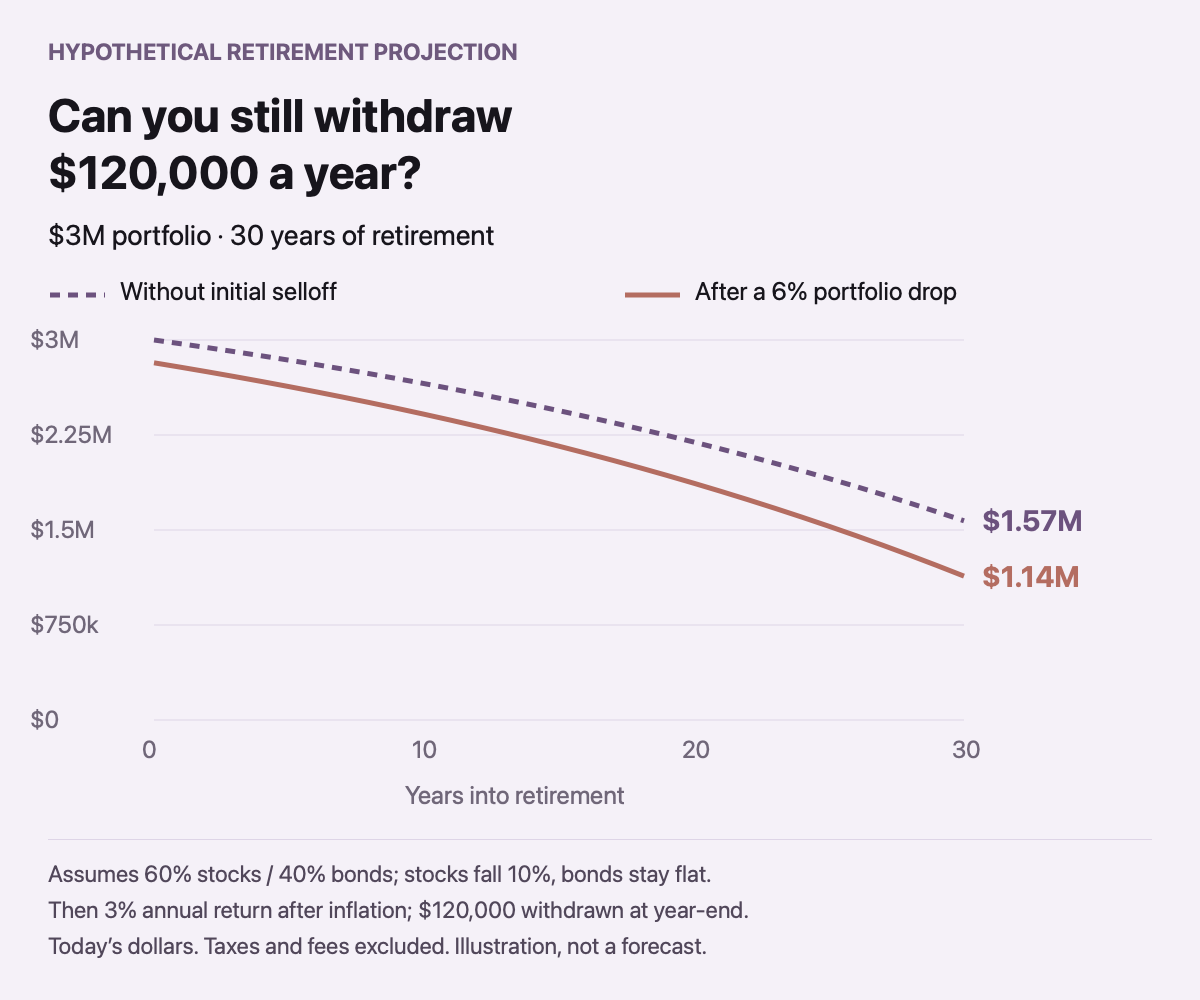
Under these assumptions, you could keep the same withdrawals for all 30 years. After 30 years, you’d still have about $1.14 million left, compared with $1.57 million without the drop. Both figures are in today’s dollars. Before changing your retirement date or spending, check whether your own plan still covers what you need.
A drop can create a tax opportunity
Tax-loss harvesting is worth checking now. Selling an investment at a loss in a taxable account can reduce the taxes on profits from investments you’ve sold this year. Unused losses may carry forward to future years.
- Check what you paid. A sharp drop doesn’t create a tax loss if the shares are still worth more than their purchase cost.
- Know the real tax value. A $10,000 loss offsets gains; it isn’t a $10,000 tax credit. Your benefit depends on your tax rates and when you can use the loss.
- Watch the wash-sale window. Buying the same or a substantially identical investment during the 61-day window—from 30 days before the sale through 30 days after, including the sale date—can disallow the loss. Check automatic dividend reinvestments and your spouse’s accounts, too. Buying the replacement in an IRA can permanently erase the tax deduction for that loss.
Before selling, check the profits and losses you’ve already taken this year and any unused losses from earlier years. Choose a replacement that fits your plan.
- Find investments worth less than you paid.
- Check wash-sale risks and choose a replacement.
- Sell to realize the loss; reinvest to keep your plan on track.
- Use the loss to offset capital gains; carry unused losses forward.
Thinking about buying the dip?
I had cash sitting in my retirement accounts from recent dividend payments. This week’s drop left me second-guessing myself—I didn’t want to buy too early, but I also didn’t want to miss a good entry point. How much should I invest, what should I buy, and should I do it now? I ended up investing a portion of it and keeping some cash on the sidelines while the dust settles.
If you’re feeling that same hesitation, you’re not alone—though the research generally favors investing sooner. For cash you’ve already decided to invest, putting it all in at once has usually beaten buying gradually. Smaller purchases on set dates can ease the nerves, but you could miss gains while you wait. Choose an approach that feels right for you.
Make room for the holidays, too
With holiday spending coming up, a falling portfolio can make even ordinary purchases feel uncertain. Put a number on gifts and travel, then check it against your cash flow, reserves, and goals. You shouldn’t have to guess whether that spending puts your retirement plan at risk.
Get a clear next step for your portfolio
For a clearer picture before the holiday rush, start with our free membership and take advantage of Mezzi’s Diversification X-Ray. See how much of your money is invested in the same companies across different funds.
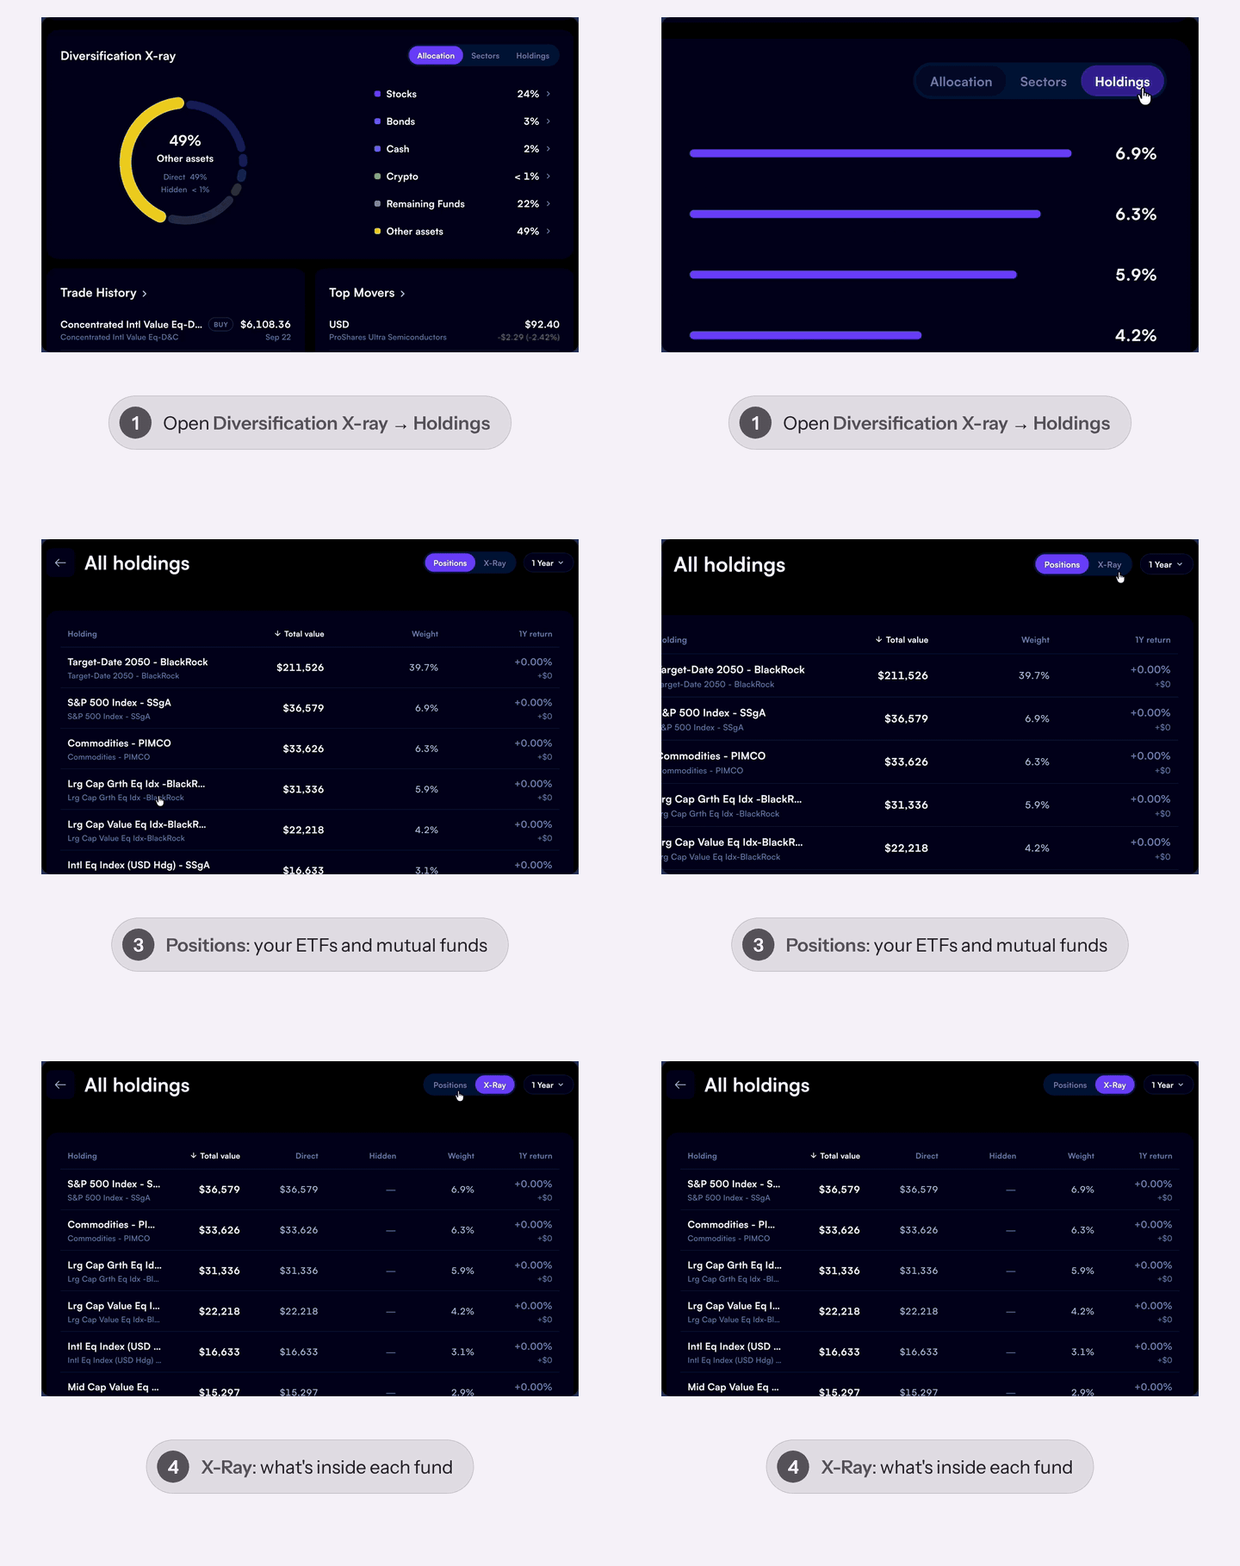
Next, ask Mezzi whether your investments fit your retirement plans and what to do next: leave things as they are, adjust your holdings, invest cash, or use losses to reduce taxes.
For personalized advice, use code BF20 for 20% off a Mezzi membership. Get a clear view of what you own and a concrete plan heading into Black Friday shopping, the holidays, and the new year.
Does your retirement plan still hold up after the selloff?
Build an action plan for freeRecent tax planning guides
- Before you sell your biggest winner
- Don’t let the tax bill make the decision
- What your CPA may not be telling you
- The year I left money on the table
- Staying ahead of the costs you didn’t plan for
Be wealthy,
For informational purposes only; not investment advice. Past performance does not guarantee future results. Examples are illustrative; actual results will vary. Mezzi is an SEC Registered Investment Adviser (CRD #337818).
Registration does not imply a certain level of skill or that the SEC has approved the company or its services.
Federal and state tax treatment may differ. Responses to the linked Mezzi prompt are AI-generated and may contain errors. Confirm figures and applicable rules before acting.
Sources: Index weights; Nvidia price history; Nvidia; AP market close; Nvidia board decision; S&P history; Nasdaq history; IRS Publication 550; Vanguard: lump sum vs. cost averaging; Schwab: correction history; Fidelity: November correction; Reuters: AI selloff and rates; Allianz: midterm policy outlook. Weekly contribution estimate covers November 13–20 closes: Nvidia’s reconstructed starting index weight (6.0448%) times its price return (−22.9168%), divided by the S&P 500’s return (−8.6129%), equals 16.1% of the decline. Starting weight reconstructed from State Street’s November 19 index weight (5.71%) and relative price changes; assumes unchanged index shares and divisor. Measures direct index contribution, not spillover effects on other stocks.